3071
Diffusion sensitivity of spin echo sequences affects white matter R2 fiber orientation dependency1Department of Neuroradiology, Medical University of Innsbruck, Innsbruck, Austria, 2Department of Radiology, Medical University of Innsbruck, Innsbruck, Austria, 3UBC MRI research Centre, University of British Columbia, Vancouver, BC, Canada
Synopsis
We investigated how the sensitivity of spin-echo and turbo spin echo MRI sequences to diffusion processes affects the estimation of fiber orientation dependent R2 in white matter. Our results indicate that the strongest R2 orientation dependency is observed when R2 is estimated using multiple single spin echo sequences. The lowest R2 orientation dependency was observed for the multi-echo spin echo sequence.
Introduction
MR transversal relaxation rates have been reported to be sensitive to white matter fiber orientation in the brain. The orientation dependency of the gradient echo signal, and thus R2*, is well studied1–5 whereas for R2 only a few studies exists6,7. The quantification of R2 in the brain is challenging, as a variety of different effects influence the transverse signal decay. Traditionally, R2 is estimated by using a multi-echo spin-echo (SE) sequence followed by fitting a mono-exponential or multi-exponential signal model. By using a multi-echo SE sequence stimulated echo effects occur, whereas the use of multiple single echo SE sequences with different TE is time consuming and affected by J-coupling and diffusion effects at longer echo times. In contrast to single echo SE sequences the multiple 180 degree pulses in turbo spin echo (TSE) sequences reduce diffusion mediated susceptibility dephasing and suppress J-coupling8. The purpose of this study was to investigate to what degree R2 fiber orientation dependency is influenced by the choice of the MRI sequence which is used to estimate the underlying R2.Methods
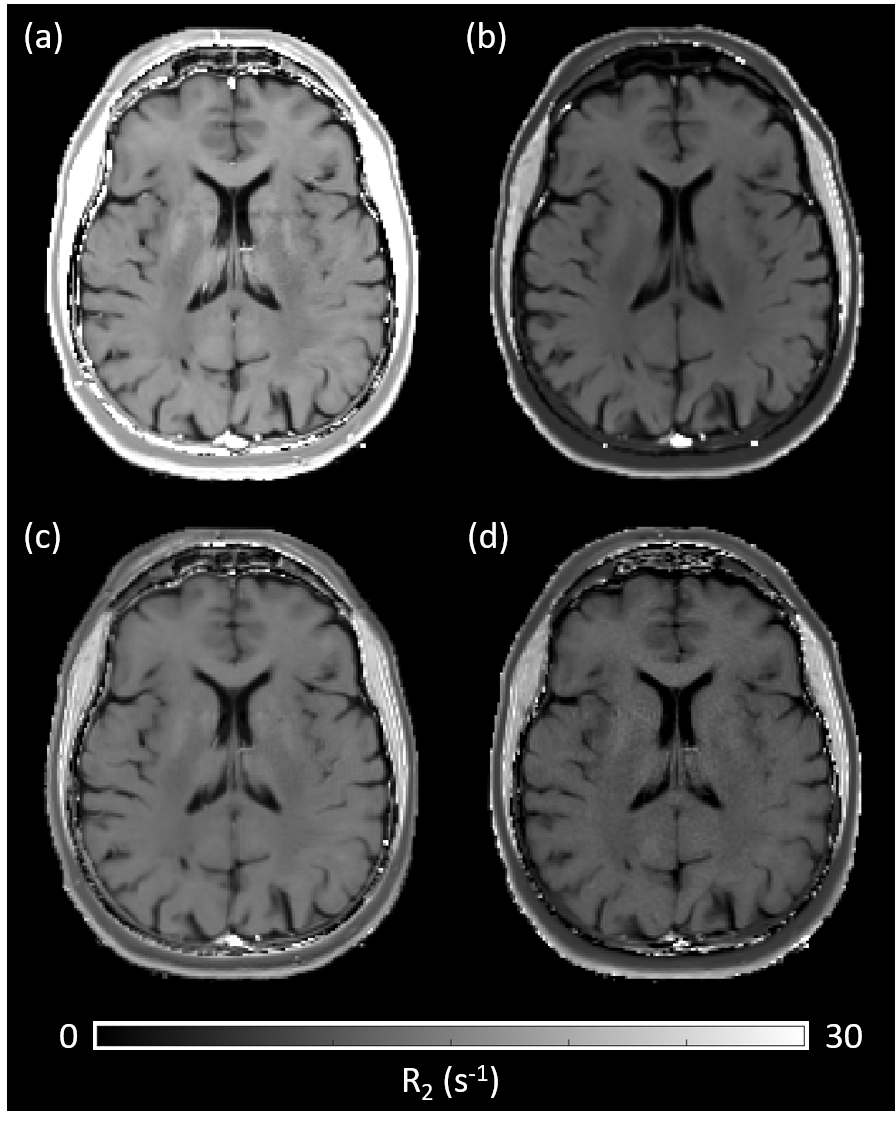
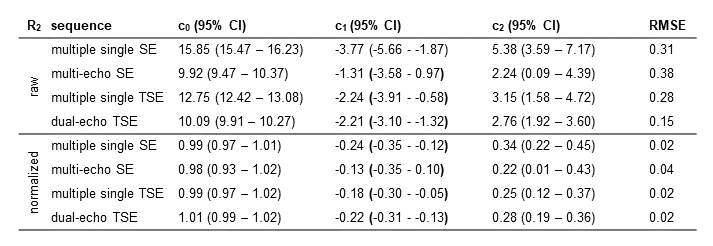
We acquired R2 using different sequences, DTI and T1 weighted images of a volunteer on a 3T Siemens MAGNETOM Skyra MR system using a 64-channel head coil. For estimating R2 we acquired the following sequences: (I) a 2D multi-echo SE sequence with 32 echos, TE1 = 10 ms and deltaTE = 10 ms. (II) multiple single echo SE sequences and (III) multiple single echo TSE sequences both with TE = 10, 20, 30, 40, 50, 60, 70, 80, 90, 100, 120, 140, 160, 200, 240 and 280 ms and a turbo factor of 7. (IV) a dual-echo TSE sequence with TE1 = 10 ms and TE2 = 93 ms. All SE and TSE sequences had a TR = 975 ms. For calculation of the fiber orientation DTI was acquired using a 2D spin-echo echo-planar imaging (SE-EPI) sequence with TE = 95 ms, TR = 7000 ms, b-value = 1000 s/mm2 and 20 diffusion directions. All sequences were acquired with the same resolution of 1.0x1.0x3.0 mm3 in axial orientation. R2 was fitted by assuming a mono-exponential decay. The fiber orientation was calculated as the angle Θ between the first eigenvector and the direction of the B0 field. R2 as a function of fiber angle was fitted according to a previous model7 using R2(Θ) = c0 + c1*sin(Θ)2 + c2*sin(Θ)4, with c0 representing the orientation independent component, c1 the orientation dependent component due to the interaction of spins with field gradients caused by the myelinated fibers and c2 the orientation dependent component due to diffusion of spins.Results
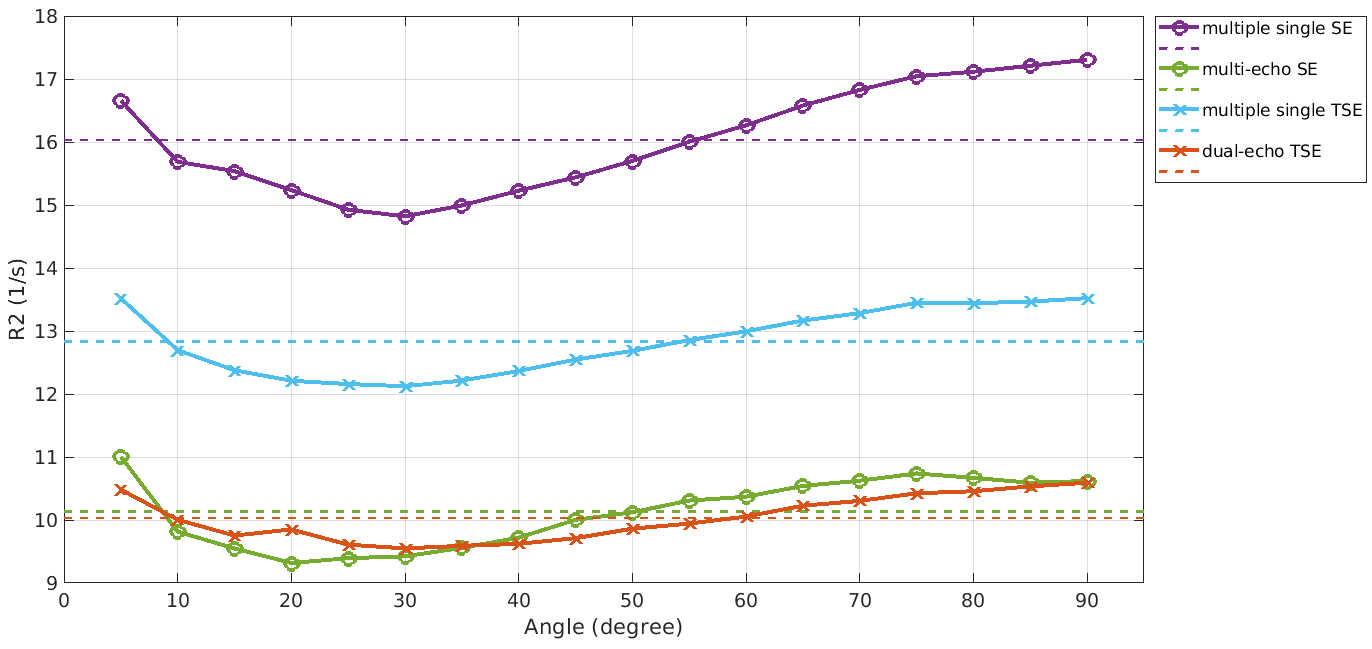
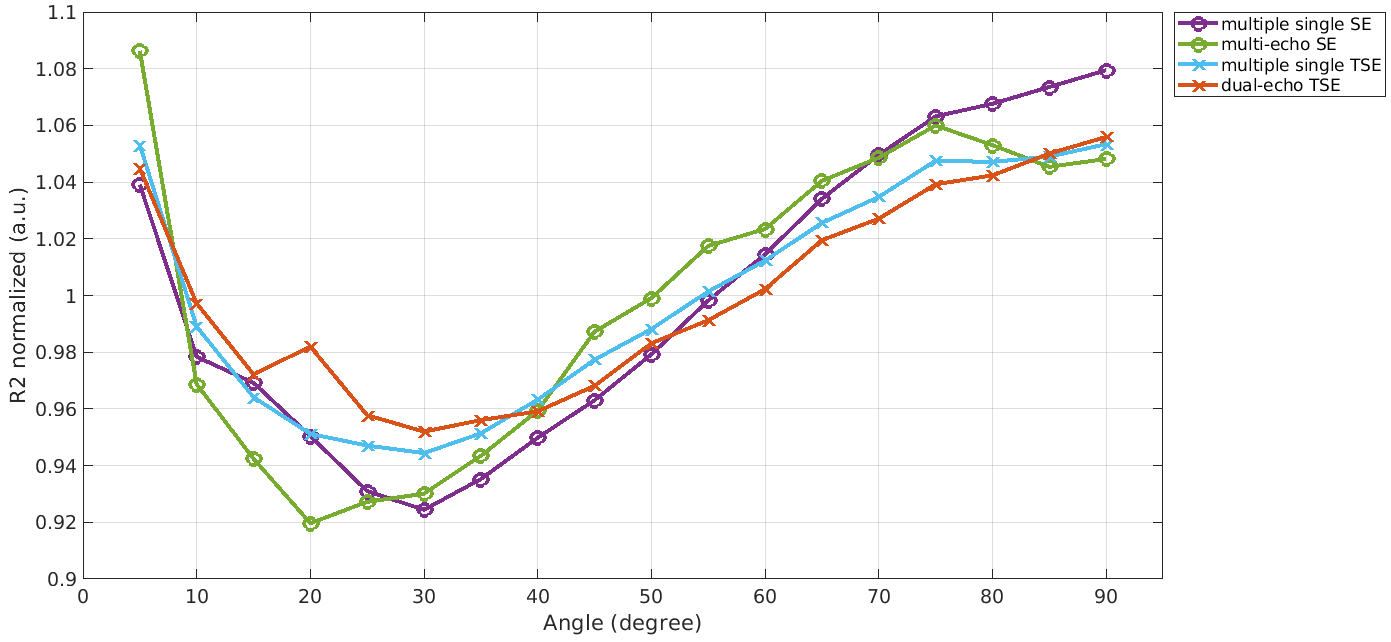
A difference in R2, depending on the chosen MRI sequence is evident as shown in Figure 1. Estimating R2 using multiple single echo SE sequences lead to the overall highest R2 values whereas the lowest R2 values were estimated using a multi-echo SE or dual-echo TSE sequence. The relationship between R2 and the white matter fiber angle for the different sequences is shown in Figure 2. Assessing R2 using multiple single echo SE sequences revealed the strongest orientation dependency with c1 = -3.77 and c2 = 5.38. The lowest orientation dependency with c1 = -1.31 and c2 = 2.24 was observed when R2 was assessed using a multi-echo SE sequence. Furthermore, a R2 orientation dependency with c1 = -2.24 and c2 = 3.15 was observed for the multiple single echo TSE sequences. After normalization of R2 to global average white matter R2, the difference in R2 fiber orientation dependency in relation to the chosen sequence is even more evident as shown in Figure 3. All fitting parameters of the R2 orientation model are summarized in Table 1.Discussion and Conclusion
In our work we showed that white matter R2 fiber orientation dependency is influenced by the chosen MRI sequence for assessing R2. Diffusion processes seem to have a strong influence on the orientation dependency of R2. This is evident as the R2 fiber orientation dependent component related to sin(Θ)4 is higher that the component related to sin(Θ)2. This suggests that the diffusion of spins contribute more to the orientation dependency of R2 compared to the interaction of spins with applied field gradients caused by the geometry of the myelinated fibers.7 This is further supported by our observation that when acquiring R2 with sequences which are more sensitive to diffusion effects the orientation dependent contribution is higher compared to sequences with low sensitivity to diffusion effects. The strong R2 orientation dependency of the single echo SE sequence is due to the sensitivity of this sequence to diffusion processes, compared to single echo TSE sequence which is less sensitive to diffusion and therefore results in a lower R2 orientation dependency. In addition to diffusion perturbation of J-coupling in TSE sequences shortens R2 leading to lower orientation dependency compared to SE sequences. Based on our observation we conclude that, diffusion processes affect the estimation of orientation dependent R2 and therefore the choice of MRI sequence for assessing R2 plays an important role.Acknowledgements
References
1. Bender B, Klose U. The in vivo influence of white matter fiber orientation towards B0 on T2* in the human brain. NMR Biomed. 2010;23:1071–1076 doi: 10.1002/nbm.1534.
2. Denk C, Torres EH, MacKay A, Rauscher A. The influence of white matter fibre orientation on MR signal phase and decay. NMR Biomed. 2011;24:246–252 doi: 10.1002/nbm.1581.
3. Lee J, van Gelderen P, Kuo L-W, Merkle H, Silva AC, Duyn JH. T2*-based fiber orientation mapping. Neuroimage 2011;57:225–34 doi: 10.1016/j.neuroimage.2011.04.026.
4. Wharton S, Bowtell R. Fiber orientation-dependent white matter contrast in gradient echo MRI. Proc. Natl. Acad. Sci. U. S. A. 2012;109:18559–64 doi: 10.1073/pnas.1211075109.
5. Oh SH, Kim YB, Cho ZH, Lee J. Origin of B0 orientation dependent R2* (=1/T2*) in white matter. Neuroimage 2013;73:71–79 doi: 10.1016/j.neuroimage.2013.01.051.
6. Gil R, Khabipova D, Zwiers M, Hilbert T, Kober T, Marques JP. An in vivo study of the orientation-dependent and independent components of transverse relaxation rates in white matter. NMR Biomed. 2016;29:1780–1790 doi: 10.1002/nbm.3616.
7. Knight MJ, Wood B, Couthard E, Kauppinen R. Anisotropy of spin-echo T 2 relaxation by magnetic resonance imaging in the human brain in vivo. Biomed. Spectrosc. Imaging 2015;4:299–310 doi: 10.3233/bsi-150114.
8. Henkelman RM, Hardy PA, Bishop JE, Poon ECS, Plewes DB. Why fat is bright in rare and fast spin‐echo imaging. J. Magn. Reson. Imaging 1992;2:533–540 doi: 10.1002/jmri.1880020511.
Figures