3069
Derivation of Water Exchange Constants between Components using Quantitative Parameter Mapping (QPM).1Graduate of Health Science, Tokushima University, Tokushima, Japan, 2Graduate School of Biomedical Sciences, Tokushima University, Tokushima, Japan, 3Healthcare Business Unit, Hitachi, Ltd., Tokyo, Japan, 4College of Medical, Pharmaceutical and Health Sciences, Kanazawa University, Kanazawa, Japan
Synopsis
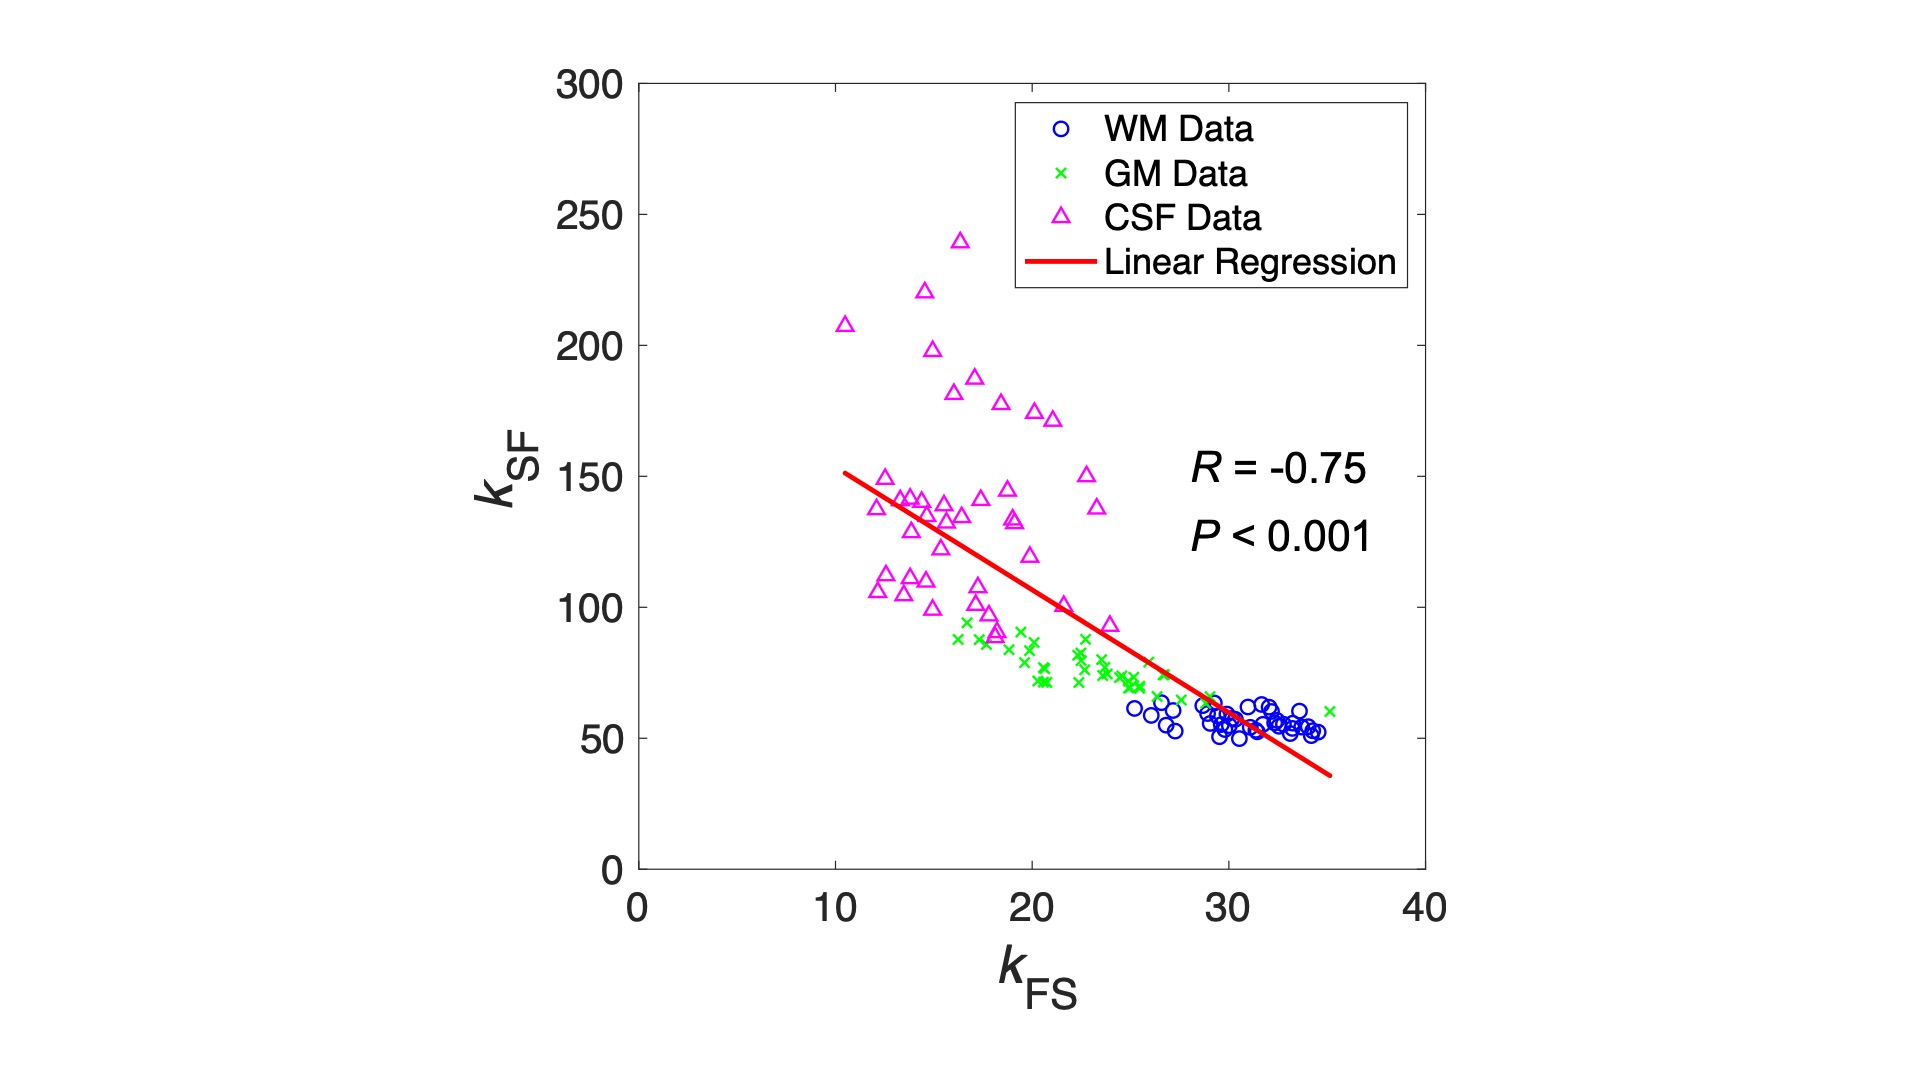
We developed a method for deriving water exchange rate based on mcDESPOT approach between two structures using quantitative parameters calculated from QPM-MRI. Our method was performed with human study for ten healthy volunteers and one patient with brain tumor. There was a significant negative correlation between kFS and kSF derived from QPM in each region, e.g., white matter, gray matter, and cerebral spinal fluid of healthy volunteers. (R = -0.75, P < 0.001). In conclusion, water exchange rates derived from QPM make it possible to obtain more detailed information of the brain associated with proton diffusion between structures, i.e., cross-relaxation.
Introduction
The interaction between macromolecular protons and water protons with its surrounding, i.e., spin-lattice relaxation, is dominated by cross-relaxation, which greatly affects the degree of longitudinal relaxation rate (R1).1 The multicomponent driven equilibrium single pulse observation of T1 and T2 (mcDESPOT) model the water exchange pool by partial saturation using the spoiled gradient-echo (SPGR) and balanced steady-state free preparation (bSSFP) signal equations; as a result, the relaxation time of each component in the tissue can be calculated.2,3 This approach can be used to calculate the water characterization of each component by taking into consideration the water exchange pool of the microneuronal structure (e.g., axon, myelin, and extracellular cavity). One of the mcDESPOT parameters, the water exchange rate, uses the degree of proton diffusion between structures for cross-relaxation. Recently, QPM has been used in various clinical applications because of its ability to accurately estimate quantitative parameters (T1, T2, PD, B1).4-6 The use of QPM in the mcDESPOT approach may improve accuracy when deriving water exchange rates, because the parameters related to relaxation time are compensated. The purpose of this study is to devise and validate a method for deriving water exchange rate by cross-relaxation between two structures, using quantitative parameters calculated from QPM-MRI.Materials and Methods
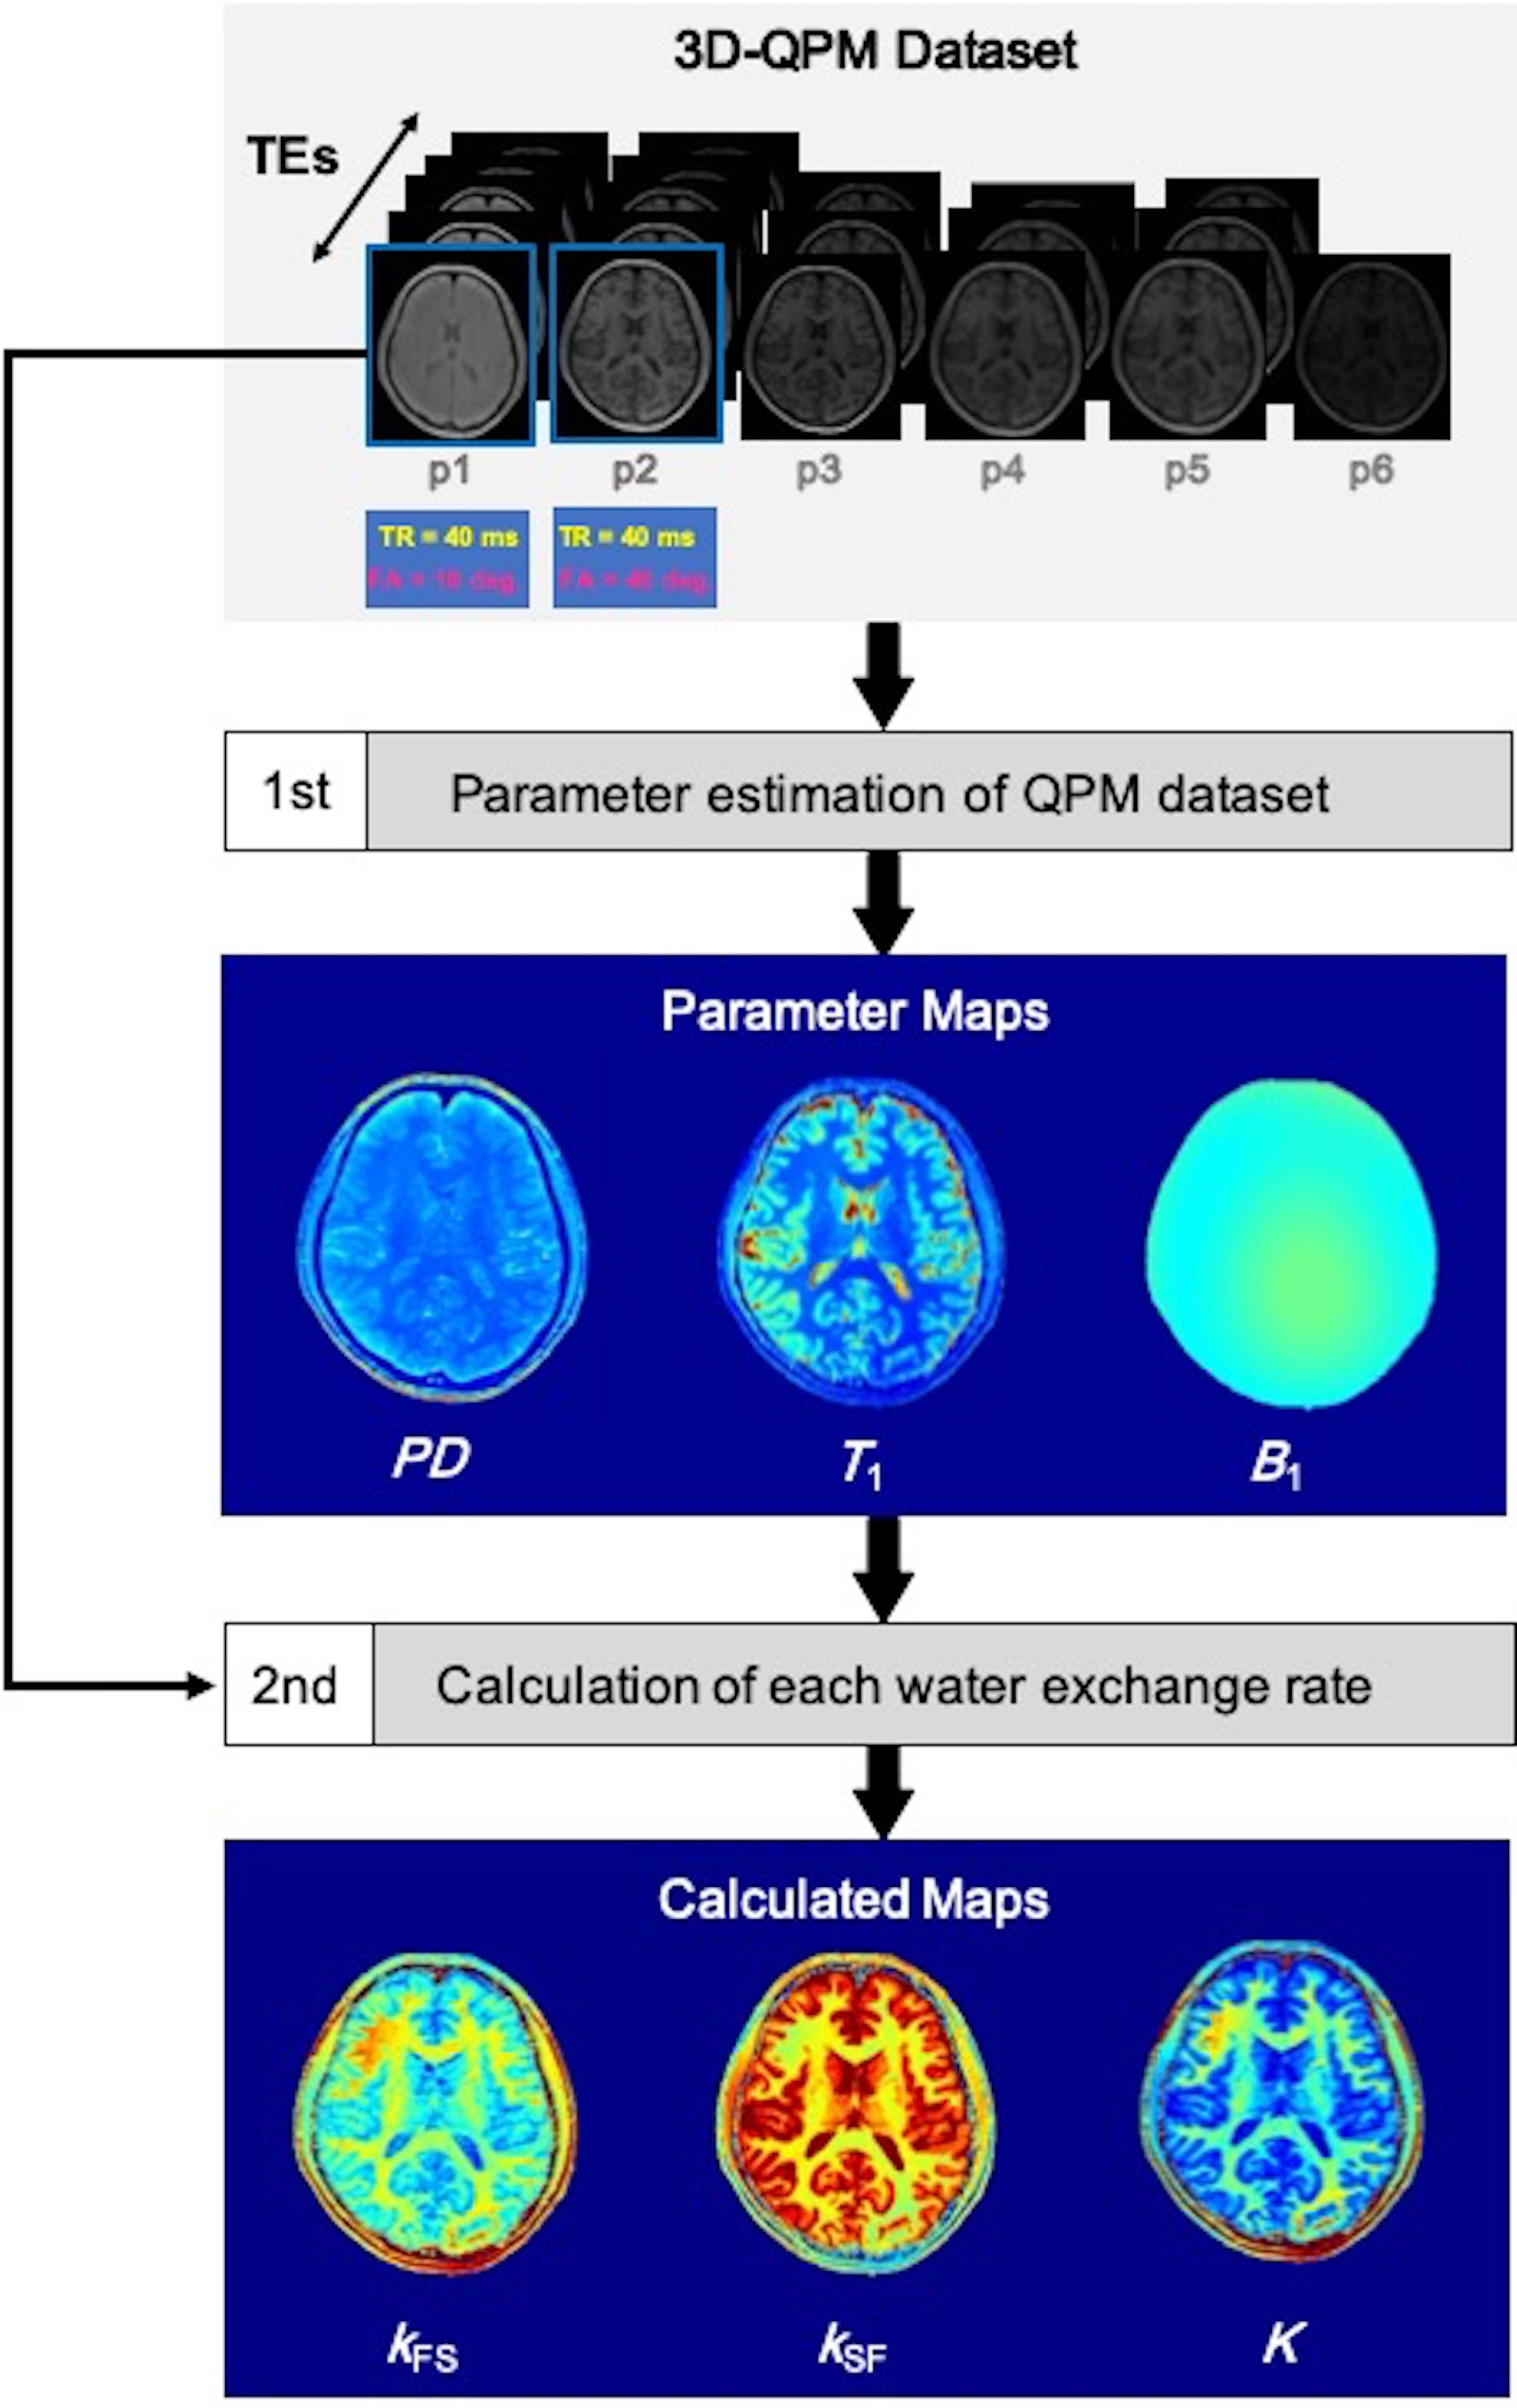
In this study, we examined ten healthy volunteers (male; mean age, 25 ± 6.9 years) and one patient with a brain tumor. All MRI data were acquired on a 3T MRI system (Hitachi, Ltd.), and QPM dataset was obtained using the Rf-Spoiled Steady State Gradient-echo (RSSG) method; the imaging parameters for QPM imaging were echo time (TE), 4.6-23 ms (ΔTE, 4.6 ms); repetition time (TR), 10, 20, and 30 ms; flip angle (FA), 10 and 40 degrees; matrix size, 192 × 192 × 240; and field of view, 192 mm. Figure 1 shows schematic illustration of calculation imaging procedure of water exchange rates derived from QPM. After acquiring the QPM dataset, we estimated each parameter map (1st step in Fig.1). Then, using the QPM maps (T1, PD, and B1), the water exchange rate was calculated from the following equation, using a deformed derivation equation from the mcDESPOT model equation (2nd step in Fig. 1);$$$M_{SPGR}^{T}\sin \alpha-S_{SPGR}^{T}=(M_{SPGR}^{T}\sin\alpha-S_{SPGR}^{T}\cos\alpha)e^{A_{SPGR}\ \ TR}$$$, (Eq.1)
$$$A_{SPGR}=\left[\begin{array}{ccc}-\frac{1}{T_{1,F}}-k_{FS} & k_{SF} \\k_{FS} & -\frac{1}{T_{1,S}}-k_{SF} \\\end{array}\right]$$$, (Eq.2)
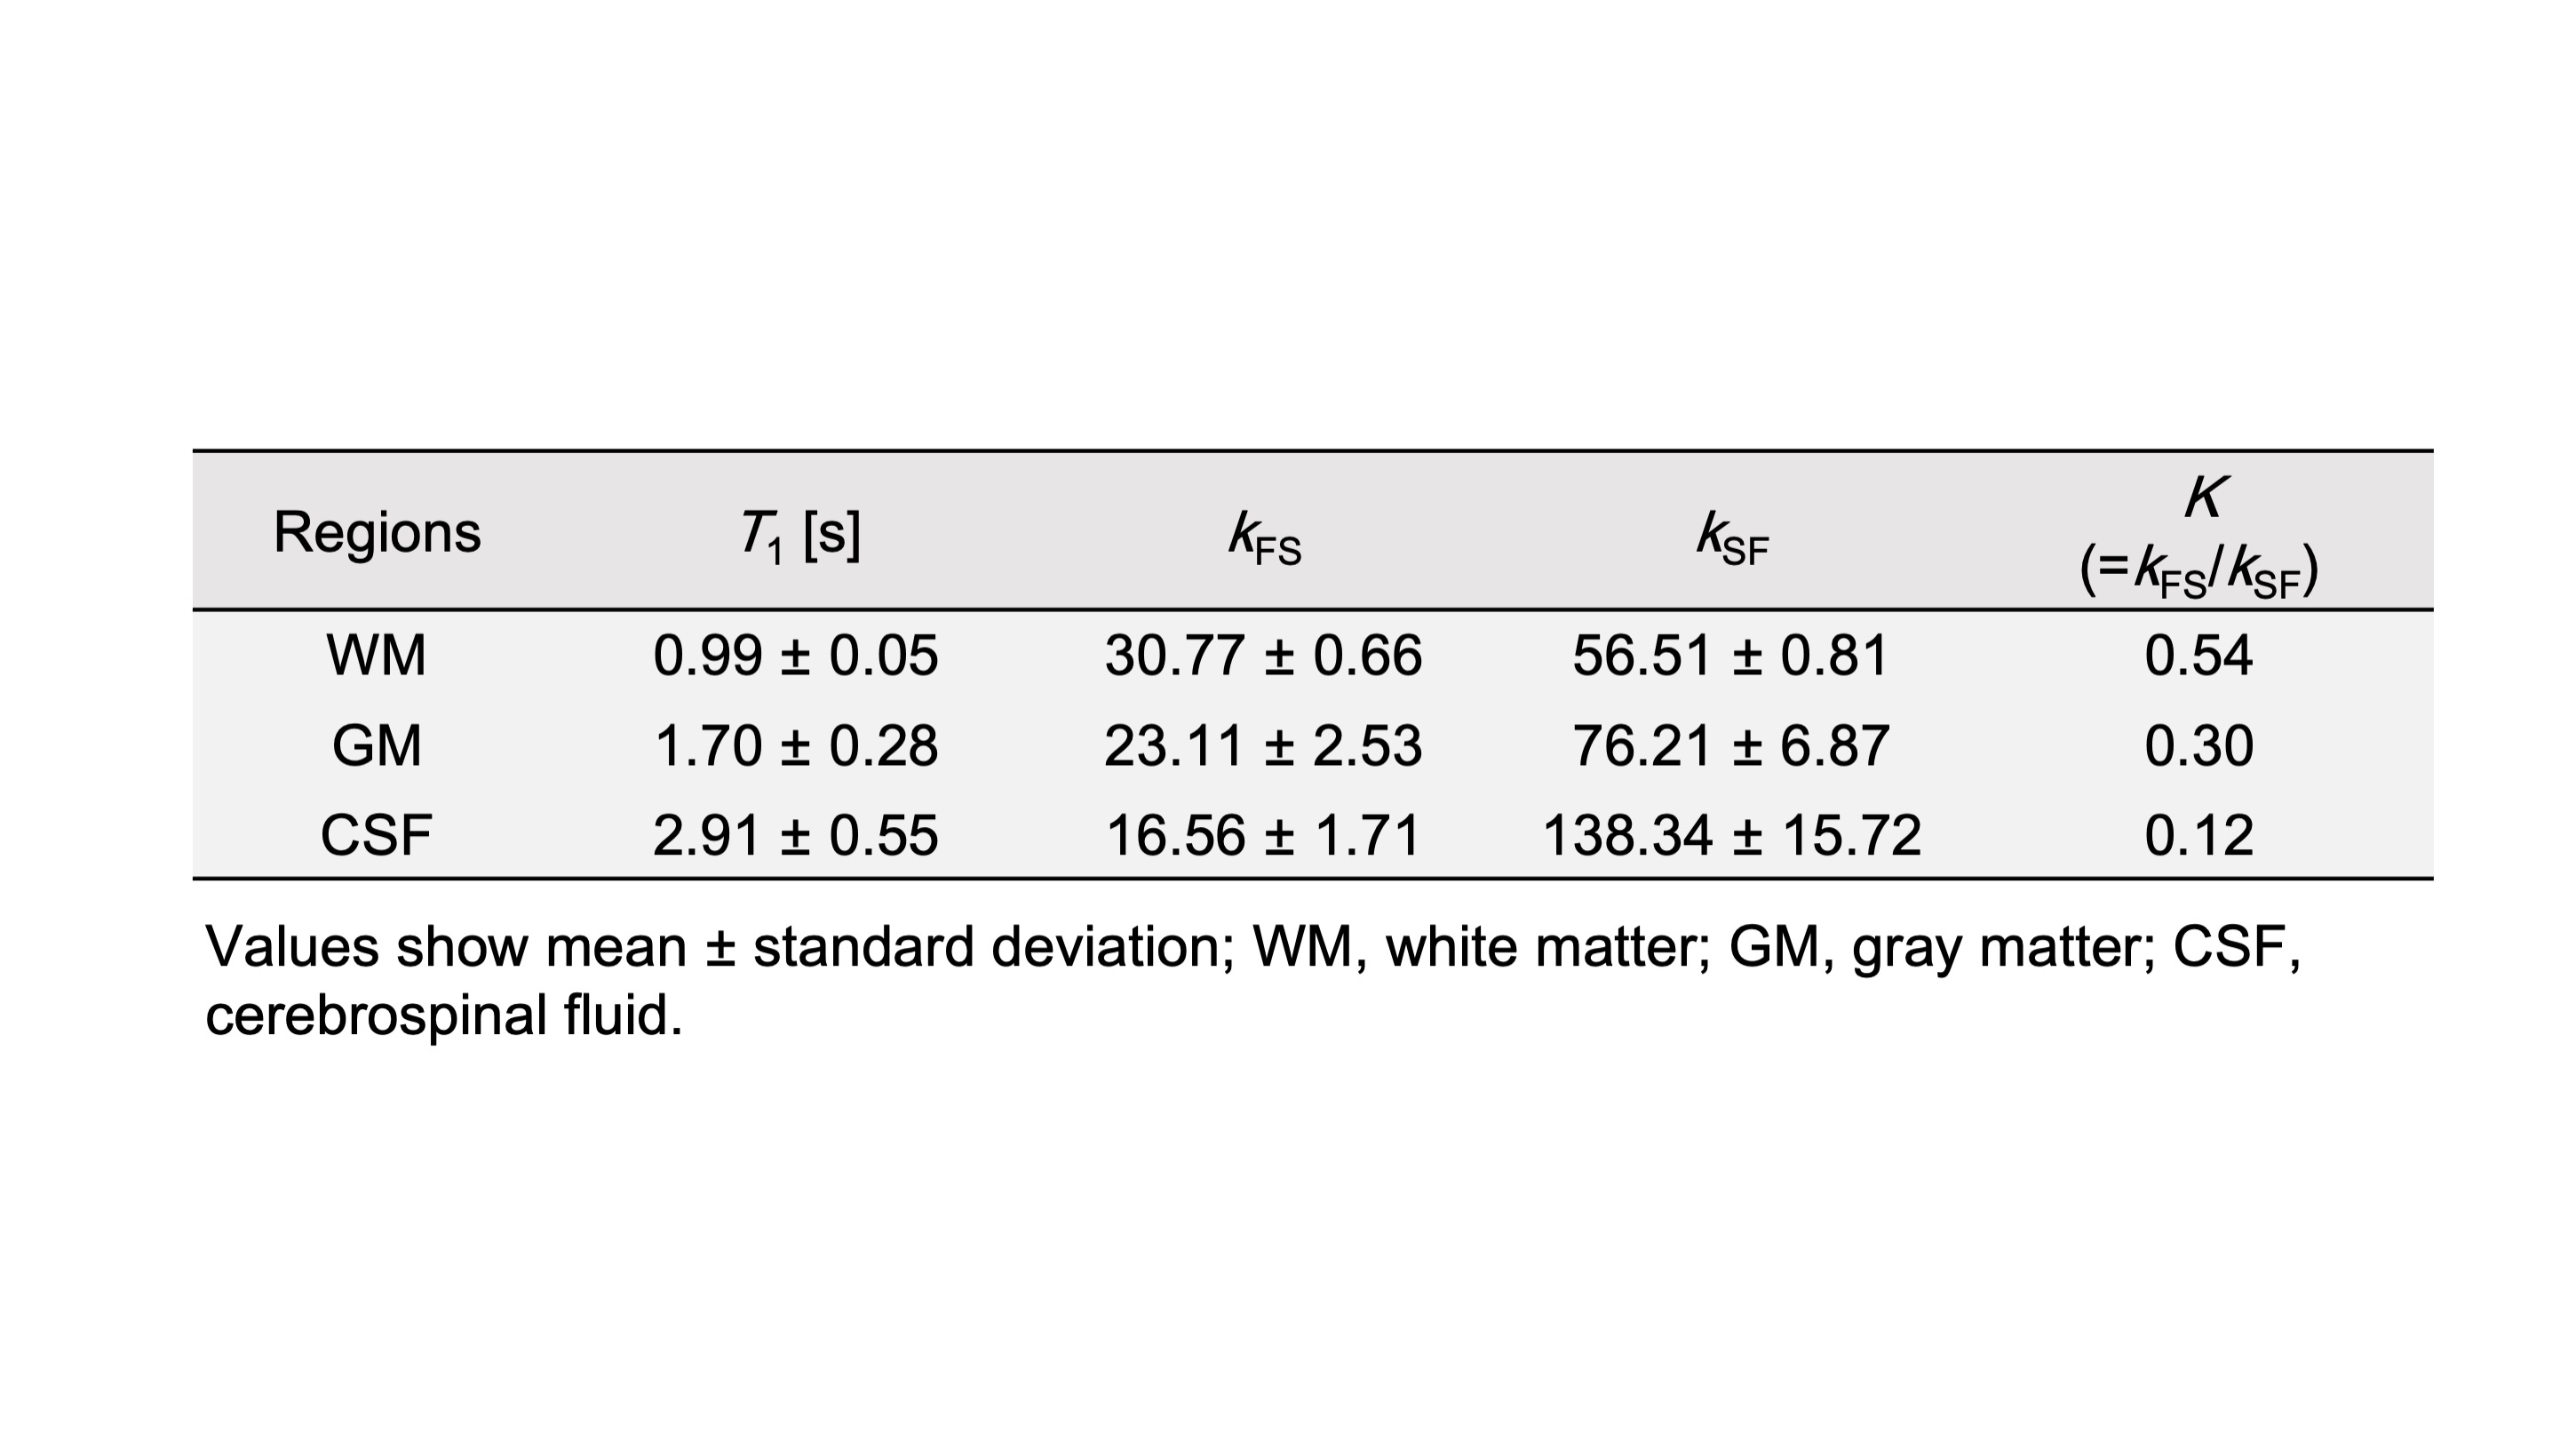
where MSPGR is the proton density, SSPGR is the signal value of the FA, T1,F and T1,S are the T1 values of the fast (F) and slow (S) species, respectively, T denotes the transpose of the matrix, and kFS is the exchange rate from F to S, kSF is the exchange rate from S to F. The tissue proton pool was designated as the fast relaxation component and bulk water proton pool as the slow relaxation component, in the cross-relaxation process. The parameter settings for deriving the water exchange rate are T1,F, T1 value derived from QPM; T1,S, 5000 ms; MSPGR, PD derived from QPM; SSPGR, each QPM dataset signal of FA = 10, 40 degrees and TR = 30 ms. Region of interest (ROI) analysis was performed for each parameter image; the setting regions were in the white matter (WM), gray matter (GM), and cerebral spinal fluid (CSF) at the basal ganglia level. A linear regression analysis was performed to determine the relationship between the kFS and kSF water exchange rates.
Results and Discussion
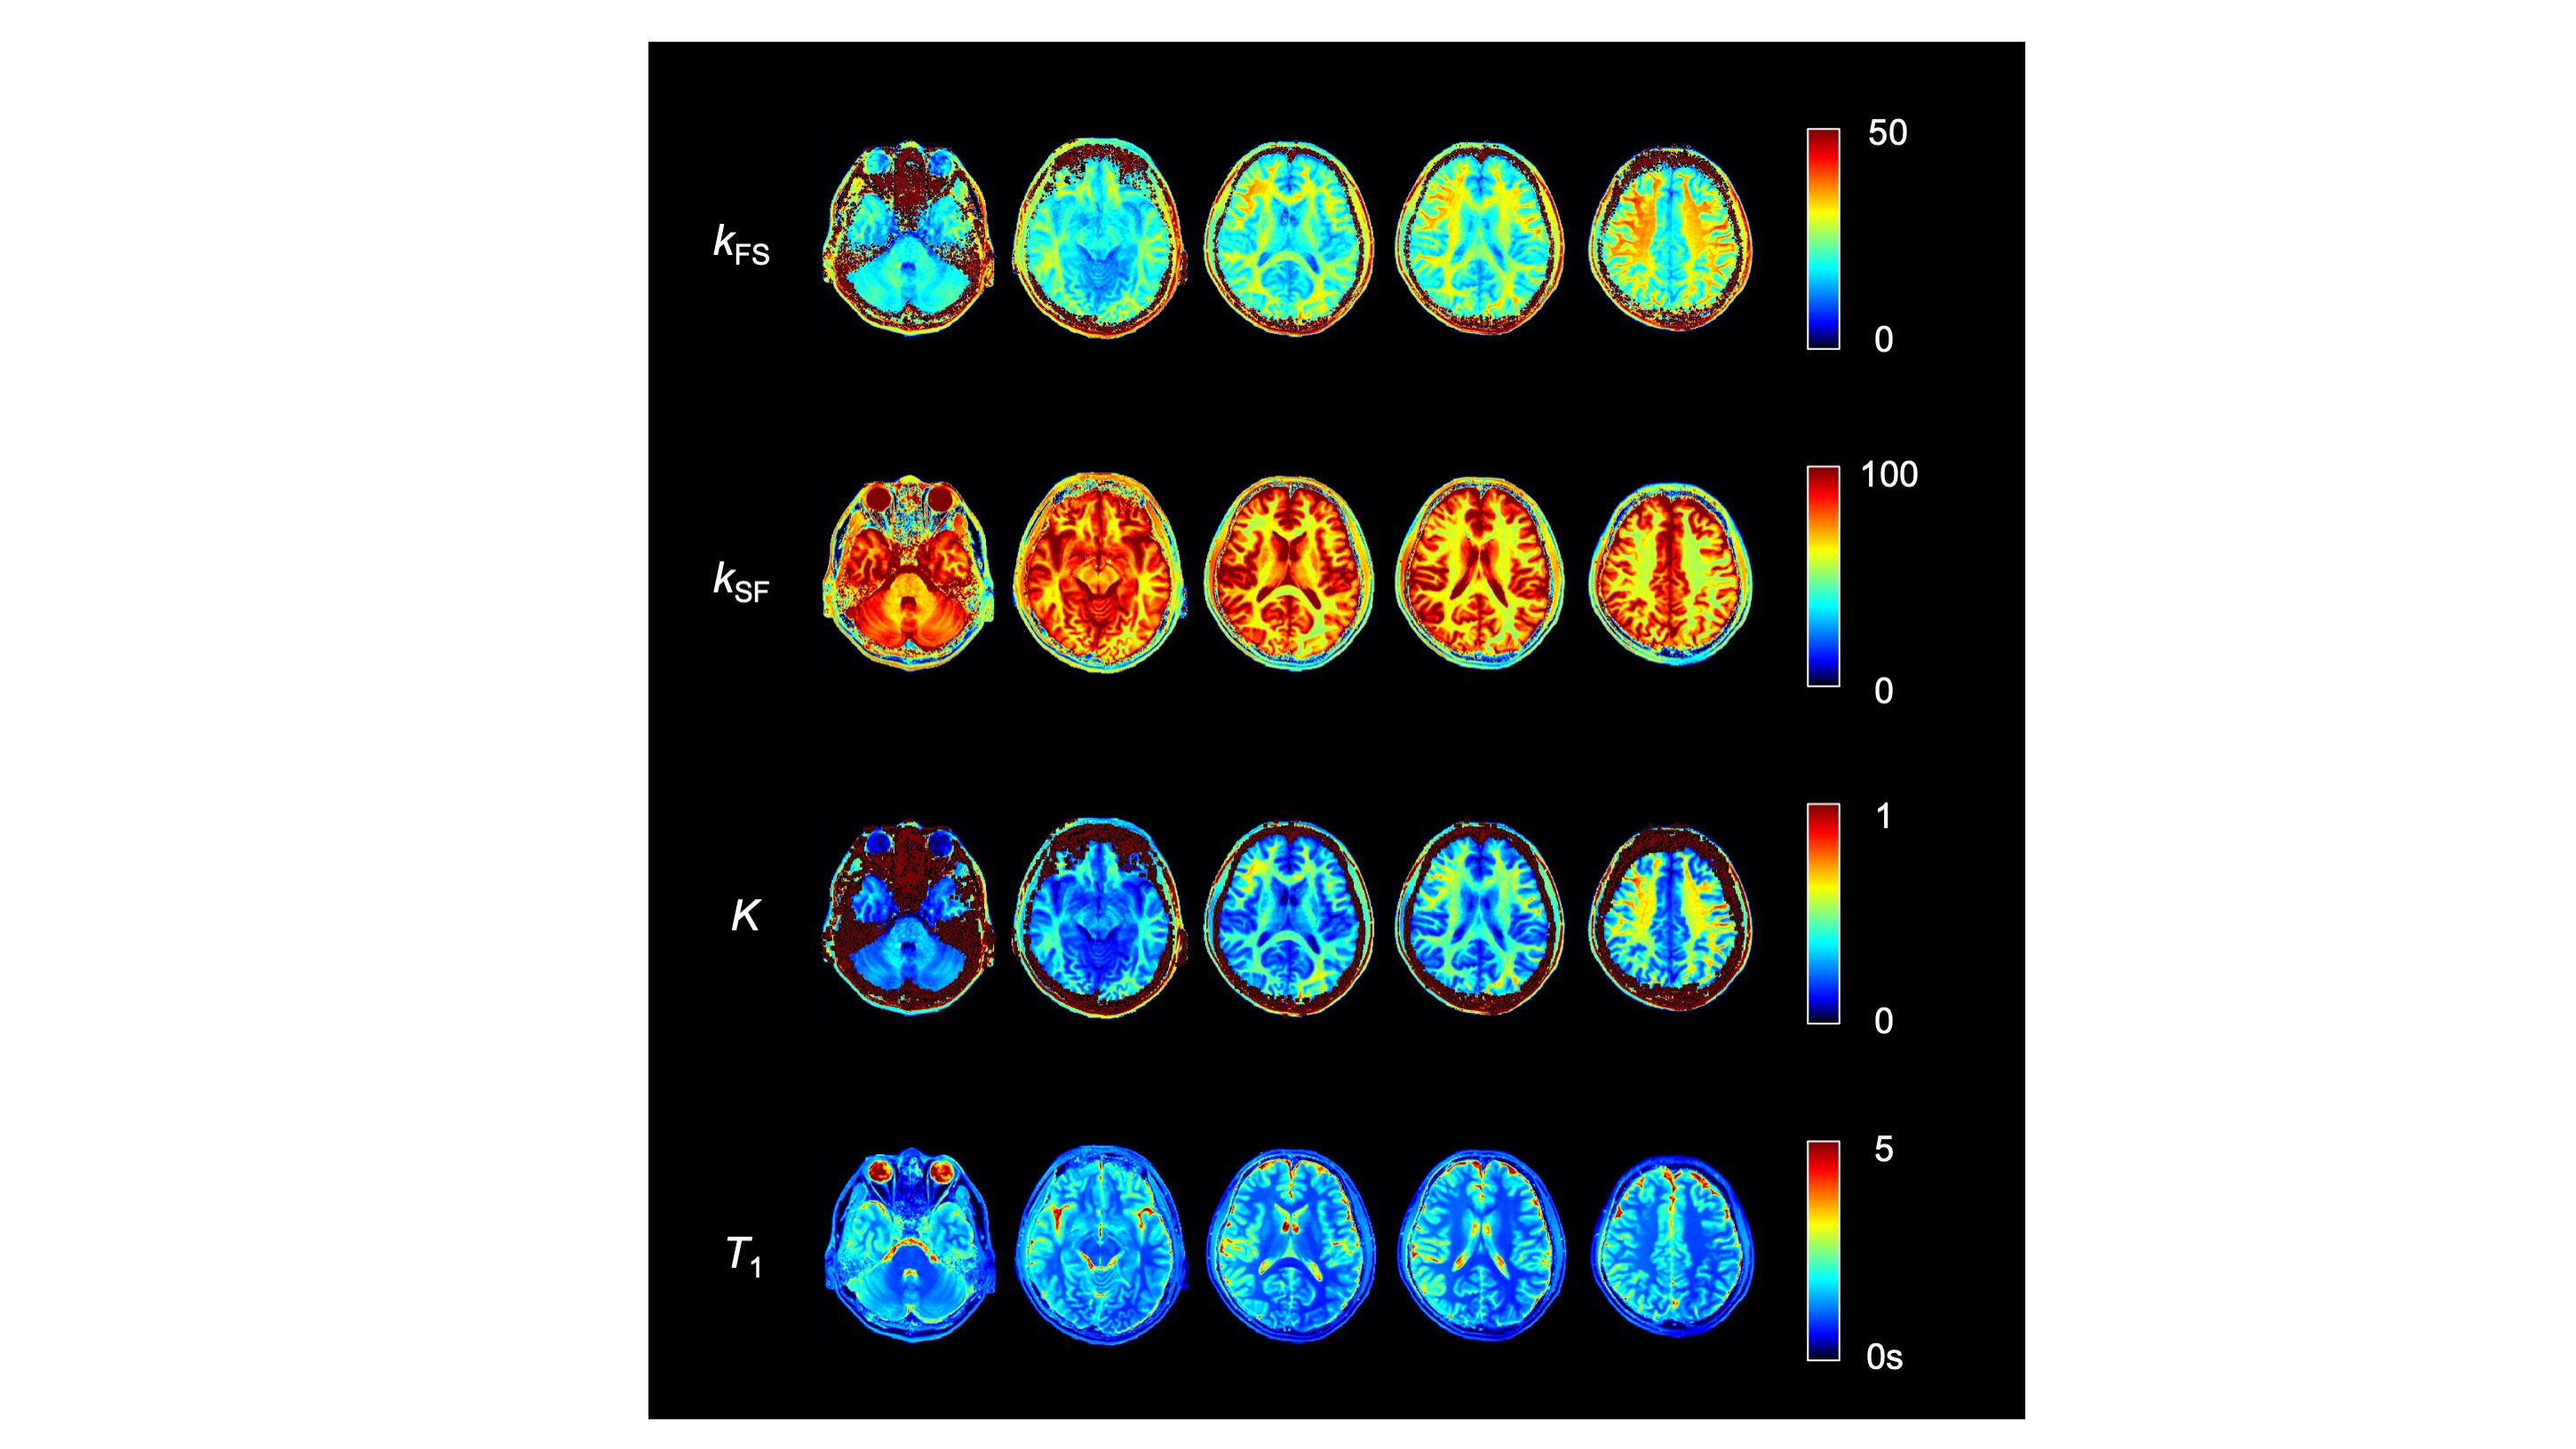
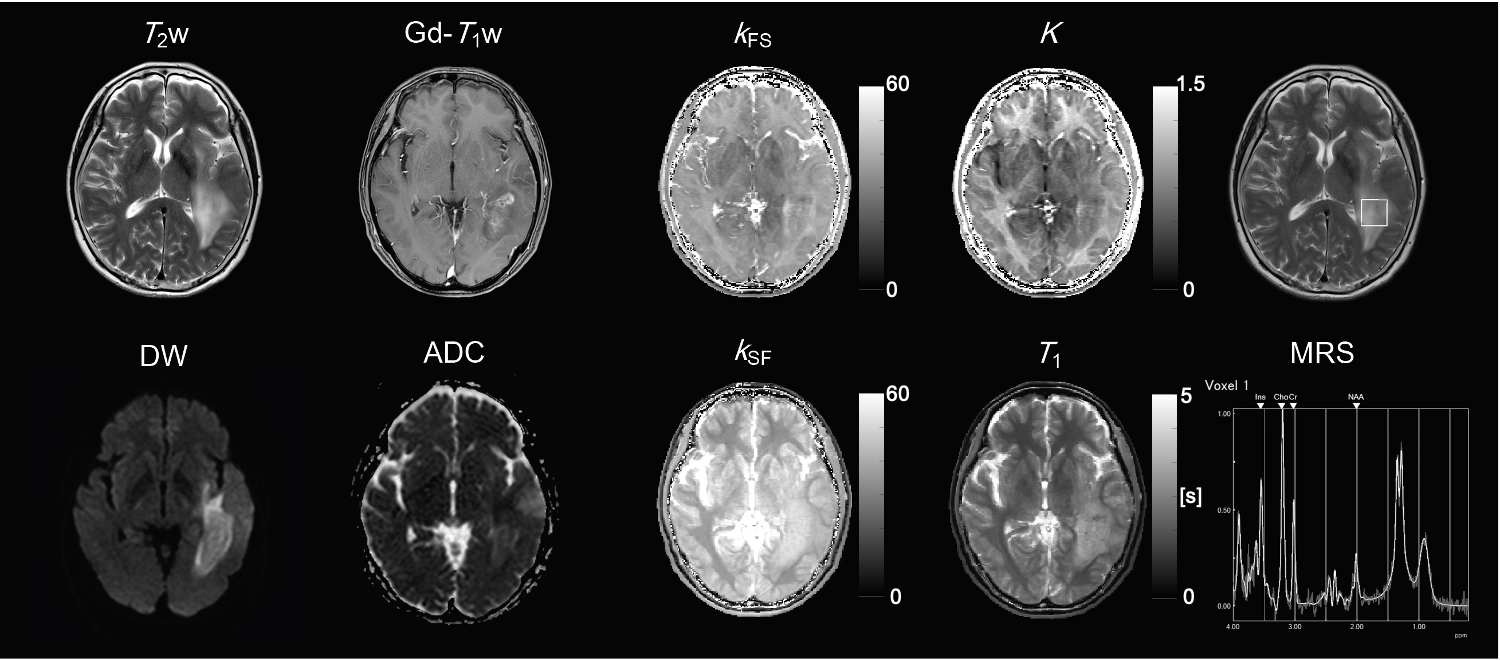
The measured values for each parameter in each region of the ten healthy volunteers are shown in Fig. 2. Figure 3 shows the relationship between the kFS and kSF water exchange rates. The linear regression analysis of the kFS and kSF showed a significant negative correlation (Fig. 3; R = -0.75, P < 0.001). Figure 4 shows maps of a healthy volunteer. A clinical case shows the results of this technique for the patient with a brain tumor as shown in Fig. 5. WM has a higher ratio of high-molecular-weight protons than GM; WM structures contain axons and myelin. Water exchange rates may indicate proton diffusion between structures, depending on the macromolecular proton ratio.Conclusion
The developed method was able to estimate the water exchange rates between tissues using QPM, which compensated for the parameters related to relaxation time. With a focus on the water proton exchange between structures as assumed cross-relaxation, we can obtain more detailed information for each structure of the brain.Acknowledgements
This study was partly supported by JSPS KAKENHI [grant number 20K07997].References
1. Edzes HT, Samulski ET. Cross relaxation and spin diffusion in the proton NMR or hydrated collagen. Nature 1977;265(5594):521-3.
2. Deoni SC, Rutt BK, Arun T, Pierpaoli C, Jones DK. Gleaning multicomponent T1 and T2 information from steady-state imaging data. Magn Reson Med. 2008;60(6):1372-1387.
3. Deoni SC, Matthews L, Kolind SH. One component? Two components? Three? The effect of including a nonexchanging "free" water component in multicomponent driven equilibrium single pulse observation of T1 and T2. Magn Reson Med. 2013;70(1):147-154.
4. Taniguchi Y, Yokosawa S, Shiraii T, Sato R, Amemiya T, Ochi H, and Soutome Y. Fast 3D Multi-Parameter Mapping of Relaxation Times and Susceptibility Using Partially RF-Spoiled Gradient Echo at 3T. Proc. ISMRM 2018;26:5630.
5. Kanazawa Y, Harada M, Taniguchi Y, Hayashi H, Abe T, Ohtomo M, Matsumoto Y, Ono M, Bito Y and Haga A: Myelin imaging derived from quantitative parameter mapping, Proc. ISMRM 2019;27:3313.
6. Matsumoto Y, Harada M, Kanazawa Y, Abe T, Ohtomo M, Taniguchi Y, Ono M and Bito Y: Calculation of Concentration of Contrast Media, Relaxivity, Extracellular pH and Oxygen Extraction Fraction for Brain Tumor Characterization, Proc. ISMRM 2020;28:4983.
Figures