3068
Aging-Related Spatial Changes in the Microstructure of the Human Striatum Detected Through Quantitative MRI in vivo1The Edmond and Lily Safra Center for Brain Sciences, The Hebrew University of Jerusalem, Jerusalem, Israel
Synopsis
The striatum is a heterogeneous brain structure with microstructural gradients along its main axes. Changes in its organization are associated with normal aging and disease. Yet the spatial variability in the human striatum is not well characterized and is mostly limited to postmortem studies. We propose a robust non-invasive method for detection and quantification of microstructural gradients along axes of the striatum in individuals in vivo, using qMRI. We show distinct profiles of spatial and aging-related changes in the striatum, associated with different biophysical sources such as tissue density and iron content, estimated in vivo.
Introduction
The dorsal striatum, composed of the caudate nucleus and the putamen, is involved in motor control and goal-directed behavior1. It is characterized by spatial heterogeneity in neurochemical environments and connectivity, showing gradients along its main axes2,3. Changes in the striatal microstructure are associated with basal ganglia disease (e.g. Parkinson’s disease) and aging-related declines in motor and cognition4,5. Therefore, non-invasive quantification of the gradual changes that characterize the human striatal tissue has scientific and clinical importance. Quantitative MRI (qMRI) methods are sensitive to the micro-environment of the tissue, allowing for “in vivo histology” of the human brain6. We have recently developed a non-invasive tool for quantifying structural heterogeneity along axes of the human striatum of individuals, using qMRI7. Here, we use this method to detect spatially dependent and aging-related microstructural changes, and give evidence for the robustness of our method across datasets. Furthermore, we explore different biophysical sources of the spatial and aging-related variation, demonstrating different effects of iron content and tissue density, in vivo.Methods
MRI acquisition – 3T MRI scans were performed on 20 young adults (aged 27 ± 2 years, 10 females) and 18 older adults (aged 67 ± 6 years, 5 females)8. Data for quantitative R1, R2* and the macromolecular tissue volume (MTV) mapping were acquired using siemens FLASH sequence, with SEIR data for B1+ bias correction9. R1 and MTV maps were computed using mrQ9 and R2* fitting was done using MPM10.Dataset for replication – We analyzed 3T quantitative R1 data of 20 young adults and 18 older adults, matched in age and sex to our own data. This data was collected in Stanford University11,12.
Spatial change analysis – We have developed a tool for quantification of microstructural variations along the main axes of subcortical structures, using qMRI. For each individual structure, we compute the main orthogonal axes using SVD on the 3D coordinates and measure the median qMRI parameter in segments along each axis.
Statistical analysis – We used linear mixed-effect models (MATLAB’s fitlme) for each structure and axis. We modelled subjects’ ID as a random effect and included sex as a covariate. Main and interaction effects were modelled for age group, hemisphere, and position along the axis. We used FDR to control for multiple comparisons, with alpha set to 0.05.
Results
We found R1 gradients along axes of the putamen and caudate that were robust across subjects and two independent datasets (Fig. 1,2). These gradients showed laterality and aging-related changes that were replicated in both datasets. Linear mixed-design models (covaried for sex) showed spatial effects along the anterior-posterior (AP), ventral-dorsal (VD) and medial-lateral (ML) axes of the putamen, and along the AP and ML axes of the caudate. In addition, in the caudate it showed a three-way interaction effect of age group, hemisphere, and position along the AP axis (pFDR corrected < 0.001), thus showing an aging-related increase in the interhemispheric microstructural asymmetry of the caudate (Fig. 1). To investigate the biophysical sources of spatial changes in the aging striatum, we examined the spatial variability of several qMRI parameters, associated with myelin and lipid content (R1), the non-water content of the tissue (MTV) and the iron concentration (R2*). We found distinct profiles of spatial change in the striatum for each of these parameters, as well as distinct associated aging-related changes (Fig. 3). In order to compare the different profiles of change, we normalized the R1, MTV and R2* gradients to their corresponding white-matter median values and used each of them as the response variable in mixed effect models. In many cases, changes in R1 were accompanied by similar effects in MTV (Fig 4), suggesting that much of the observed variability revealed by R1 is associated with tissue density. However, along the AP axes of the caudate and putamen, R1 showed some hemispheric effects that were not revealed by MTV, implying additional sensitivities of R1. In contrast, R2* generally demonstrated a different pattern. Although R2* and R1 showed some overlaps, R2* mostly showed main effects of age group, in addition to other spatial effects that were not always similar to those observed in R1 or MTV (Fig 5).Conclusions
Our findings suggest that different parameters of qMRI reveal distinct biological sources involved in the spatial heterogeneity of the striatal tissue in vivo. Moreover, aging-related changes involving these sources manifest differently in the striatum. While R1 changes are mostly associated with variation in tissue density, as uncovered by MTV, it reflects additional sources of variation, mainly along the AP axes of the caudate and putamen. In contrast, changes in iron concentration, estimated by R2*, show different patterns of spatial and aging-related changes. This may suggest that changes in water content and iron accumulation constitute distinct aging mechanisms. Further work will use postmortem validation of this in vivo biophysical analysis to strengthen our findings. In addition to its application to the study of normal aging, our method may prove useful for quantification of abnormal changes in basal ganglia disease such as Parkinson’s diseaseAcknowledgements
No acknowledgement found.References
- Kravitz, A. V. & Kreitzer, A. C. Striatal mechanisms underlying movement, reinforcement, and punishment. Physiology vol. 27 167–177 (2012).
- Graybiel, A. M. & Ragsdale, C. W. Histochemically distinct compartments in the striatum of human, monkeys, and cat demonstrated by acetylthiocholinesterase staining. Proc. Natl. Acad. Sci. 75, 5723–5726 (1978).
- Haber, S. N. Corticostriatal circuitry. Dialogues Clin. Neurosci. 18, 7–21 (2016).
- Crittenden, J. R. & Graybiel, A. M. Basal ganglia disorders associated with imbalances in the striatal striosome and matrix compartments. Frontiers in Neuroanatomy vol. 5 59 (2011).
- Umegaki, H., Roth, G. S. & Ingram, D. K. Aging of the striatum: Mechanisms and interventions. Age vol. 30 251–261 (2008).
- Weiskopf, N., Mohammadi, S., Lutti, A. & Callaghan, M. F. Advances in MRI-based computational neuroanatomy: From morphometry to in-vivo histology. Current Opinion in Neurology vol. 28 313–322 (2015).
- Drori, E., Filo, S. & Mezer, A. Measuring Biological Gradients along the Human Dorsal Striatum in vivo using Quantitative MRI. in ISMRM Annual Meeting (2020).
- Filo, S. et al. Disentangling molecular alterations from water-content changes in the aging human brain using quantitative MRI. Nat. Commun. 10, (2019).
- Mezer, A. et al. Quantifying the local tissue volume and composition in individual brains with magnetic resonance imaging. Nat. Med. 19, 1667–1672 (2013).
- Weiskopf, N. et al. Quantitative multi-parameter mapping of R1, PD*, MT, and R2* at 3T: a multi-center validation. Front. Neurosci. 7, (2013).
- Yeatman, J., Wandell, B. & Mezer, A. Lifespan maturation and degeneration of human brain white matter. Nat. Commun. 5, (2014).
- Sacchet, M. & Gotlib, I. Myelination of the brain in major depressive disorder: an in vivo quantitative magnetic resonance imaging study. Sci. Rep. 7, (2017).
Figures
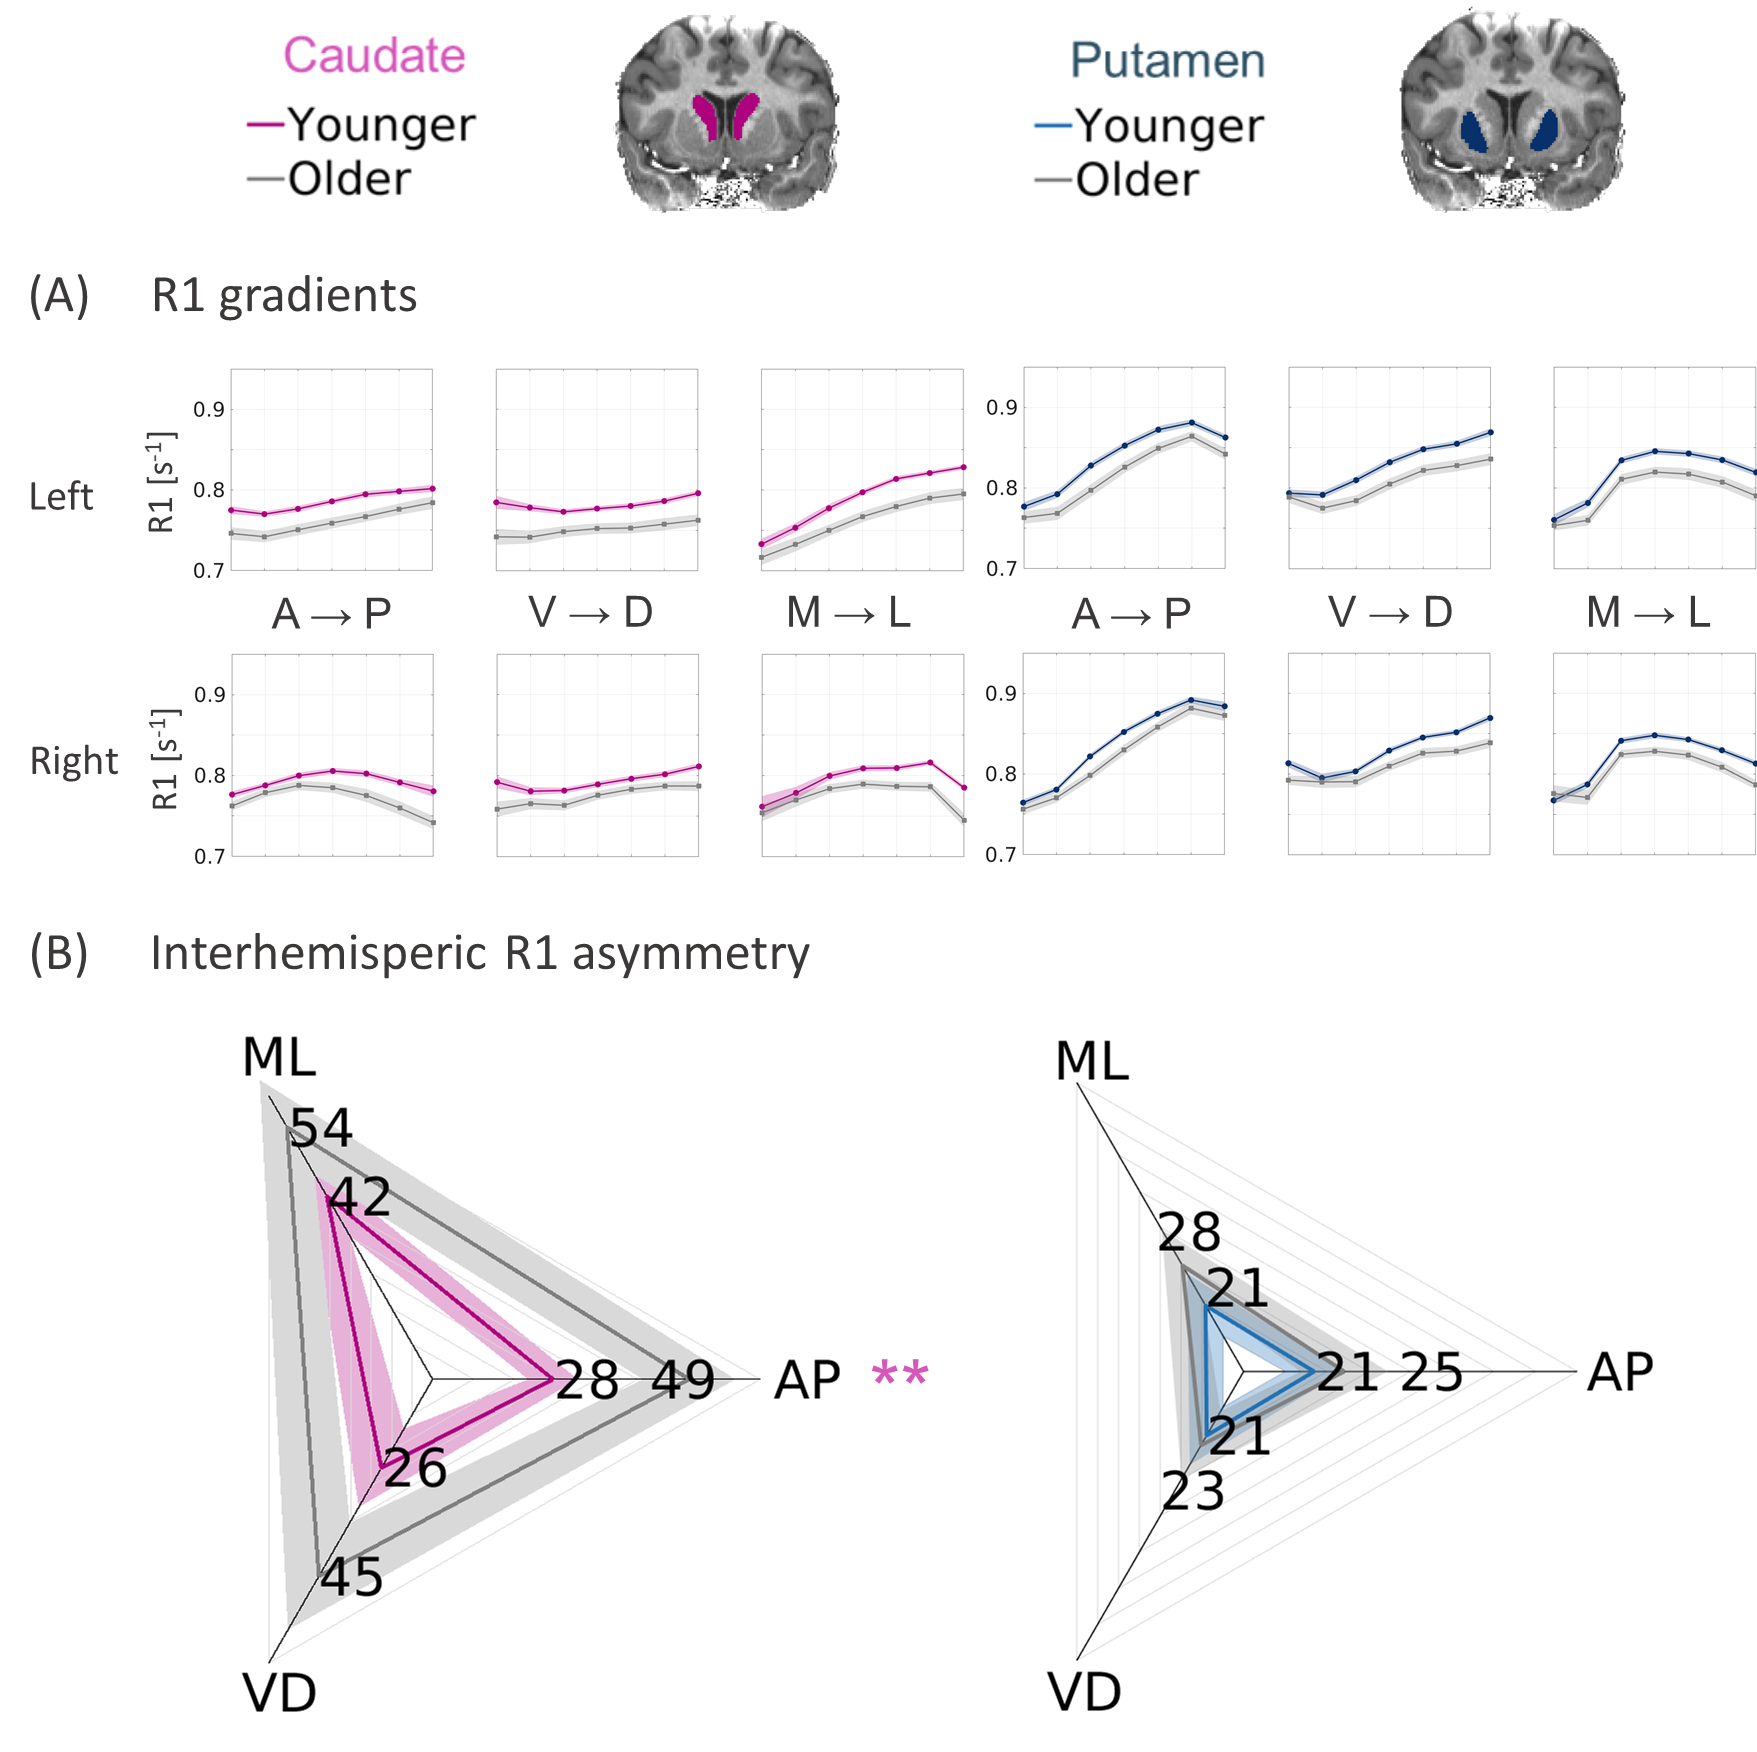
Microstructural gradients in the striatum show aging-related changes.
(A) R1 functions along the main axes of the caudate (left) and putamen (right), averaged across 20 young adults and 18 older adults. Shaded area = ±1 SEM.
(B) Interhemispheric asymmetry is shown for 3 axes of the caudate and putamen, averaged across young and older adults. Asymmetry is defined as within-subject mean difference (MAE) between the left-hemisphere and right-hemisphere 1/R1 functions [ms]. Shaded area = ±1 STD.
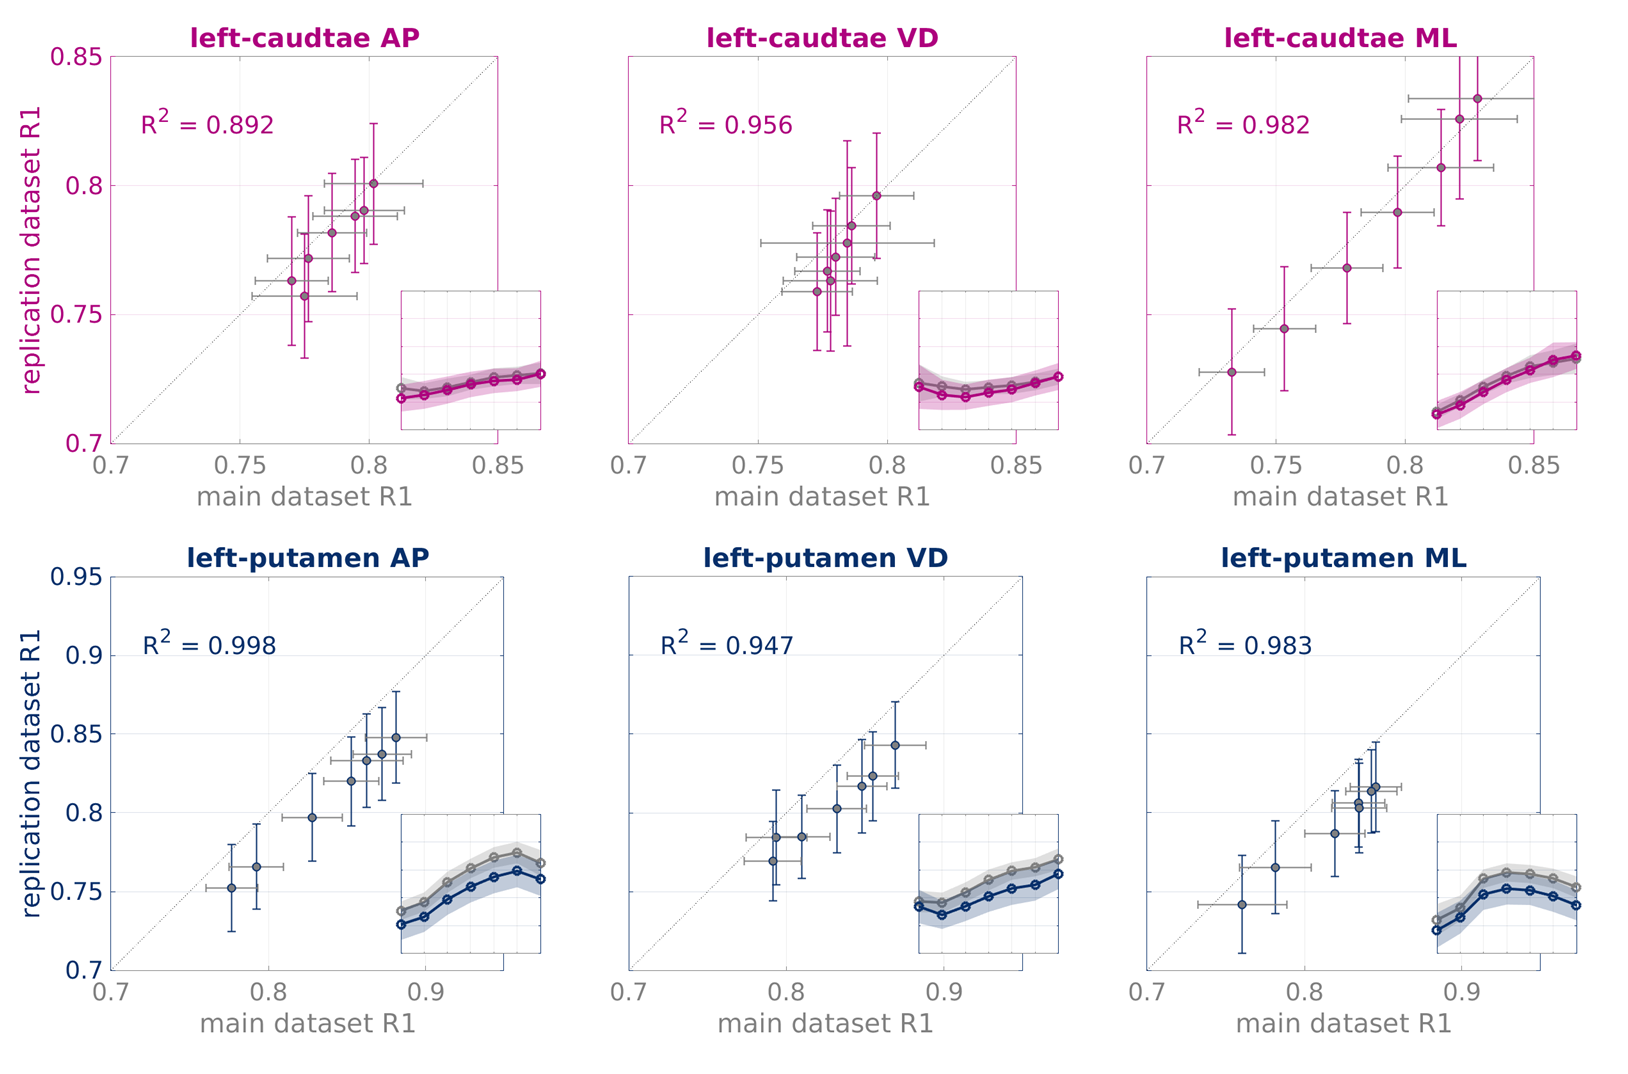
R1 gradients are robust across datasets.
We replicated our analysis on an independent dataset matched for age and sex, acquired in Stanford. Shown here are the linear correlations between the R1 gradients in our main dataset (x-axes, grey) and the replication dataset (y-axes, color), for the left caudate (top) and left putamen (bottom) in young adults. Adjusted Pearson R2 are shown, error bars = ±1 STD. Insets show the R1 functions. Shaded area = ±1 STD.
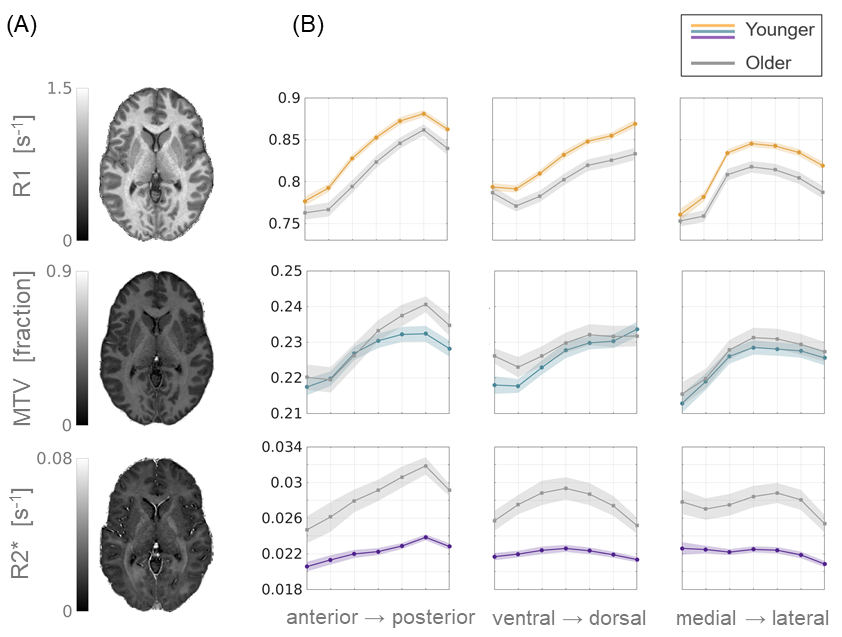
Different qMRI parameters show distinct spatial and aging-related changes.
(A) Representative axial slices of R1, MTV and R2* mappings, showing sensitivity to myelin, non-water content and iron concentration, respectively. (B) Spatial variability profiles of the different qMRI parameters along the anterior-posterior (left), ventral-dorsal (middle) and medial-lateral (right) axes of the putamen. Averaged across young (N=17) and older adults (N=16). Shaded area is ± 1 SEM.
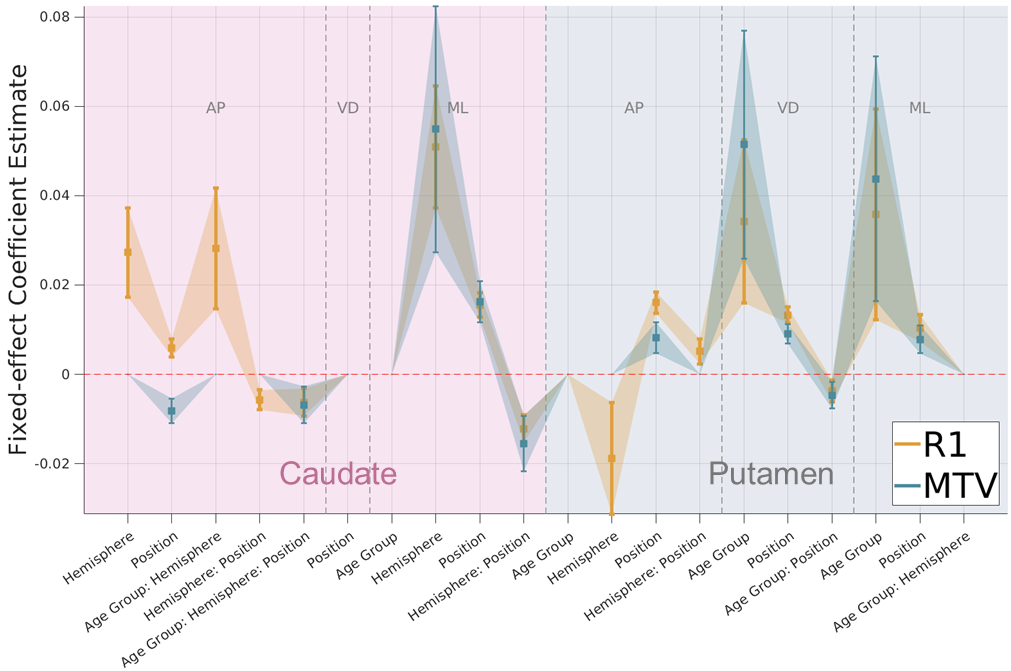
R1 effects mostly covary with effects of tissue density.
Signatures of effect estimates for normalized R1 and MTV along 3 axes of the caudate and putamen. error bars = 95% confidence interval. All main and intercation effects of age, hemisphere and position were tested, but only significant effects are shown (pFDR < .05) for visualization purpose. In many cases R1 and MTV show similar signatures, excluding most effects in the AP axes of the striatum. AP: anterior-posterior, VD: ventral-dorsal, ML: medial-lateral.
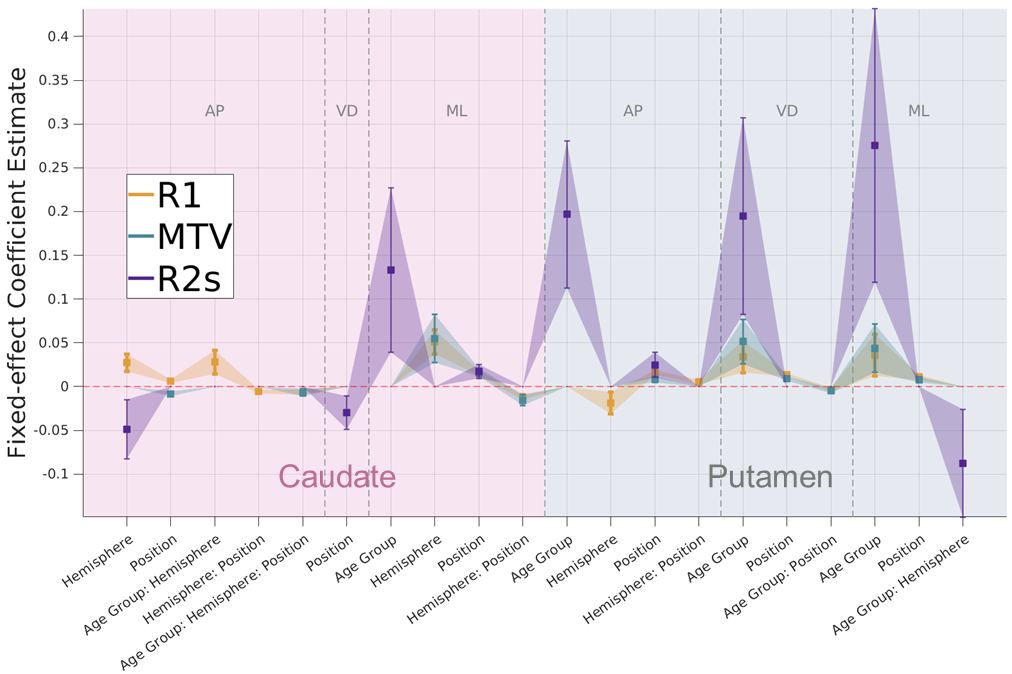
R2* changes differ from R1 and MTV.
R2* effects estimates (purple) show a qualitatively distinct signature from those of R1 and MTV (see also Fig 4). R2* mostly reveals main effects of age group along 3 axes of the putamen and in the ML axis of caudate, in addition to spatial effects which only in part overlap with the R1 and MTV signatures. All interaction effects were tested, but insignificant effects (pFDR >=.05) are set to 0 or excluded for visualization purpose. AP: anterior-posterior, VD: ventral-dorsal, ML: medial-lateral.