3067
Asymmetries in the distribution of quantitative MRI parameters in the brain1INM-4, Research Centre Juelich, Juelich, Germany, 2INM-1, Research Centre Juelich, Juelich, Germany, 3Faculty of Medicine, JARA, RWTH Aachen University, Aachen, Germany, 4INM-11, JARA, Research Centre Juelich, Juelich, Germany, 5Department of Neurology, RWTH Aachen University, Aachen, Germany
Synopsis
Multicontrast quantitative MRI is used to characterize left-right and sulcal-gyral asymmetries of the brain in 26 volunteers. Several regions with significant asymmetries are found in different parameters (H2O, fbound, R2*, R1, kex, QSM). Good correlation between sulcal-gyral H2O-defined asymmetry and local gyrification index is found.
Introduction
The left and the right halves of the brain strikingly resemble each other; nevertheless, hemispheric functional and structural asymmetries exist. It has been proposed that they reflect evolutionary, hereditary, developmental, experiential, and pathological factors [1] but their exact origin is not understood. Another striking feature of the human brain is its highly gyrified cortex, associated with mammalian brain evolution, such that 60% of the cortical mantle is buried within the sulci [2]. The gyral crowns and the sulcal fundi are known to differ morphologically, and the hypothesis has been proposed that sulcal fundi play a distinctive role in higher cognitive processing [3]. At the macrostructural level, brain asymmetry features can be investigated with in vivo imaging, but the study of microstructural features at the cell distribution level requires postmortem histological sectioning. Quantitative MRI offers a way of exploring tissue microstructure in vivo, even though the measured parameters reflect microscopic properties in a convoluted way. Water content measured by MRI is one notable exception, directly providing a physiologically relevant parameter. Here, we investigate in this contribution left-right and gyral-sulcal asymmetries of the brain reflected in multiparametric quantitative MRI on 26 healthy volunteers selected from the population-based cohort 1000BRAINS [4,5].Materials and methods
Twenty-six healthy volunteers between 27 and 80 years of age (mean age 53±16 years, male/female 19/7) were drawn from the 1000BRAINS population-based cohort study [4], conducted on a 3T Tim-Trio scanner. All subjects gave prior, written informed consent in accordance with institutional guidelines. Exclusion criteria were pathological structure changes visible on MPRAGE or FLAIR (except age-related changes), known medication intake, a reported history of diseases affecting the central nervous system, hypertension and diabetes. The acquisition used for the mapping method has been reported in [6,7] on different sub-collectives selected from the 1000BRAINS cohort. Briefly, it is based on four 3D multiple-echo (18 echoes) gradient echo scans, TR=50ms, flip angles of 7deg and 40deg (acquired with as well as without MT), complemented by flip angle mapping using AFI [8]. Whole-brain coverage with 1x1x2mm3 resolution is achieved in less than 20 minutes. A two-point qMRI evaluation was used for each pair of 7 and 40deg scans to map T1, T2* and M0 [9], the latter converted to percent H2O per voxel volume. The MT-prepared scans are used for similar parameter mapping, reflecting M0, T1 and T2* changes due to magnetization transfer effects. From the combined quantities, qMT parameters bound proton fraction (fbound), magnetization exchange rate (kex), and M0 reduction caused by the MT pulse (MTR), can be derived [10]. In addition, phase information was used to map the tissue-specific phase (local field) and perform quantitative susceptibility mapping (QSM). Eight quantitative parameters are thus obtained, reflecting different tissue properties. The MPRAGE anatomical scan included in the 1000Brains imaging protocol [4] was used for brain parcellation according to the Destrieux atlas using Freesurfer [11]. The information was transferred to the space of the quantitative maps using ANTs registration. Regions containing the sulcal fundus or gyral crown were defined based on their curvature (threshold at xxx). Mean values of the quantitative parameters were calculated for each ROI, and within each ROI for the gyri and sulci separately. For each ROI and quantitative parameter, a left-right asymmetry index (2(L-R)/(L+R) and a gyral-sulcal asymmetry index 2(G-S)/(G+S) were calculated using the quantitative values at depth 0.5 cortical thickness. Freesurfer-calculated cortical thickness (CT) and local gyrification index (LGI) were included in the analysis. The statistical analysis was done in Python (statsmodels and Pingouin packages). Outlier exclusion was performed using a density-based clustering approach (DBSCAN) as implemented in scikit-learn. To correct for multiple hypothesis testing, the Benjamini-Hochberg procedure with an error rate Alpha = 0.05 was applied on all p-values across subjects and ROIs. Correlations between the gyral-sulcal asymmetry indices of the quantitative parameters and the local gyrification factor were investigated using age as a covariate.Results
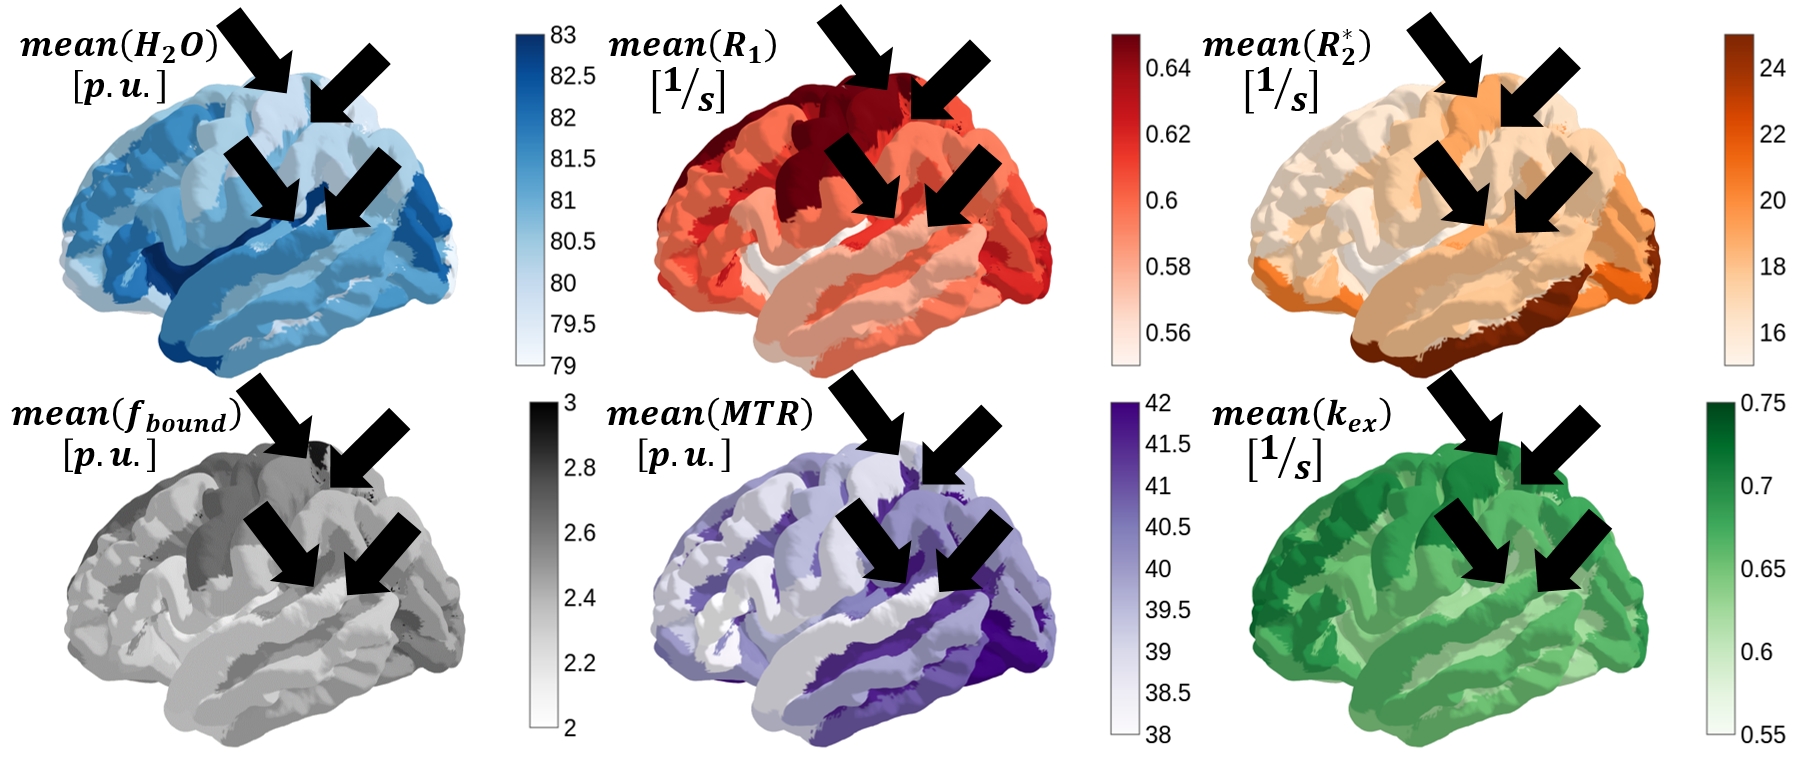
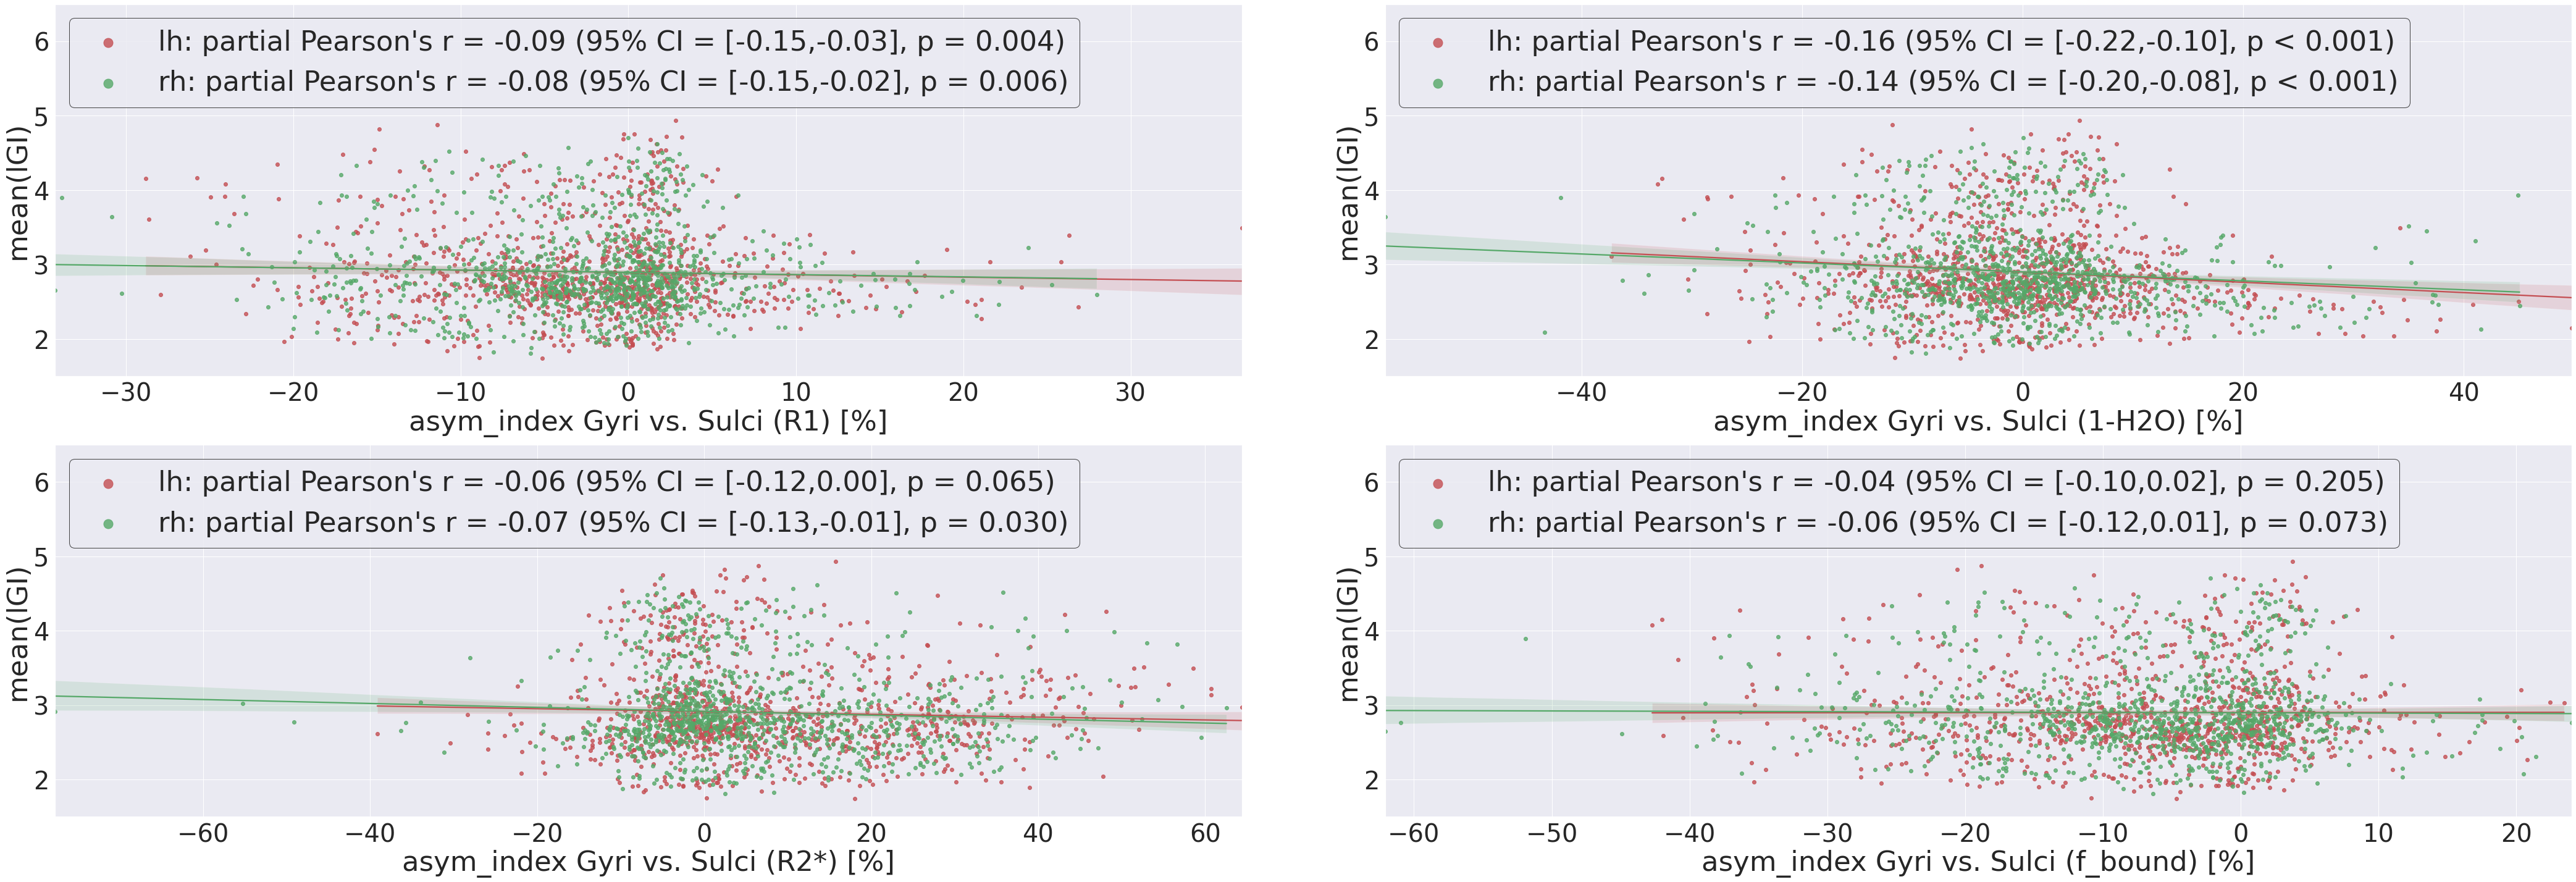
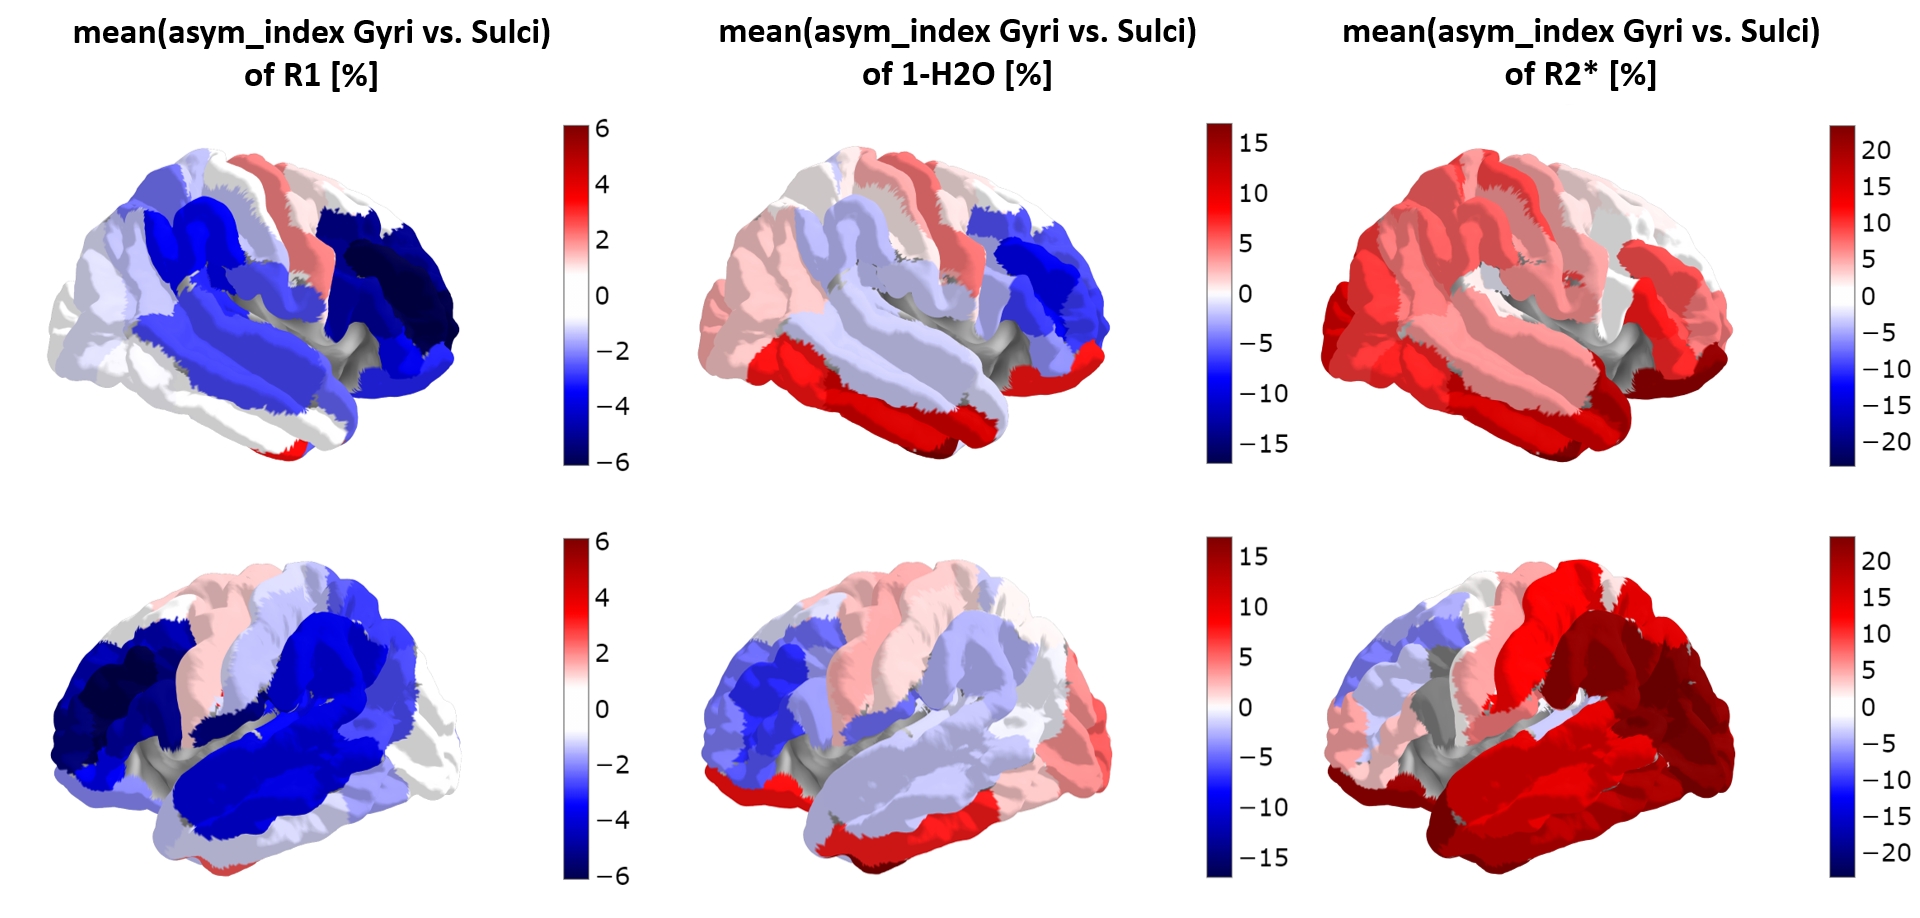
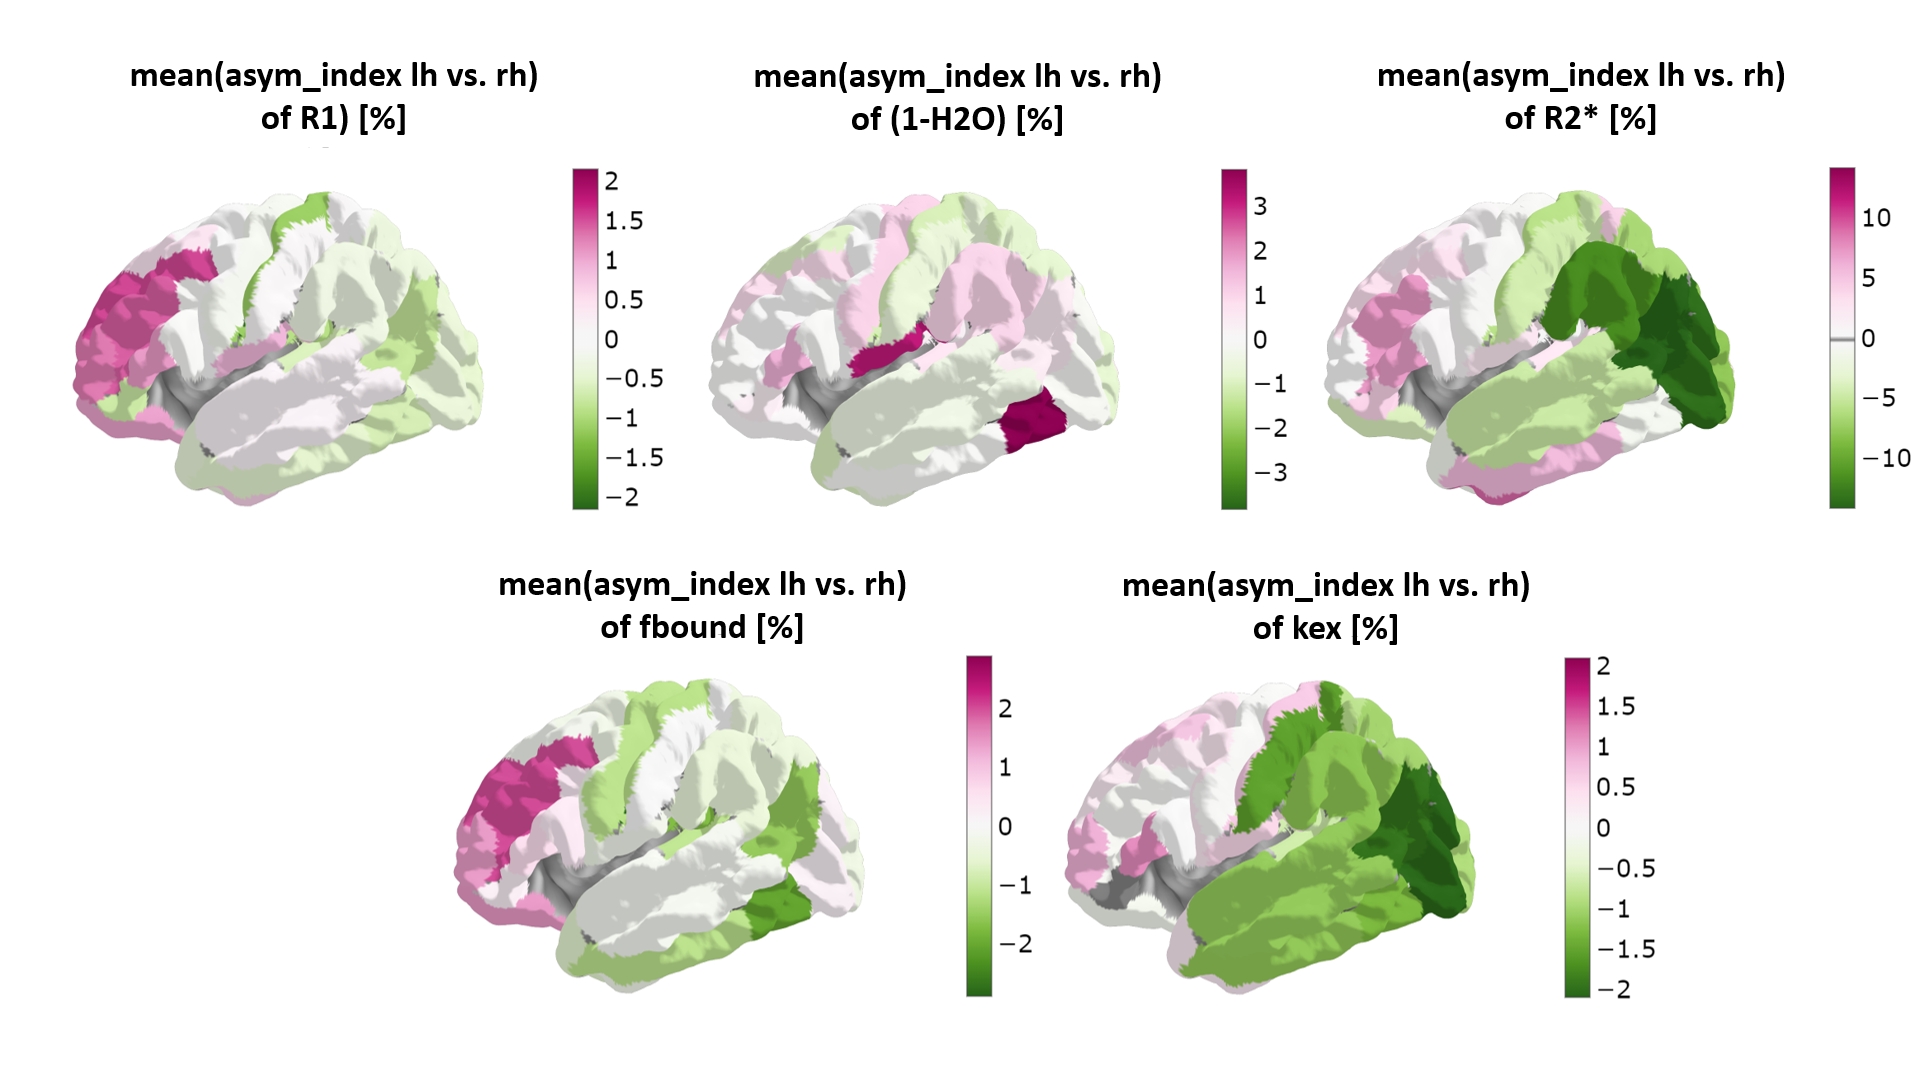
Fig. 1 shows the cortical distribution of selected quantitative parameters for the left hemisphere. Fig. 2 shows the correlation between the sulcal-gyral asymmetry index of water content and the mean local gyrification index for all ROIs and volunteers. Fig. 3 shows the cortical distribution of the left-right asymmetry index (one hemisphere) and the gyral-sulcal asymmetry index (both hemispheres).Discussion and Conclusions
Significant differences in cortical thickness between gyri and sulci were observed in several regions, as well as left-right differences in the local gyrification index, confirming previous observations [2,5]. The new element introduced here is defining asymmetries in quantitative parameters with relevance to cell density, myelination, iron content and distribution (Figs 2 and 3). All qMRI parameters investigated show a distinct cortical distribution (Fig. 1) and a number of regions show significant asymmetries in these parameters. Interestingly, water content differences between gyri and sulci show the strongest correlation with the local gyrification index, possibly reflecting known sulcal-gyral differences in neuronal density [2]. Significant correlations are found also for R1, R2* and fbound. In conclusion, multiparametric qMRI offers an intriguing possibility to study brain asymmetries related to microstructural properties in vivo.Acknowledgements
AMO-P and NJS acknowledge support by the European Union’s Horizon 2020 research and innovation programme under the Marie Sklodowska-Curie grant agreement No 764513. Support from Dr. Elene Iordanishvili and Dr Melissa Schall in the early stages of this work is gratefully acknowledged.References
[1] Lyttelton 2009, Neuroimage, 46, 895–903 and refs within
[2] H. J. Markowitsch and E. Tulving 1995, NeuroReport 6, 413-418 and refs within.
[3] Zilles K, Armstrong E, Schleicher A, Kretschmann HJ (1988) Anat Embryol 179(2):173–179
[4] Caspers S, Moebus S, Lux S, Pundt N, Schutz H, Muhleisen TW, Amunts K (2014) Studying variability in human brain aging in a population-based German cohort-rationale and design of 1000BRAINS. Front Aging Neurosci 6:149 [
5] Jockwitz, C., Caspers, S., Lux, S. et al. Age- and function-related regional changes in cortical folding of the default mode network in older adults. Brain Struct Funct 222, 83–99 (2017).
[6] Schall, Melissa et al. 2020 Increasing body mass index in an elderly cohort: Effects on the quantitative MR parameters of the brain. J. Magn. Reson. Imaging 51:514–523.
[7] Iordanishvili E, Schall M, Loução R, Zimmermann M, Kotetishvili K, Shah NJ, Oros-Peusquens AM. Quantitative MRI of cerebral white matter hyperintensities: A new approach towards understanding the underlying pathology. Neuroimage. 2019 Nov 15;202:116077.
[8] V. Yarnykh Magn Reson Med. 2007 Jan;57(1):192-200.
[9] Schall, Melissa et al. 2018 “A 3D two-point method for whole-brain water content and relaxation time mapping: Comparison with gold standard methods.” PloS one vol. 13,8 e0201013.
[10] P. Tofts, Ed., Quantitative MRI of the brain: measuring changes caused by disease. Chichester, West Sussex ; Hoboken, NJ: Wiley, 2003.
[11] http://surfer.nmr.mgh.harvard.edu/, Freesurfer version 6.0.0
Figures