3066
FAST T1 MAPPING: ACCURACY AND REPRODUCIBILITY OF VOLUMETRIC SEQUENCES FOR BRAIN RELAXOMETRY1CIMeC, University of Trento, Trento, Italy, 2Department of Radiology, G.B. Rossi Hospital, University of Verona, Verona, Italy
Synopsis
The gold standard T1 mapping method is the Inversion Recovery (IR). Volumetric sequences such as MP2RAGE without or with compressed sensing (csMP2RAGE) allow faster T1-mapping, but potential biases are not well characterized. Here we investigated T1-mapping and test-retest reproducibility effects of sequence (IR, MP2RAGE, csMP2RAGE) and head RF coil (64 and 20-channel), both in-vitro and in-vivo. The 64-channel coil results are more accurate and reliable, showing good agreement with the gold standard and a beneficial reduction of scan time.
Introduction
Reproducible quantitative T1 mapping of the brain has several applications, both in research and clinical environments 1,2. Inversion Recovery3, is the current gold-standard T1-mapping method. Although very robust, this method is time-consuming, as it needs to allow full longitudinal relaxation between subsequent scans. Alternative sequences for fast T1-mapping include MP2RAGE4 and a recently proposed compressed sensing accelerated version of it (csMP2RAGE)5. Here we extend previous studies to evaluate how T1-mapping accuracy and test-retest reproducibility are affected by MRI sequence (IR, MP2RAGE, csMP2RAGE) and head RF receive coil (20ch and 64-channel) in a phantom and healthy human volunteer using a clinical 3T MRI system.Materials and Methods
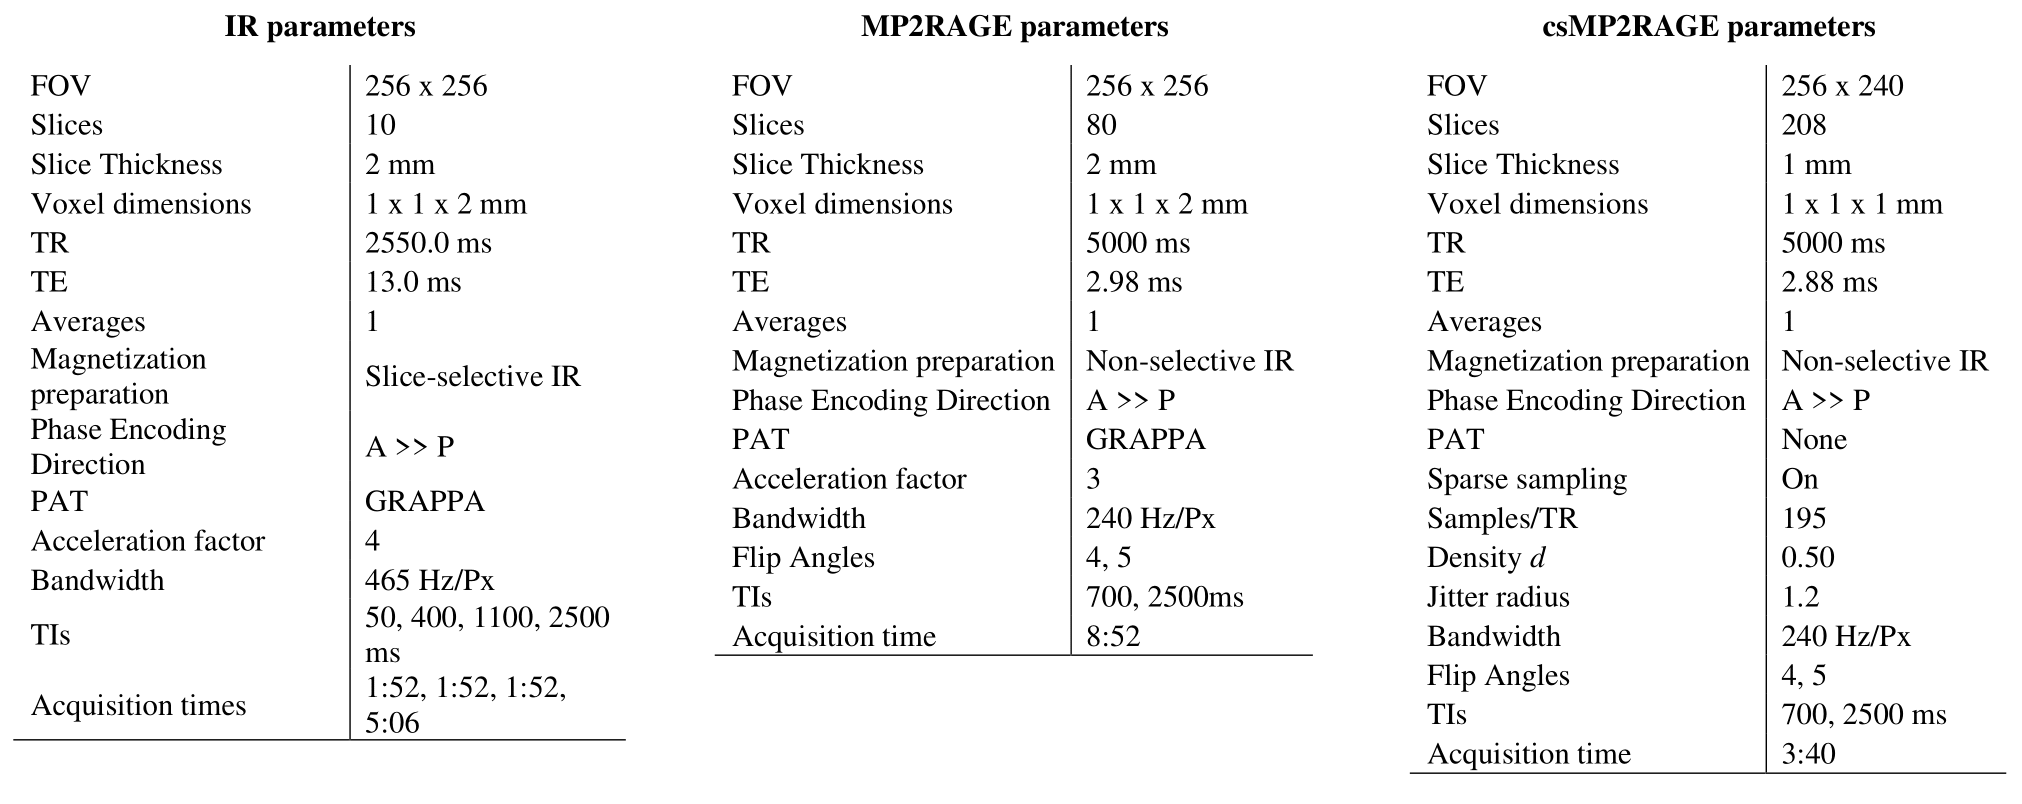
Acquisition: MRI were acquired on n=2 healthy male volunteers (mean age 44±9 years) and a phantom using a 3T clinical scanner (MAGNETOM Prisma, Siemens Healthcare, Erlangen, Germany) equipped with a 20- and 64-channel head/neck receive coils. The sequences used were Inversion Recovery (IR) 1, MP2RAGE 2 and csMP2RAGE 3 (sequence parameters in Table 1). The same protocol was repeated twice in a test-retest fashion to evaluate reproducibility over time.Phantom: A custom phantom was made containing vials surrounded by demineralized water and filled with 5 different concentrations of Gadobutrol (Gadovist, 1M, Bayer AG).
Analyses: The processing pipeline involved a step to remove background noise from MP2RAGE images 6. For IR only, the volumes were then processed through qMRLab7 to obtain T1 maps both for in-vitro and in-vivo datasets. FSL 8 was then used for spatial normalization in standard MNI space of the in-vivo data only. Phantom images were manually segmented and evaluated by ROI analysis. Region-wise averaged T1 values from in-vivo data were obtained by querying two anatomical atlases for cortical and subcortical structures, respectively. Given the different brain coverage achieved by multislice IR and the 3D volumetric data, results are reported only on the volume covered by IR.
Results and Discussion
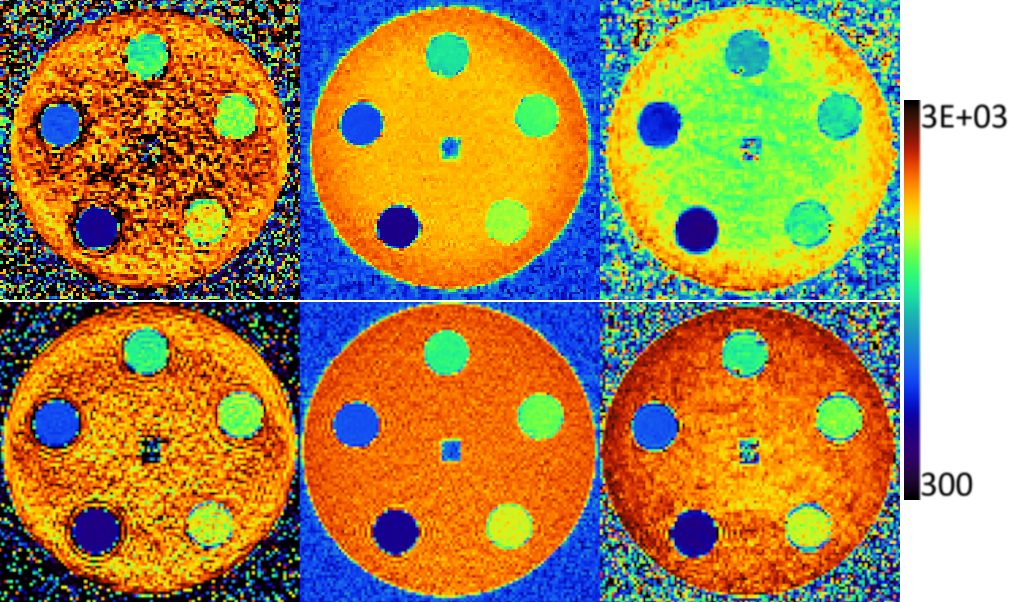
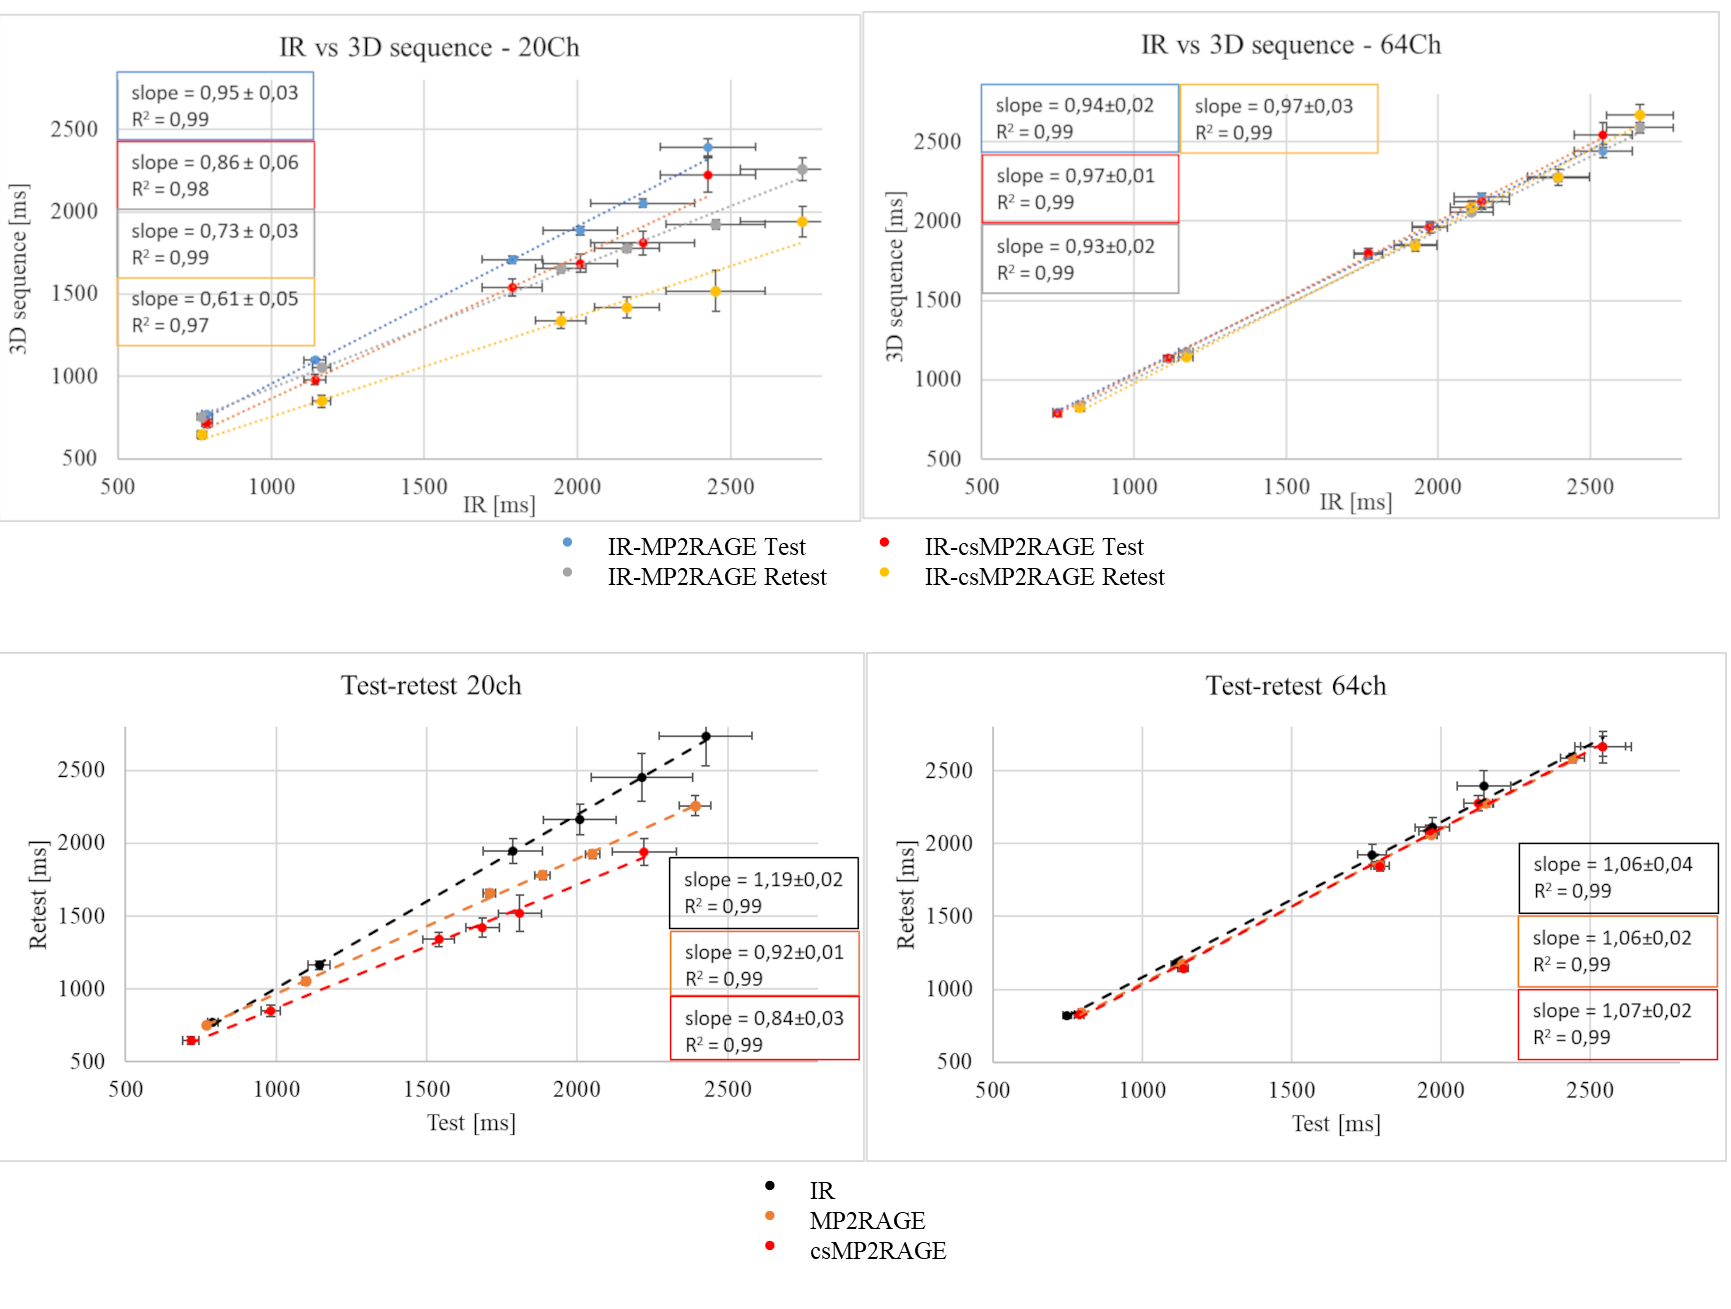
Phantom results: Figure 1 shows phantom T1 maps from the three sequences and RF coils. Phantom T1 estimation results (Fig. 2, top row) show biases with respect to the IR estimations that strongly depend on the head coil. For the 20-ch coil, the average T1 estimation compared to IR is reduced for MP2RAGE (Slope±SD of LSQ estimator: 0.84±0.03) and for csMP2RAGE (0.73±0.06). For the 64ch coil, the average T1 underestimation was similar in both 3D sequences and approximately 0.95±0.02.Phantom T1 reproducibility results (Fig. 2, bottom row) also show a critical dependency on RF coil, with higher reproducibility for the 64-ch than the 20-ch coil. In particular: the IR led to an overestimation of T1 values compared to the first measurement (1.19±0.02), while the standard MP2RAGE and csMP2RAGE both reported an underestimation (0.92±0.01, 0.84±0.03) in the re-test measures. With the 64ch coil the values are very reproducible, although a comparable overestimation (IR: 1.06±0.04; MP2RAGE: 1.06±0.02; csMP2RAGE: 1.07±0.03) can be observed.
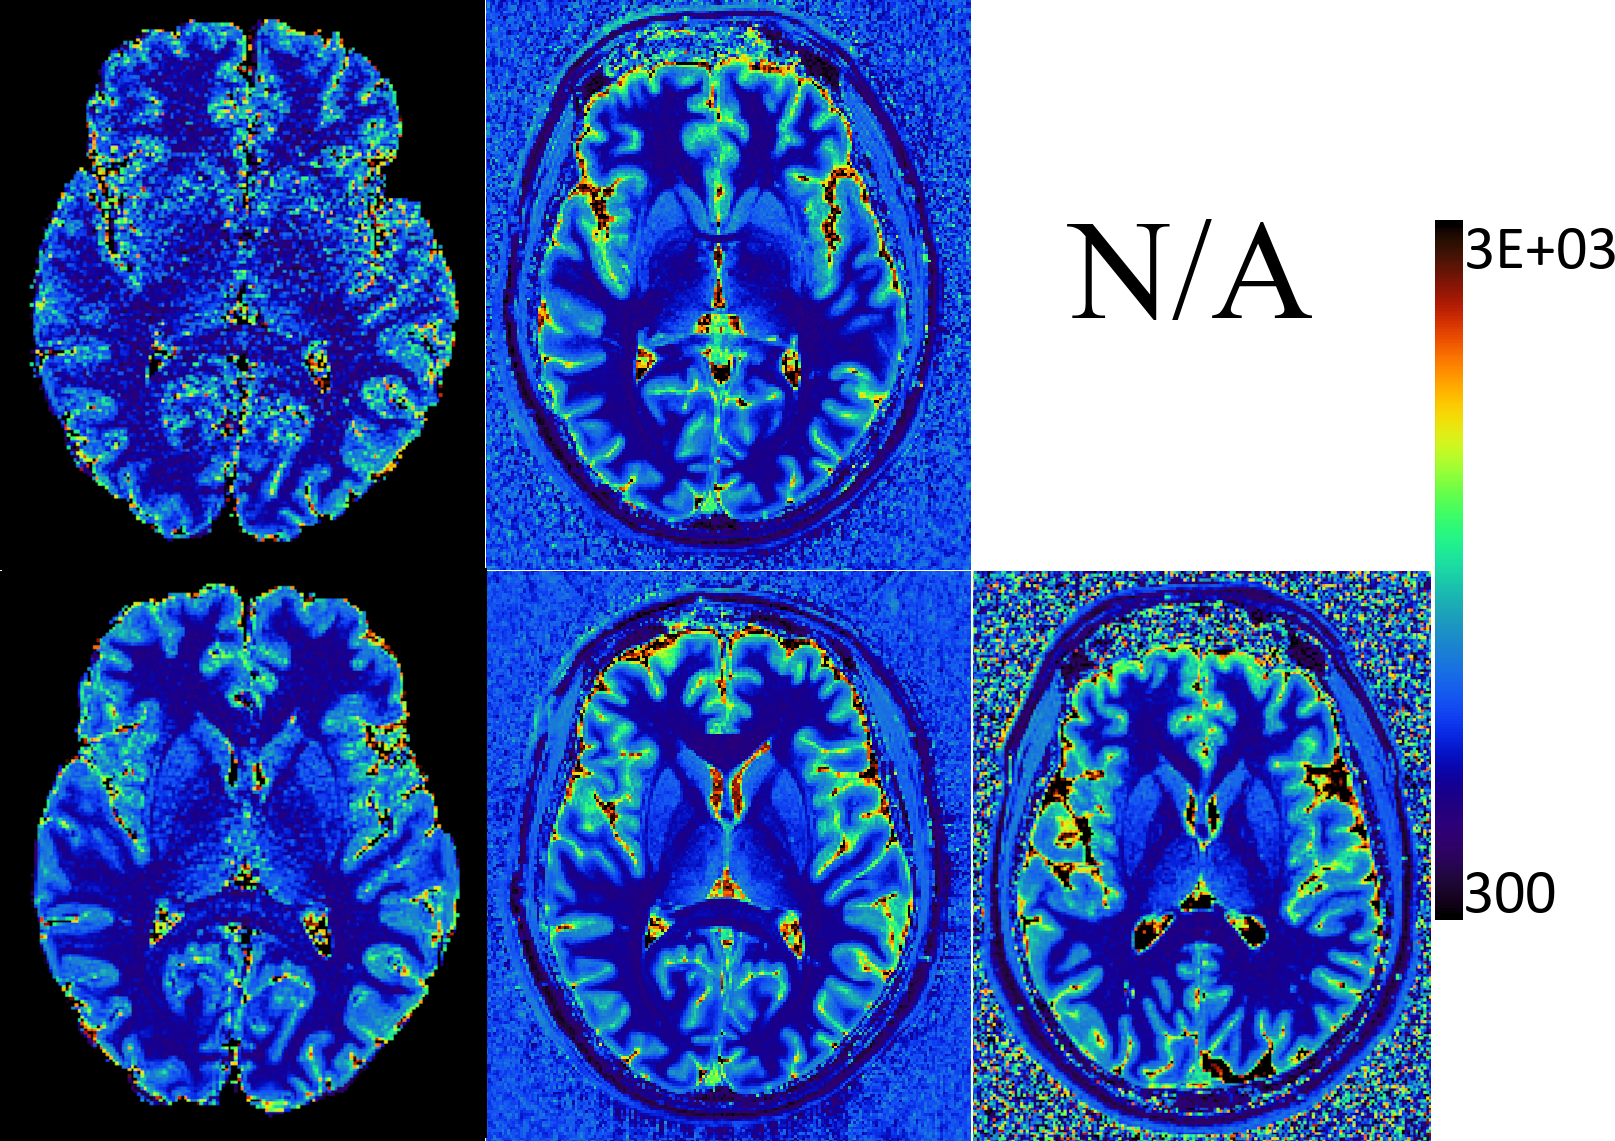
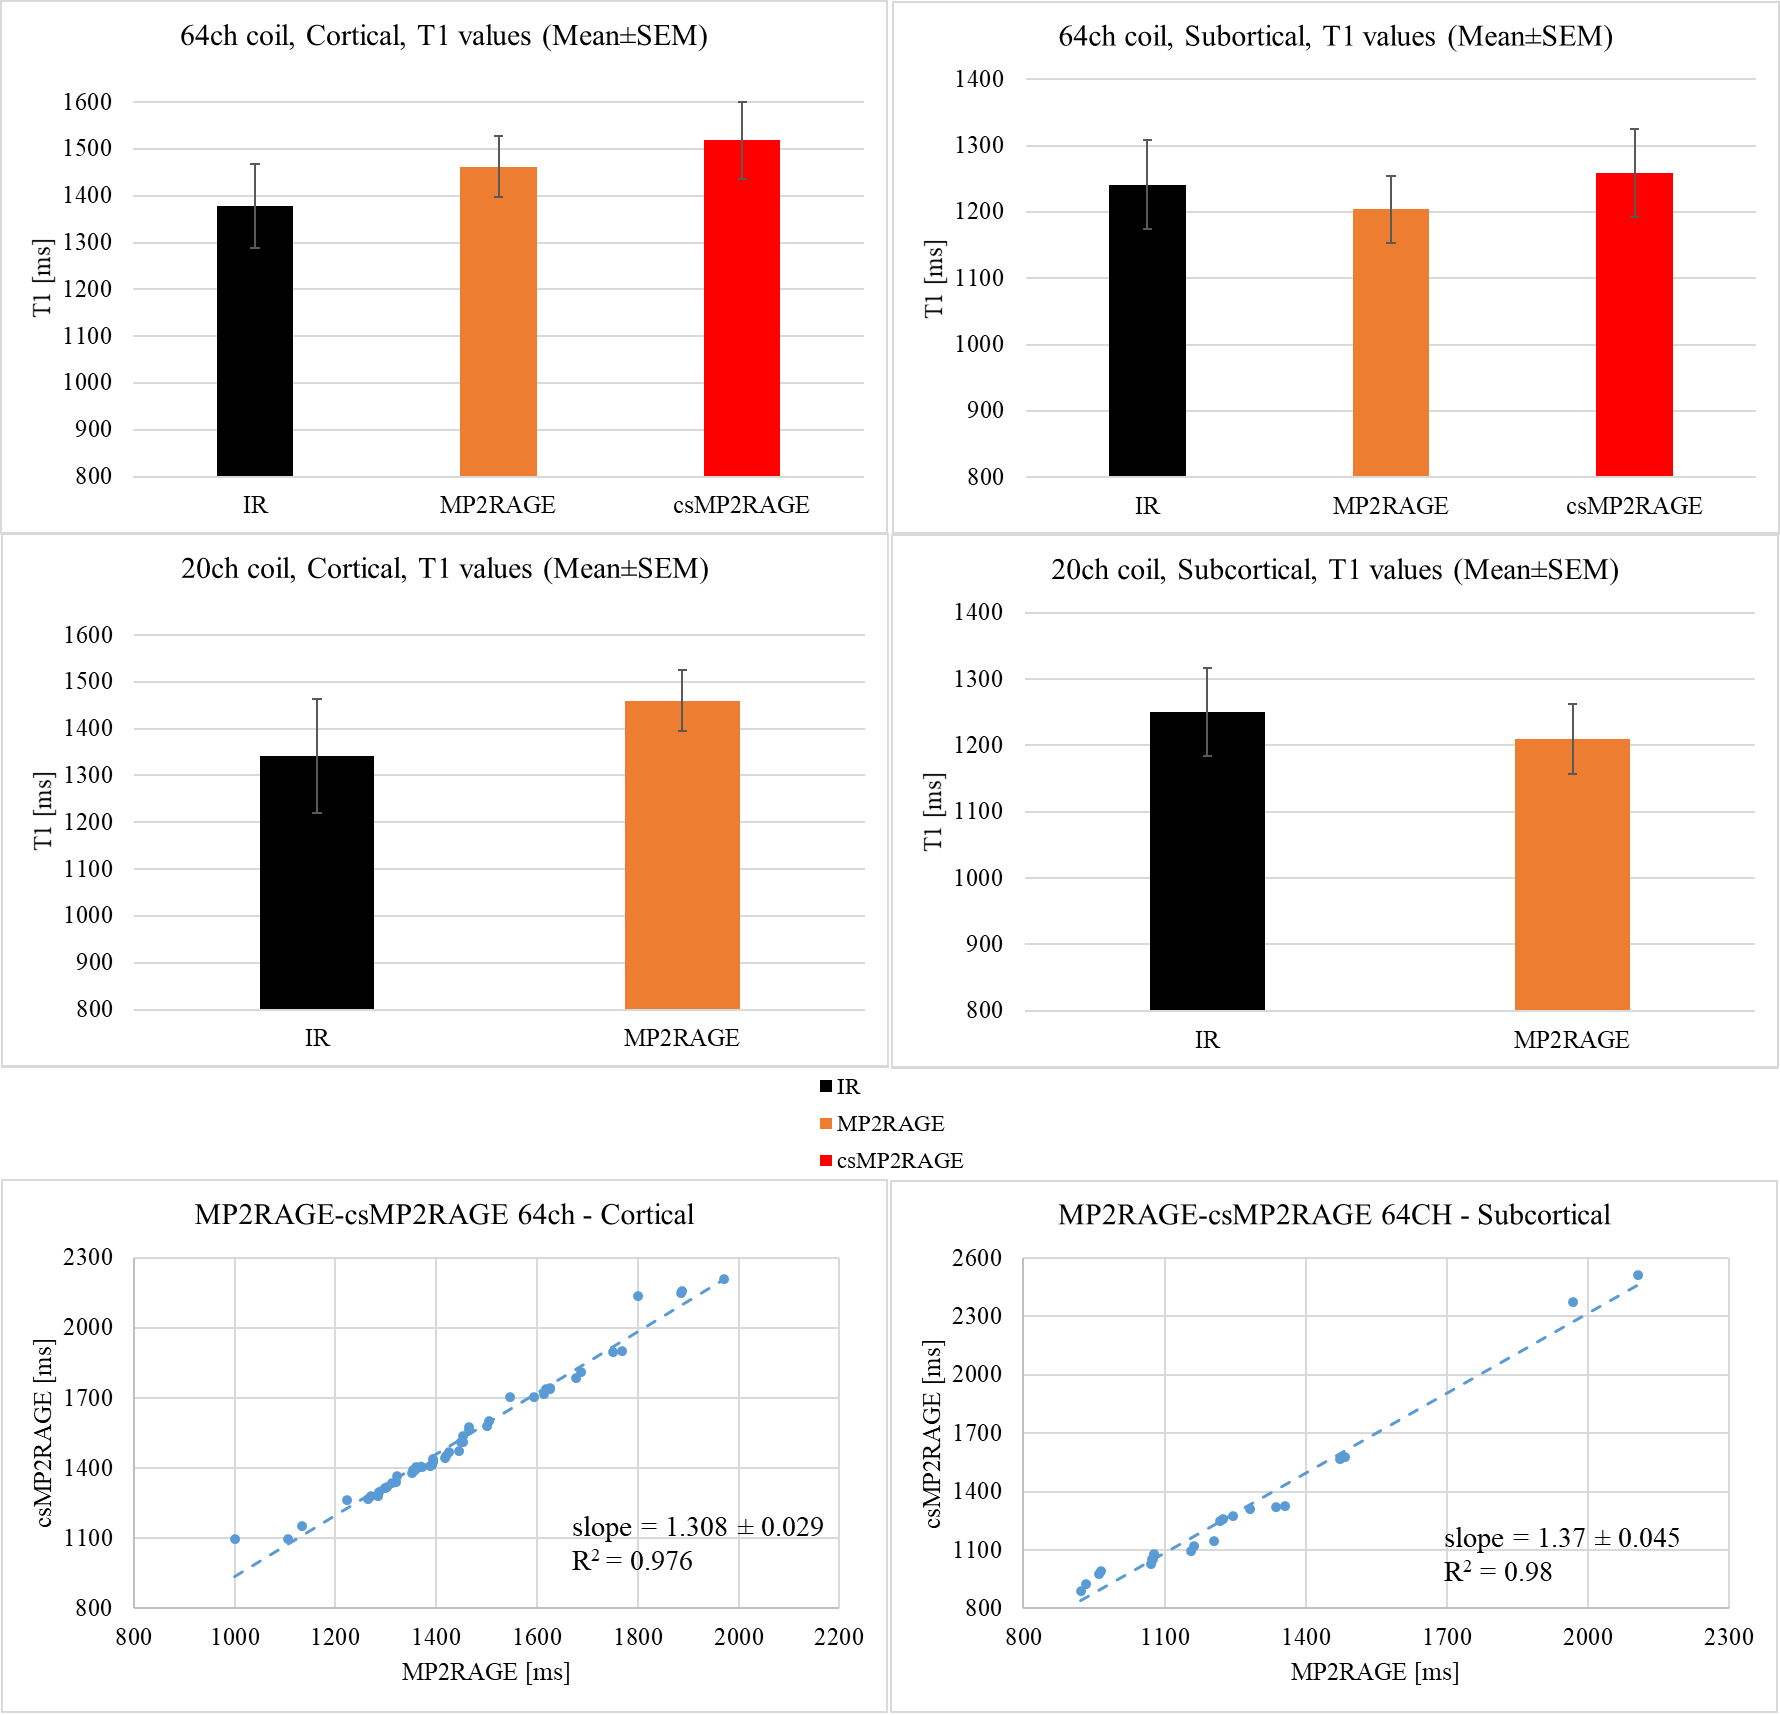
Human results: Figure 3 shows representative brain T1 maps from one volunteer for the two RF coils. Figure 4 reports, on the top panel, average T1 estimations for each sequence and RF coil in cortical and subcortical gray matter. The IR data shows a slightly higher variability, regardless of the anatomical location and the hardware configuration, when compared to volumetric sequences. The bottom panel of Figure 4 shows the T1 correlations between MP2RAGE and its accelerated counterpart, for cortical and subcortical gray matter (64-ch coil). Both scatter plots highlight a robust agreement between the two sequences for cortical and subcortical structures (R2 = 0.97 and 0.98, respectively) despite a mild, although in a physiologically acceptable range9, overestimation of T1 values with csMP2RAGE compared to MP2RAGE.
Conclusions
MP2RAGE and csMP2RAGE volumetric sequences offer attractive alternatives for fast T1 mapping of the brain compared to the time-consuming Inversion Recovery. Our phantom results show that T1 mapping and its reproducibility are affected by both sequence and RF coil: higher accuracy and reproducibility was obtained with the 64-ch coil. The quantitative in-vivo maps obtained with csMP2RAGE show a robust correlation with those obtained by conventional MP2RAGE, with a 2-fold reduction in scanning time for csMP2RAGE. These results are in good agreement with previous findings5Limitations and Future Work
Low sample size. The phantom could be adjusted to reach lower T1 values (300 ms) corresponding to white matter at 3T. MP2RAGE is known to have limits4 for estimating T1 values above 2s. However, the phantom 64ch coil results show good agreement between IR and MP2RAGE in the range 2 - 2.5 s. Instead of doing separate optimizations, the same regularization settings for csMP2RAGE were used in both RF coils, which could explain the biases and reproducibility issues in the 20ch coil.Acknowledgements
No acknowledgement found.References
1. Taylor AJ, Salerno M, Dharmakumar R, Jerosch-Herold M. T1 Mapping Basic Techniques and Clinical Applications. JACC Cardiovasc Imaging. 2016;9(1):67-81.
2. Shams Z, Norris DG, Marques JP. A comparison of in vivo MRI based cortical myelin mapping using T1w/T2w and R1 mapping at 3T. PLoS One. 2019;14(7):1-22.
3. Barral JK, Gudmundson E, Stikov N, Etezadi-Amoli M, Stoica P, Nishimura DG. A robust methodology for in vivo T1 mapping. Magn Reson Med. 2010;64(4):1057-1067.
4. Marques JP, Kober T, Krueger G, van der Zwaag W, Van de Moortele PF, Gruetter R. MP2RAGE, a self bias-field corrected sequence for improved segmentation and T1-mapping at high field. Neuroimage. 2010;49(2):1271-1281.
5. Mussard E, Hilbert T, Forman C, Meuli R, Thiran JP, Kober T. Accelerated MP2RAGE imaging using Cartesian phyllotaxis readout and compressed sensing reconstruction. Magn Reson Med. 2020;84(4):1881-1894.
6. O’Brien K, Krueger G, Lazeyras F, Gruetter R, Roche A. A simple method to denoise MP2RAGE. ISMRM 2013;21:2013.
7. Karakuzu A, Boudreau M, Duval T, et al. qMRLab: Quantitative MRI analysis, under one umbrella. J Open Source Software. 2020;5(53):2343.
8. Jenkinson M, Beckmann CF, Behrens TEJ, Woolrich MW, Smith SM. Fsl. Neuroimage. 2012;62(2):782-790.
9. Bojorquez JZ, Bricq S, Acquitter C, Brunotte F, Walker PM, Lalande A. What are normal relaxation times of tissues at 3T? Magn Reson Imaging. 2017;35:69–80.
Figures