3064
Compressed sensing for accelerated multi-parameter quantitative MRI
Arun Joseph1,2,3, Quentin Raynaud4, Antoine Lutti4, Tobias Kober5,6,7, and Tom Hilbert5,6,7
1Advanced Clinical Imaging Technology, Siemens Healthcare AG, Bern, Switzerland, 2Translational Imaging Center, Sitem-Insel, Bern, Switzerland, 3Departments of Radiology and Biomedical Research, University of Bern, Bern, Switzerland, 4Laboratory for Neuroimaging Research, Department for Clinical Neuroscience, Lausanne University Hospital and Lausanne University, Lausanne, Switzerland, 5Advanced Clinical Imaging Technology, Siemens Healthcare AG, Lausanne, Switzerland, 6Department of Radiology, Lausanne University Hospital and University of Lausanne, Lausanne, Switzerland, 7LTS5, École Polytechnique Fédérale de Lausanne (EPFL), Lausanne, Switzerland
1Advanced Clinical Imaging Technology, Siemens Healthcare AG, Bern, Switzerland, 2Translational Imaging Center, Sitem-Insel, Bern, Switzerland, 3Departments of Radiology and Biomedical Research, University of Bern, Bern, Switzerland, 4Laboratory for Neuroimaging Research, Department for Clinical Neuroscience, Lausanne University Hospital and Lausanne University, Lausanne, Switzerland, 5Advanced Clinical Imaging Technology, Siemens Healthcare AG, Lausanne, Switzerland, 6Department of Radiology, Lausanne University Hospital and University of Lausanne, Lausanne, Switzerland, 7LTS5, École Polytechnique Fédérale de Lausanne (EPFL), Lausanne, Switzerland
Synopsis
Quantitative MRI (qMRI) provides biomarkers of microstructural properties of brain tissue and enables in-vivo monitoring of microscopic brain changes due to disease in patient populations. The widely used Multi Parameter Mapping qMRI protocol allows the computation of MTSat, PD, R1, and R2* maps. While it allows the assessment of multiple brain tissue properties, its acquisition time is excessive for clinical applications. Here, we propose a compressed sensing scheme based on a Cartesian spiral-phyllotaxis readout to reduce the total acquisition time of 1mm isotropic whole brain maps. A preliminary qualitative and quantitative validation is performed on healthy subjects.
Introduction
Quantitative magnetic resonance imaging (qMRI), with its sensitivity to micro-structural properties of brain tissues such as axon density, myelination, iron content, and water concentration1, provides in-vivo imaging biomarkers of microscopic brain changes due to brain disease. qMRI also improves reproducibility and comparability of data across different hardware and imaging protocols2. The multi-parameter mapping (MPM) acquisition protocol yields whole-brain maps of the longitudinal and effective transverse relaxation rates R1 and R2*, proton density PD, and magnetization transfer (MT) saturation2,3. These maps can be computed offline from the MRI images using the freely available hMRI-toolbox (https://hmri-group.github.io/hMRI-toolbox/)10. While it allows the assessment of multiple brain tissue properties, its acquisition time is excessive for clinical applications. Here, we propose an adapted compressed sensing (CS) acquisition to reduce the acquisition time of MPM. Metrics of data consistency are provided across a range of acceleration factors, computed from data on healthy subjects.Methods
A Cartesian spiral-phyllotaxis undersampling scheme4 was implemented in a prototype gradient echo (GRE) sequence. Three subjects were measured at 3T (MAGNETOM Prisma, Siemens Healthcare, Erlangen, Germany) using a 64-channel head/neck-coil after obtaining written informed consent. The protocol consisted of undersampled T1-weighted, PD, and MT multi-echo acquisitions using the prototype sequence. The scan parameters are shown in Table 1. The measurements were performed in the sagittal plane with undersampling factors of [2, 4, 8], yielding total acquisition times (TA) of [17:20, 8:44, 4:19] minutes. For comparison, reference data was acquired using a product GRE sequence with GRAPPAx2 acceleration5 with TA = 15:32 minutes. An MP-RAGE sequence was acquired and used as anatomical reference (TR 2300 ms, TI 900 ms, flip angle 8°, 0.9 mm isotropic resolution). The protocol also contained additional acquisitions for B1 maps (TA 2.14 min) and B1 bias corrections (TA 0.20 s) as recommended in the hMRI-toolbox guidelines10.Image reconstruction was performed inline on the scanner for all measurements. While the GRAPPAx2 reference used the product reconstruction, CS reconstructions were performed using a prototype iterative algorithm6-8 with a reconstruction time of ~5-7 minutes for one multi-echo dataset. The complex coil sensitivity maps for the CS reconstruction were estimated using the ESPIRiT algorithm9.
All post-processing and analysis of images were performed using Matlab (MathWorks, USA). The images obtained from the multi-echo acquisitions were used for further post-processing in the hMRI-toolbox10 which is embedded in the statistical parameter-mapping framework, producing multi-parameter maps followed by spatial registration for statistical analysis11.
A region-of-interest (ROI) analysis was performed using the prototype MorphoBox12 segmentation algorithm on seven white matter (WM) and grey matter (GM) structures, namely: frontal-WM/GM, occipital-WM/GM, parietal-WM/GM, and corpus callosum. The segmentation was performed on the MP-RAGE image, the resulting label maps were transformed into the MPM volume spaces using rigid registrations13. The mean and standard deviation from all regions were extracted using the obtained masks, and subsequently averaged across subjects for the different parameter maps, brain structures, and acceleration methods for a quantitative comparison.
Results and Discussion
Figure 1 shows example k-space undersampling schemes and trajectories used in the CS acquisitions. The images of the first echo obtained with T1-weighted, PD-weighted, and MT-weighted multi-echo GRE acquisitions for GRAPPAx2 and CS reconstructions with acceleration factors 2, 4, and 8 are shown in Figure 2. Qualitatively, the CS images show similar contrasts to the GRAPPA reference and provide good anatomical details even at higher acceleration factors. Noise artifacts can be observed in the center of the brain for higher acceleration factors (CS8). Figure 3 shows the MTSat, PD, R1, and R2* maps obtained for GRAPPA and the CS reconstructions. The CS-reconstructed maps are qualitatively comparable to the reference GRAPPA. Increased blurring can be observed at higher acceleration factors, especially in the cerebellum. The mean values of the MRI parameter estimates, computed across three subjects for different ROIs and acceleration factors, are shown in Figure 4. The mean values obtained with the CS reconstructions were found within 4.2% (MTsat), 0.7% (PD), 5.9% (R1), and 7.3% (R2*) of the reference values obtained with GRAPPAx2. The standard deviation of the distribution of the estimates in each region, averaged across the three datasets appears to be independent of the acceleration technique used. This indicates good specificity to regional tissue differences.Conclusion
We implemented a compressed sensing acquisition based on a Cartesian spiral-phyllotaxis readout scheme, that allows the generation of whole-brain quantitative multi-parameter maps (MTSat, PD, R1, and R2*) in a clinically acceptable acquisition time. Our preliminary results indicate that CS reconstruction provides data similar to the reference among different acceleration factors. Notably, at higher acceleration factors (R>=8), blurring and noise increase in CS-based maps and these effects should be considered depending on the clinical application. Further studies to validate reproducibility across different time points with a larger cohort and patient data are required.Acknowledgements
No acknowledgement found.References
- Weiskopf N, Mohammadi S, Lutti A, Callaghan MF, Advances in MRI-based computational neuroanatomy: from morphometry to in-vivo histology. Curr. Opin. Neurol. 2015; 28, 313-322.
- Weiskopf N, Suckling J, Williams G, et al. Quantitative multi-parameter mapping of R1, PD*, MT, and R2* at 3T: a multi-center validation. Front. Neurosci. 2013; 7, 95.
- Helms G, Dathe H, Kallenberg K, et al. High‐resolution maps of magnetization transfer with inherent correction for RF inhomogeneity and T1 relaxation obtained from 3D FLASH MRI. Magn Reson Med. 2008;60(6):1396-1407.
- Mussard E, Hilbert T, Forman C, et al. Accelerated MP2RAGE imaging using Cartesian phyllotaxis readout and compressed sensing reconstruction. Magn Reason Med. 2020; 84(4):1881-1894.
- Callaghan MF, Lutti A, Ashburner J, et al. Example dataset for the hMRI toolbox. Data in Brief 2019; 25, 104132.
- Forman C, Piccini D, Grimm R, et al. High-resolution 3D whole-heart coronary MRA: a study on the combination of data acquisition in multiple breath-holds and 1D residual respiratory motion compensation. MAGMA. 2014;27(5):435-43.
- Wetzl J, Forman C, Wintersperger BJ, et al. High-resolution dynamic CE-MRA of the thorax enabled by iterative TWIST reconstruction. Magn Reson Med. 2017;77(2):833-840.
- Ma LE, Markl M, Chow K, et al. Aortic 4D flow MRI in 2 minutes using compressed sensing, respiratory controlled adaptive k-space reordering, and inline reconstruction. Magn Reson Med. 2019;81(6):3675-3690.
- Uecker M, Lai P, Murphy MJ, et al. ESPIRiT-an eigenvalue approach to autocalibrating parallel MRI: where SENSE meets GRAPPA. Magn Reson Med 2014;71(3):990-1001.
- Tabelow K, Balteau E, Ashburner J, et al. hMRI – A toolbox for quantitative MRI in neuroscience and clinical research. Neuroimage 2019; 194, 191-210.
- Draganski B, Ashburner J, Hutton C, et al. Regional specificity of MRI contrast parameter changes in normal ageing revealed by voxel-based quantification (VBQ). Neuroimage 2011; 55, 1423-1434.
- Schmitter D, Roche A, Maréchal B et al. An evaluation of volume-based morphometry for prediction of mild cognitive impairment and Alzheimer's disease. Neuroimage Clin. 2014; 7:7-17.
- Klein S, Staring M, Murphy K, et al. "Elastix: a toolbox for intensity based medical image registration," IEEE Transactions on Medical Imaging 2010; 29(1):196-205.
Figures
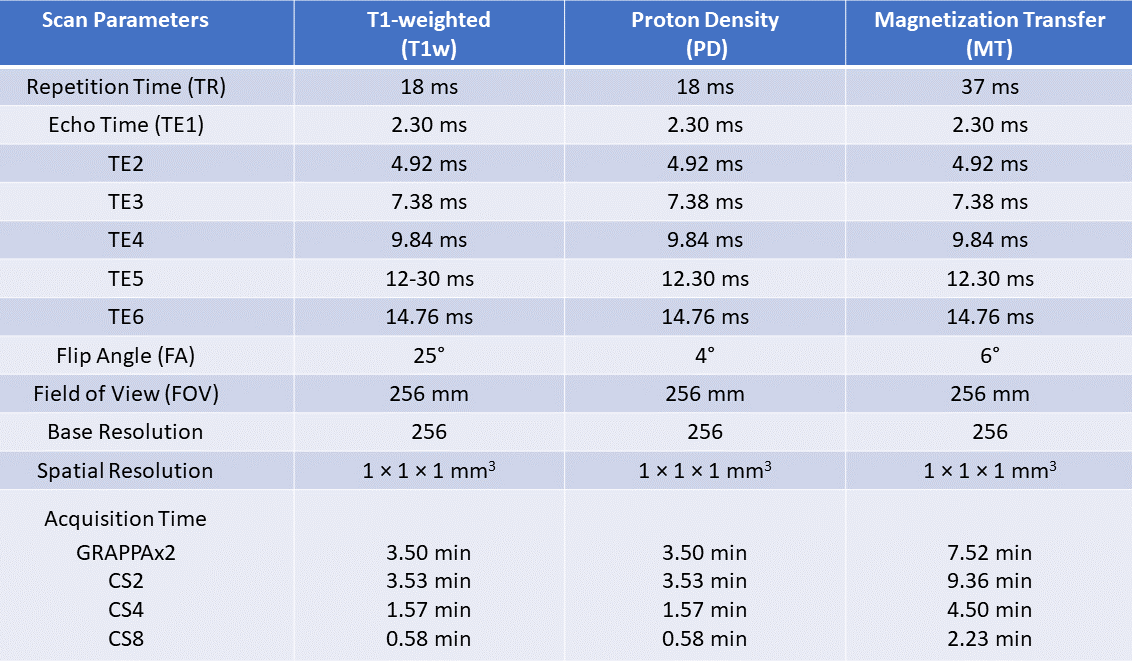
Table 1:
Scan parameters for multi-echo T1-weighted (T1w),
proton-density-weighted (PD) and magnetization-transfer-weighted (MT)
acquisitions and for different acceleration techniques GRAPPAx2, CS2, 4, and 8.
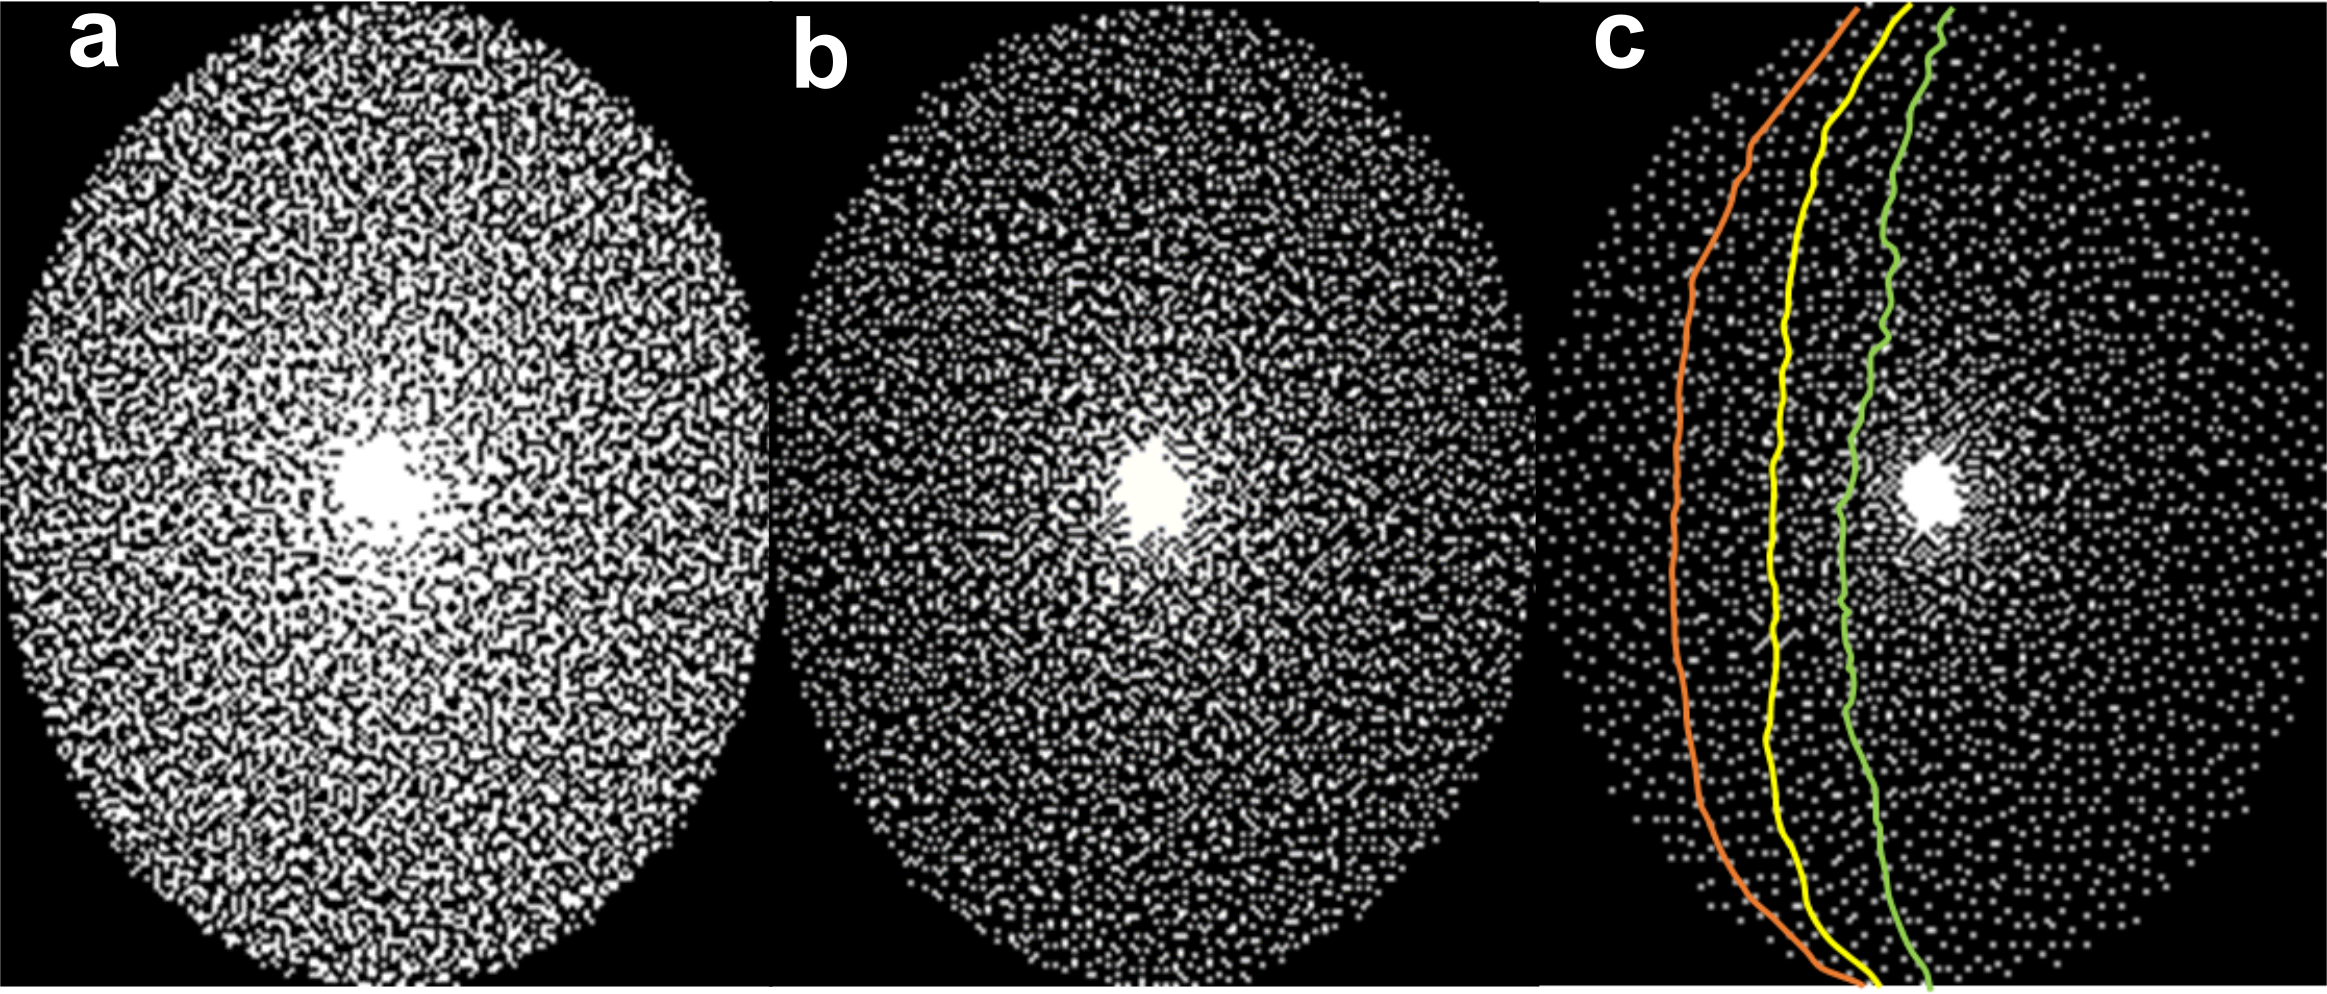
Figure 1:
The sampling masks used in
the compressed sensing acquisition which was calculated using the Cartesian
spiral-phyllotaxis algorithm obtaining different acceleration factors of (a) 2,
(b) 4, and (c) 8. An example of arc-based k-space trajectories used for compressed
sensing acquisitions is shown in (c).
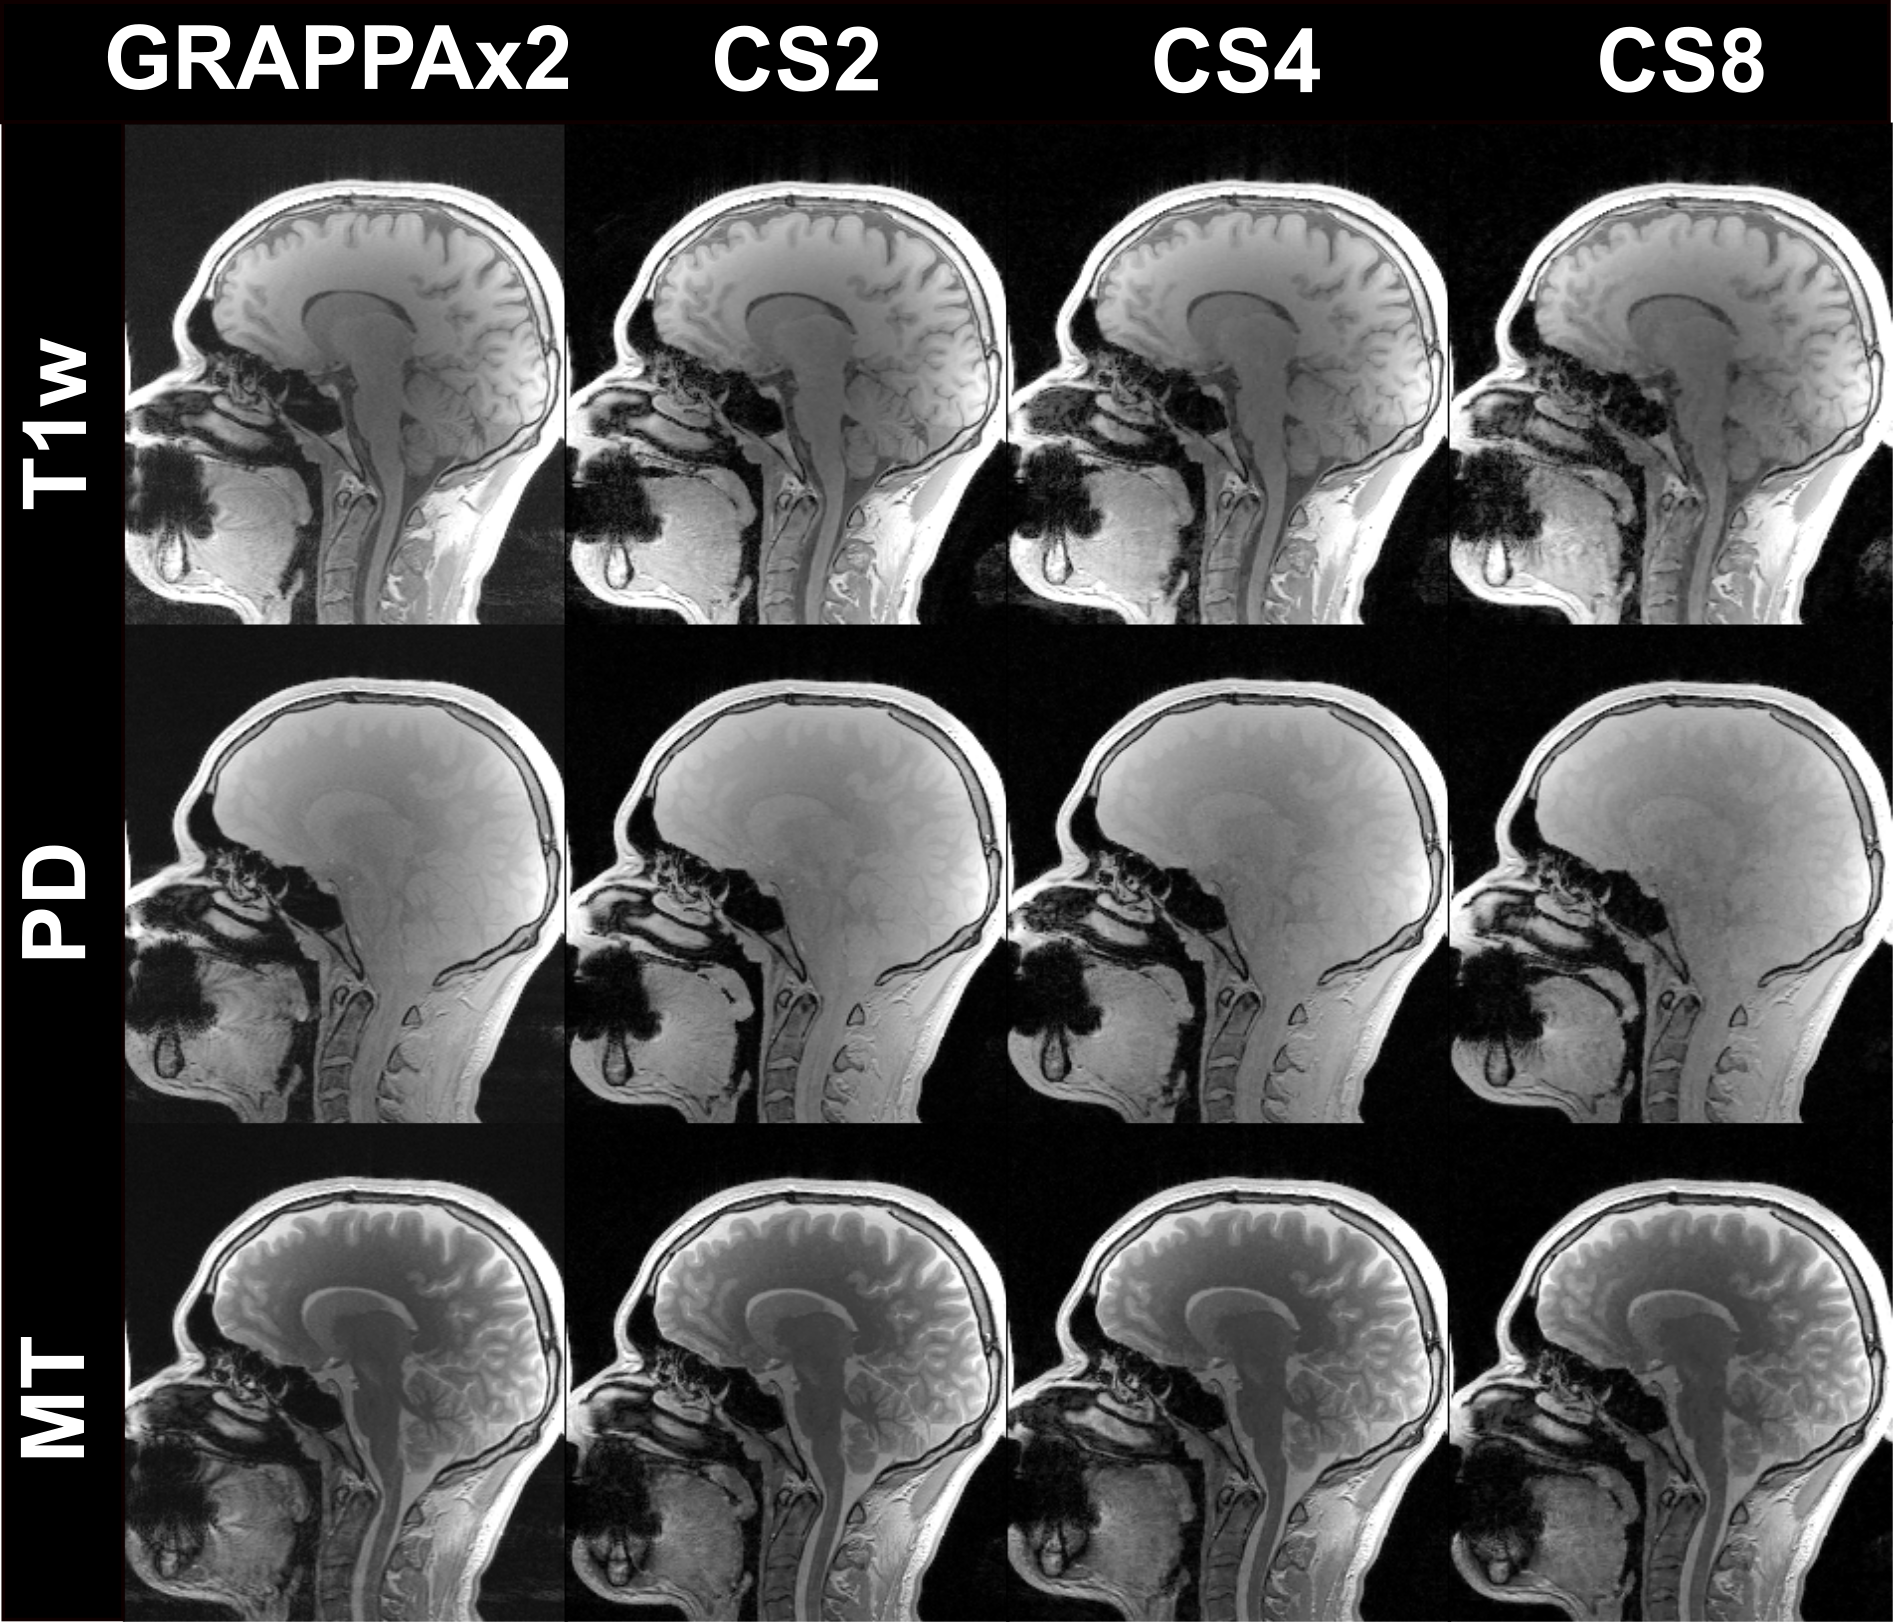
Figure 2:
Magnitude images
of the first echo obtained from the T1-weighted (T1w), PD-weighted, and MT-weighted
multi-echo GRE acquisitions in comparison of the different acceleration
techniques: GRAPPAx2 and compressed sensing (CS) reconstructions with
acceleration factors 2, 4, and 8.
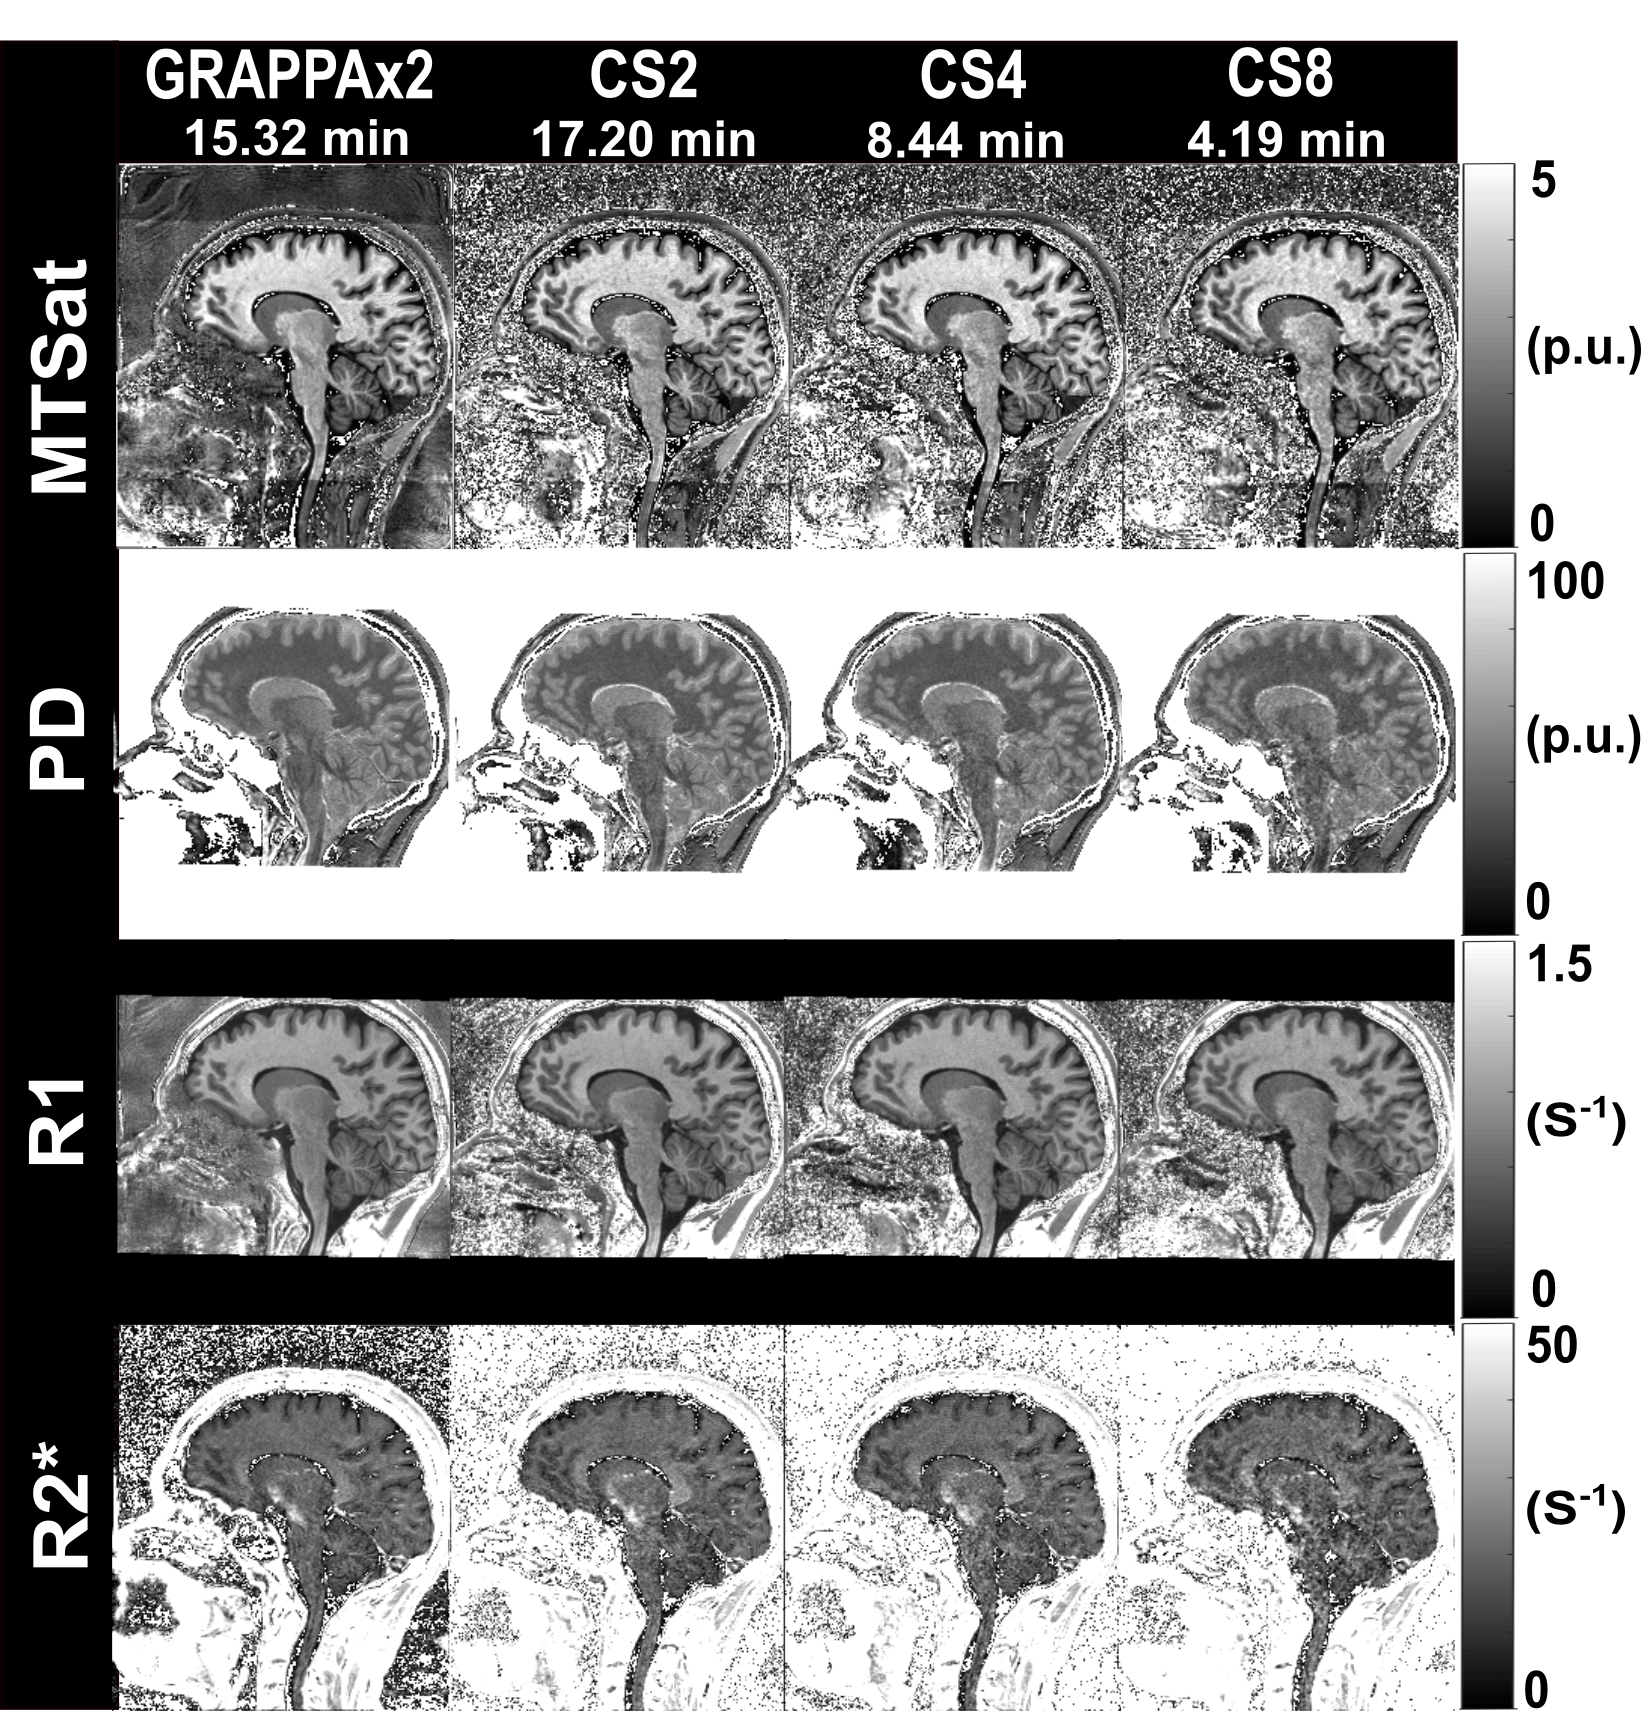
Figure 3:
MTSat, PD, R1, and R2* maps obtained from GRAPPAx2
and compressed sensing reconstructions with acceleration factors 2, 4, 8.
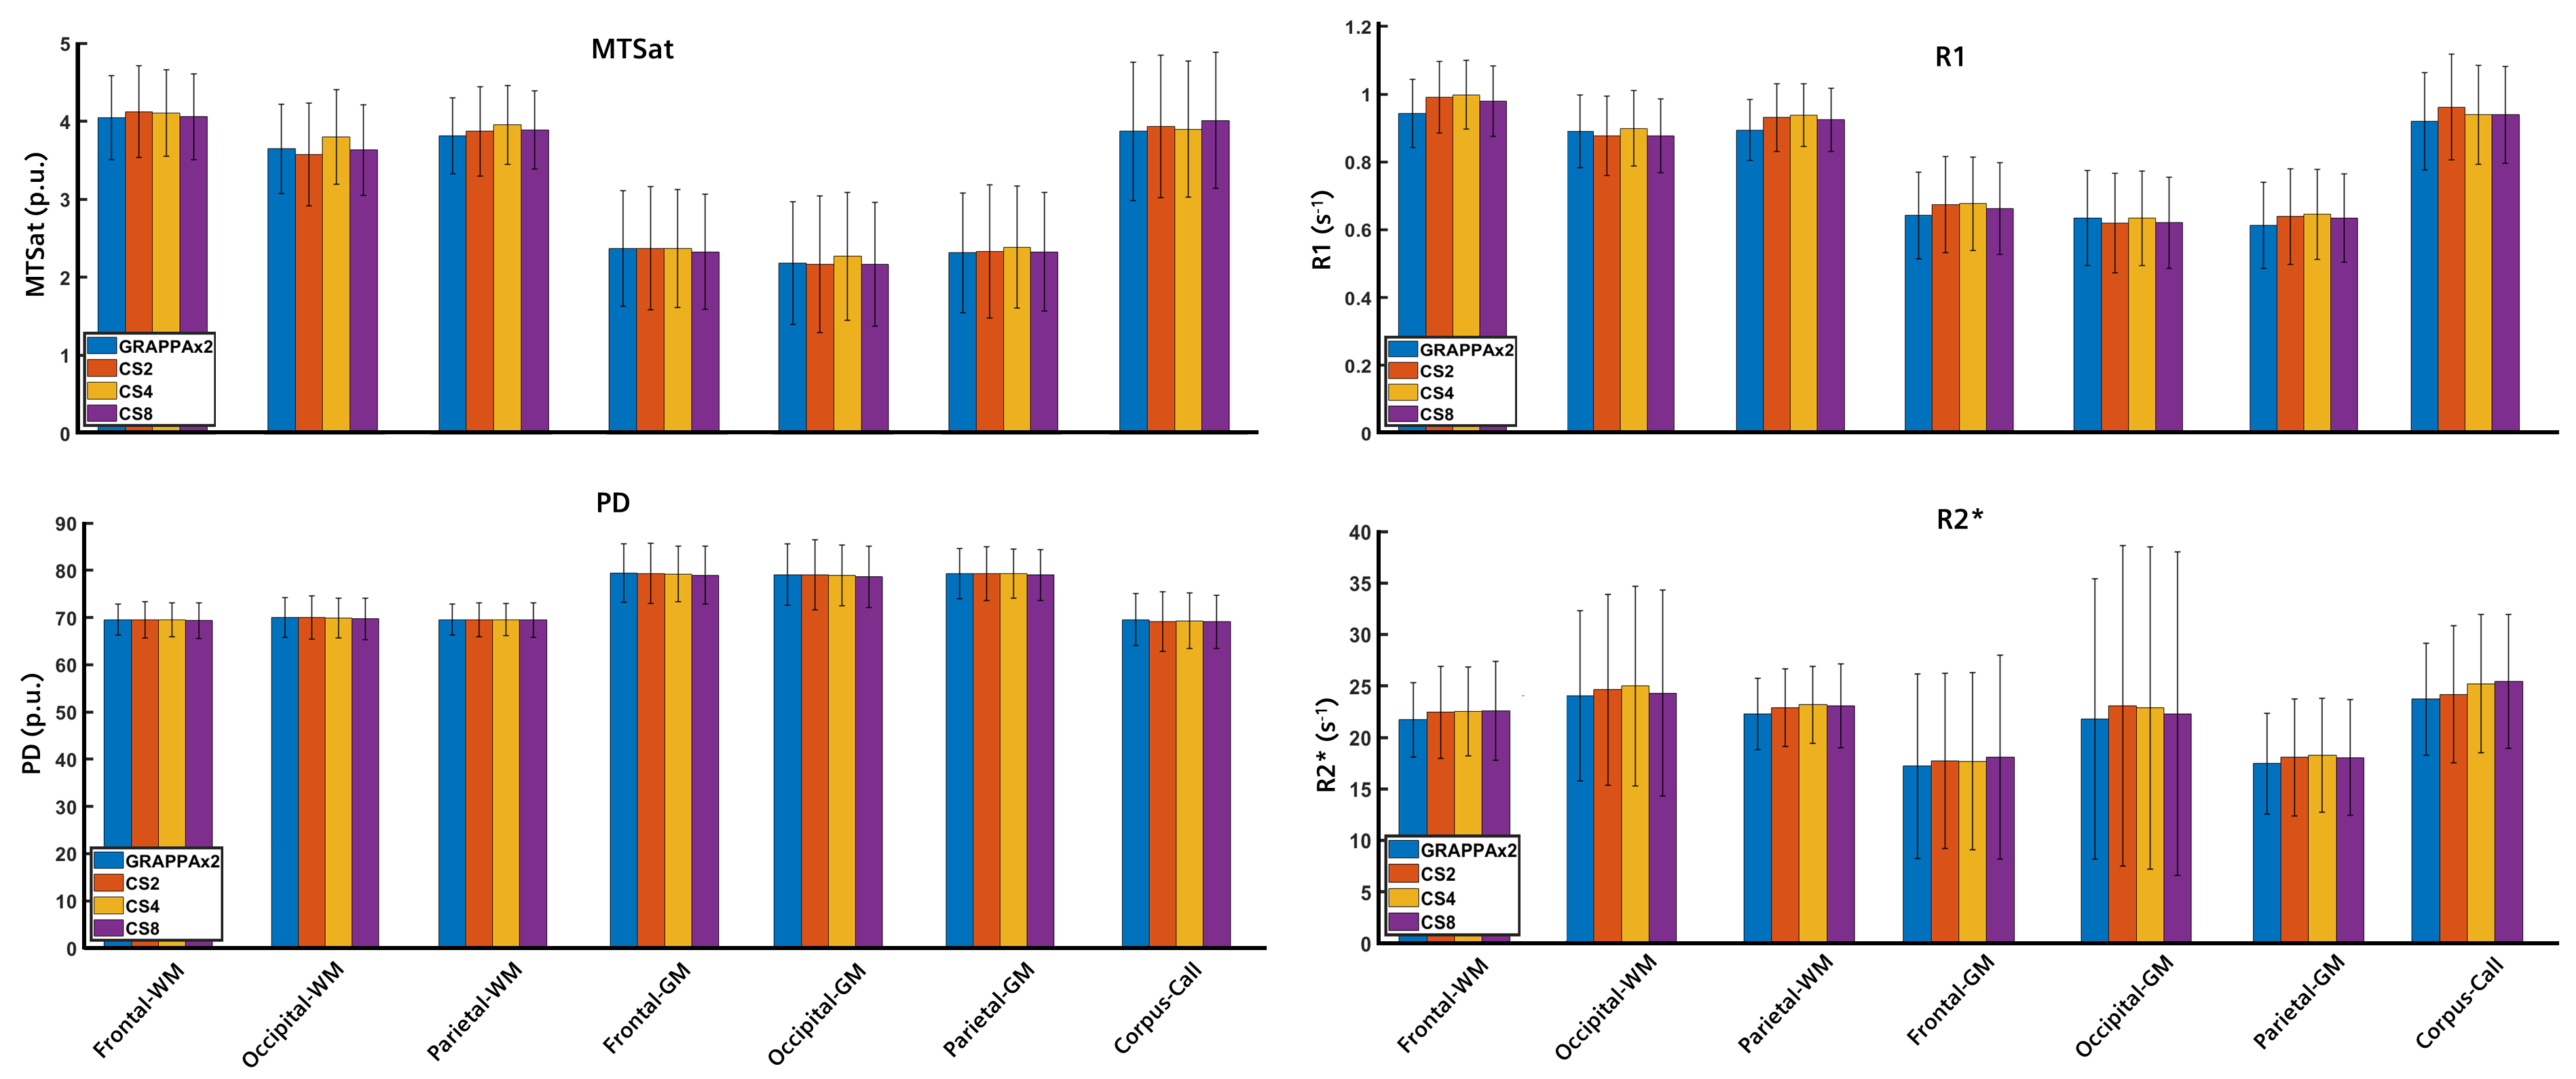
Figure 4:
Regional values of MTSat,
PD, R1, and R1* maps averaged across three healthy subjects. The error bars
indicate the standard deviation across subjects.