3061
Mapping correlation spectra of T1 and mean diffusivity in the human brain1Eunice Kennedy Shriver National Institute of Child Health and Human Development, National Institutes of Health, Bethesda, MD, United States, 2Center for Neuroscience and Regenerative Medicine, The Henry Jackson Foundation, Bethesda,, MD, United States, 3National Institute of Neurological Disorders and Stroke, National Institutes of Health, Bethesda, MD, United States
Synopsis
We develop a novel clinical pulse sequence with integrated inversion recovery (IR) and isotropic diffusion encoding (IDE) preparations for mapping correlation spectra of subvoxel T1 and mean diffusivities (MD) from measurements acquired with a wide range of joint T1-MD weightings. We evaluated the performance of the pulse sequence and spectral reconstruction pipeline using data from numerical simulations, a calibrated MRI phantom and healthy volunteers. Preliminary results suggest that maps of subvoxel T1-MD spectra show tissue-specific components in the human brain. Quantifying the heterogeneity of T1-diffusion properties in microscopic water pools could improve biological specificity in many clinical applications.
Introduction
Conventional MRI methods assess the average biophysical relaxation properties (e.g., T1, T2, or diffusivity) of tissue water, reflecting important differences in healthy and diseased tissues. Nevertheless, these methods have limited biological specificity as they cannot measure the heterogeneity of relaxation parameters in subvoxel water pools associated with different tissue microenvironments. In vivo relaxation-spectroscopic (RS) MRI1-3 maps the subvoxel distributions of relaxation parameters (e.g., T1, T2, diffusivity) from measurements acquired with a wide range of weightings, (e.g., TE, TI, b-value, respectively). More recently, correlation-spectroscopy (CS) MRI studies aiming to quantify how two or more relaxation properties co-vary in tissues4-14 have demonstrated improved spectroscopic discrimination of specific subvoxel water pools.In this study, we design and evaluate a novel clinical pulse sequence with integrated inversion recovery (IR) and isotropic diffusion encoding (IDE)3 preparations capable of acquiring whole-brain MRIs with a wide range of joint T1- and diffusion-weighted contrasts on a conventional clinical scanner. From IR-IDE MRIs with multiple weightings, we derive maps of two-dimensional joint probability density functions (spectra) of subvoxel T1 and mean diffusivity (MD) values in the human brain. The transformative impact that T1- and diffusion-weighted MRIs (e.g., FLAIR, MPRAGE, mADC-weighted MRIs) have had over the past decades on our ability to diagnose and characterize neurodegenerative diseases, ischemic stroke, cancer, and neuroinflammation motivates efforts to advance the quantitative mapping of these important biophysical tissue parameters.
Methods
We designed a pulse sequence with integrated IR and IDE preparations that allows independent control of T1 and MD weightings, respectively (Fig. 1). The IDE preparation uses a very efficient gradient waveform that weighs the signals from all microscopic water pools by their mean diffusivities3. The b-value is adjusted by simply scaling the gradient amplitudes. The sequence interleaves the slice-selective IR-preparation and slice acquisition modules to maintain the same TI and TR for all slices15. In each scan, the T1-weighting is determined by fixing both the TI and TR, while the IDE diffusion-weighting is varied in consecutive TRs. The experiment consists of several such repeated IR-IDE scans, each with a different T1-weighting.The net signal in each voxel contains contributions from microscopic water pools attenuated based on their individual R1=1/T1 and MD properties:
$$S_{\eta}\left (b,TI,TR\right)=\int_{0}^{\infty}{\int_{0}^{\infty}}\left (1-2\frac{\eta}{100}e^{-TI\cdot R_1} + e^{-TR\cdot R_1} \right)e^{-b\cdot \bar{D}}p(R_1,\bar{D})dR_1d\bar{D} $$
The parameter η represents the apparent inversion efficiency as a percentage2 and contains contributions due to both B1 inhomogeneities as well as tissue-dependent processes such as magnetization transfer. By varying b, TI and TR, we can acquire IR-IDE MRIs with a wide range of joint T1 and MD encoding. From polarity-corrected IR-IDE magnitude MRIs16 we can retrieve the subvoxel spectra p(R1,D) using nonlinear optimization.
We tested the performance of the spectral reconstruction and pulse sequence by conducting Monte Carlo simulations and scanning a polymer diffusion phantom17 as well as three healthy volunteers. The IR-IDE scans consisted of 304 images acquired with all possible combinations of 16 diffusion-weightings (b from 50-3600s/mm2) and 19 T1-weightings (TI from 50-5000ms, including no-IR), TE=98ms, 22cm field-of-view, 2.5mm in-plane resolution, 5mm slice thickness, and SENSE factor 2. From the in vivo images we reconstructed maps of subvoxel T1-MD spectra (and corresponding marginal 1D spectra) and identified signal components specific to gray matter (GM), white matter (WM), basal ganglia (BG), and cerebrospinal fluid (CSF).
Results
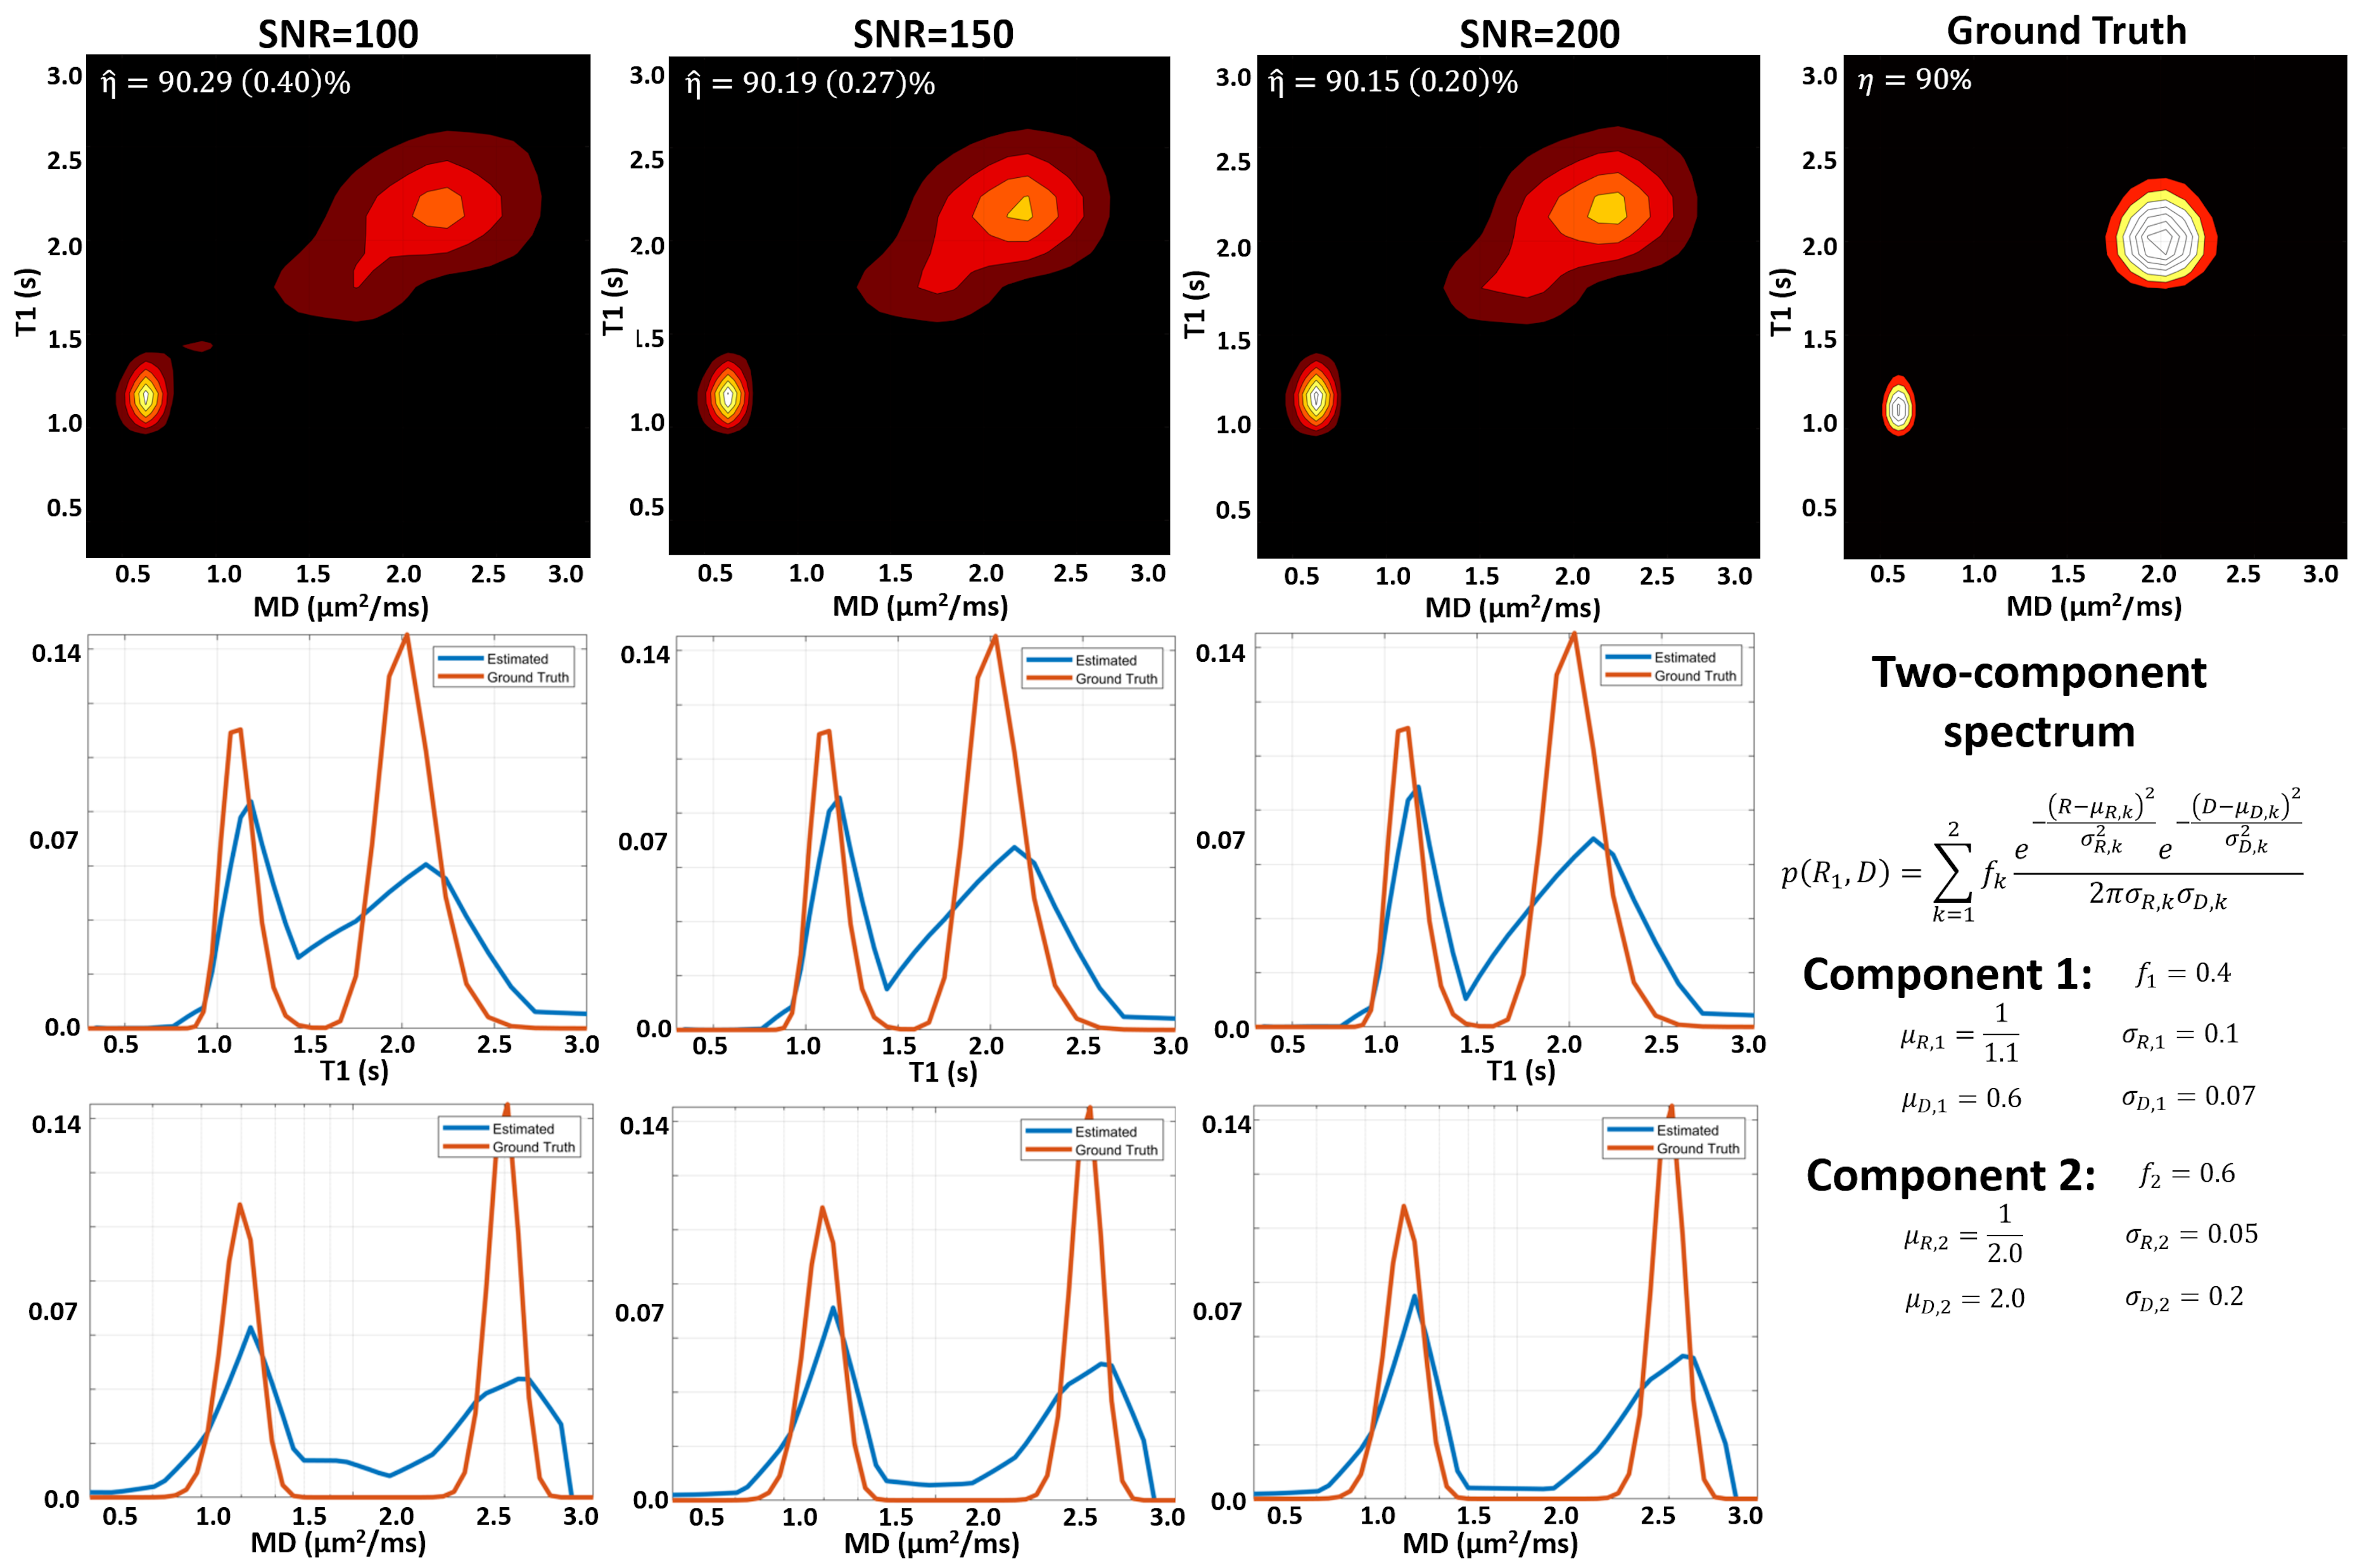
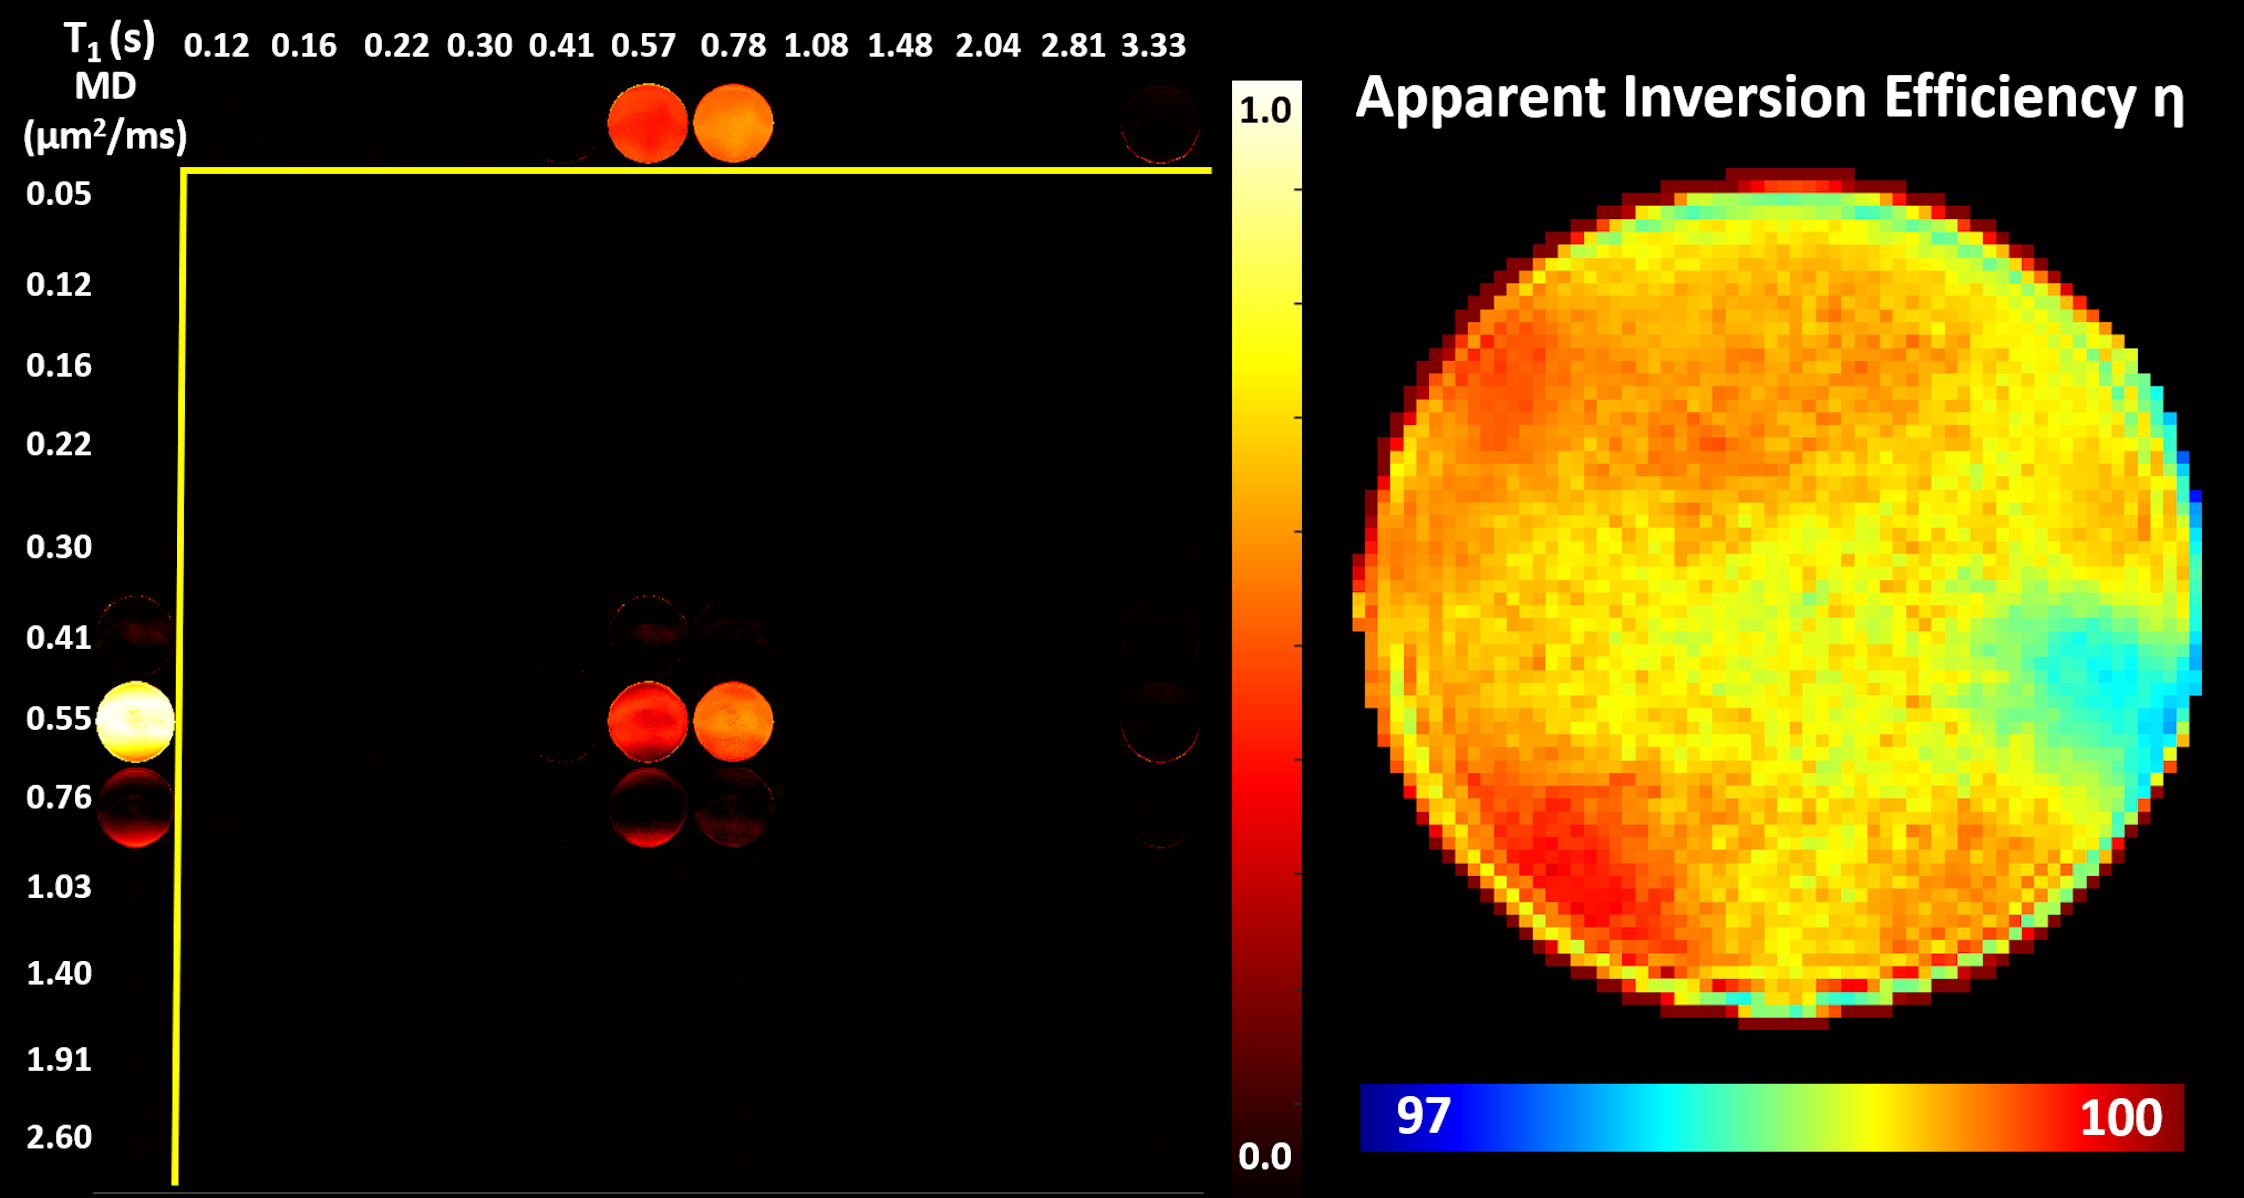
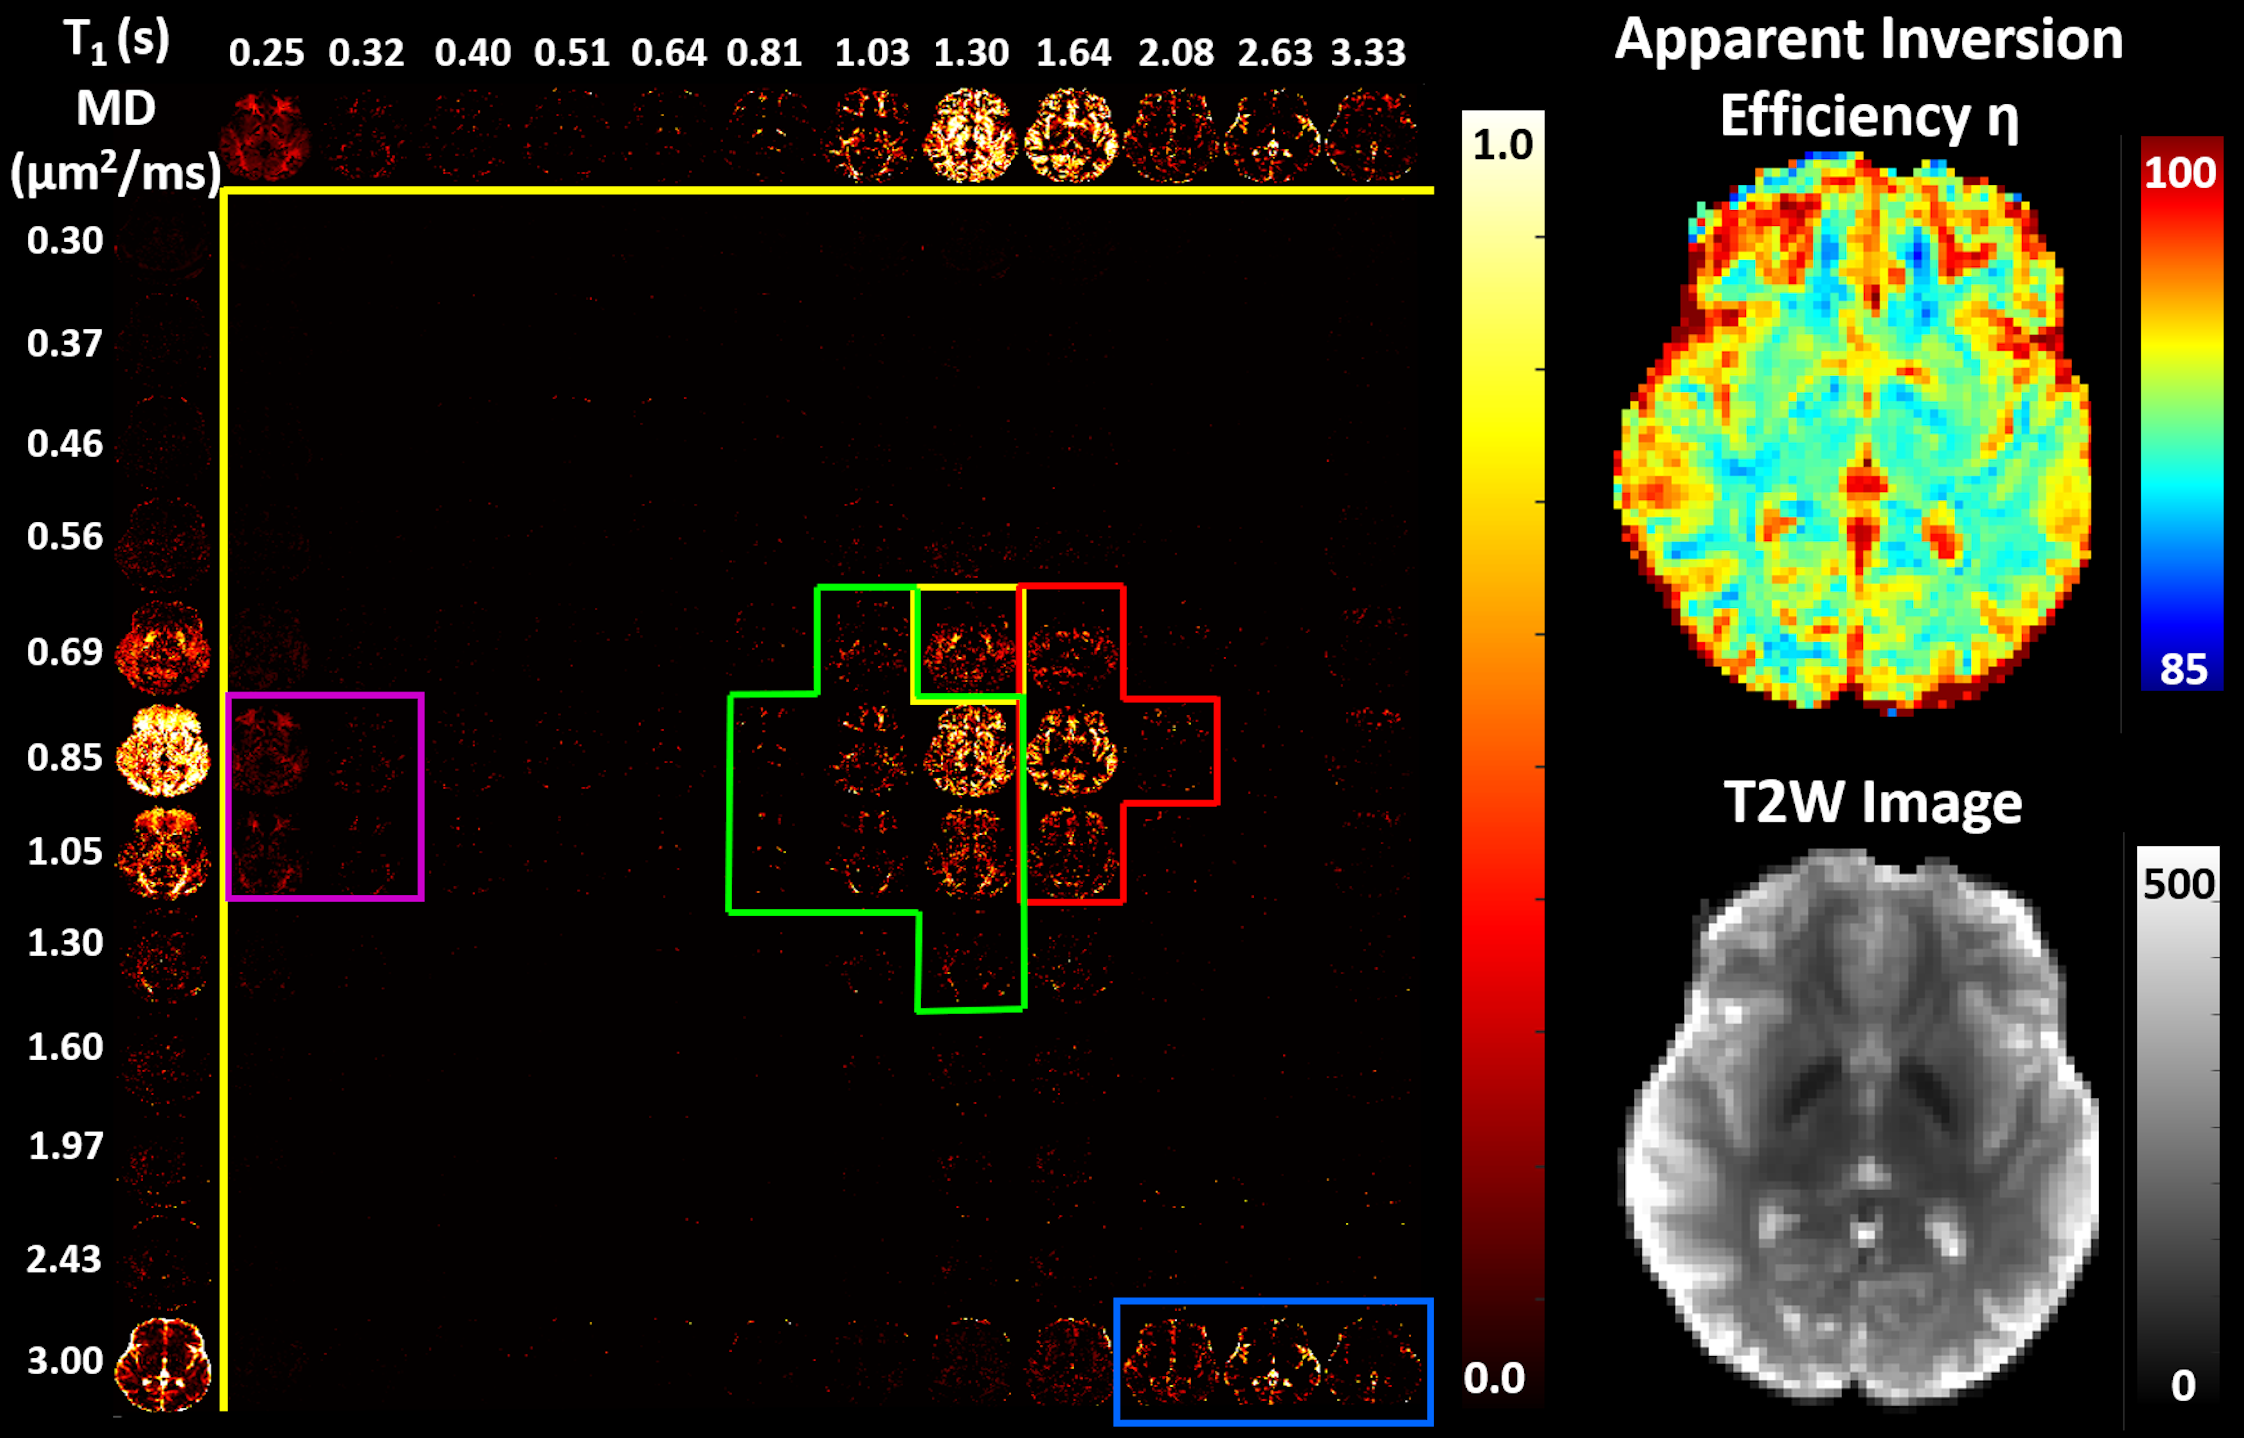
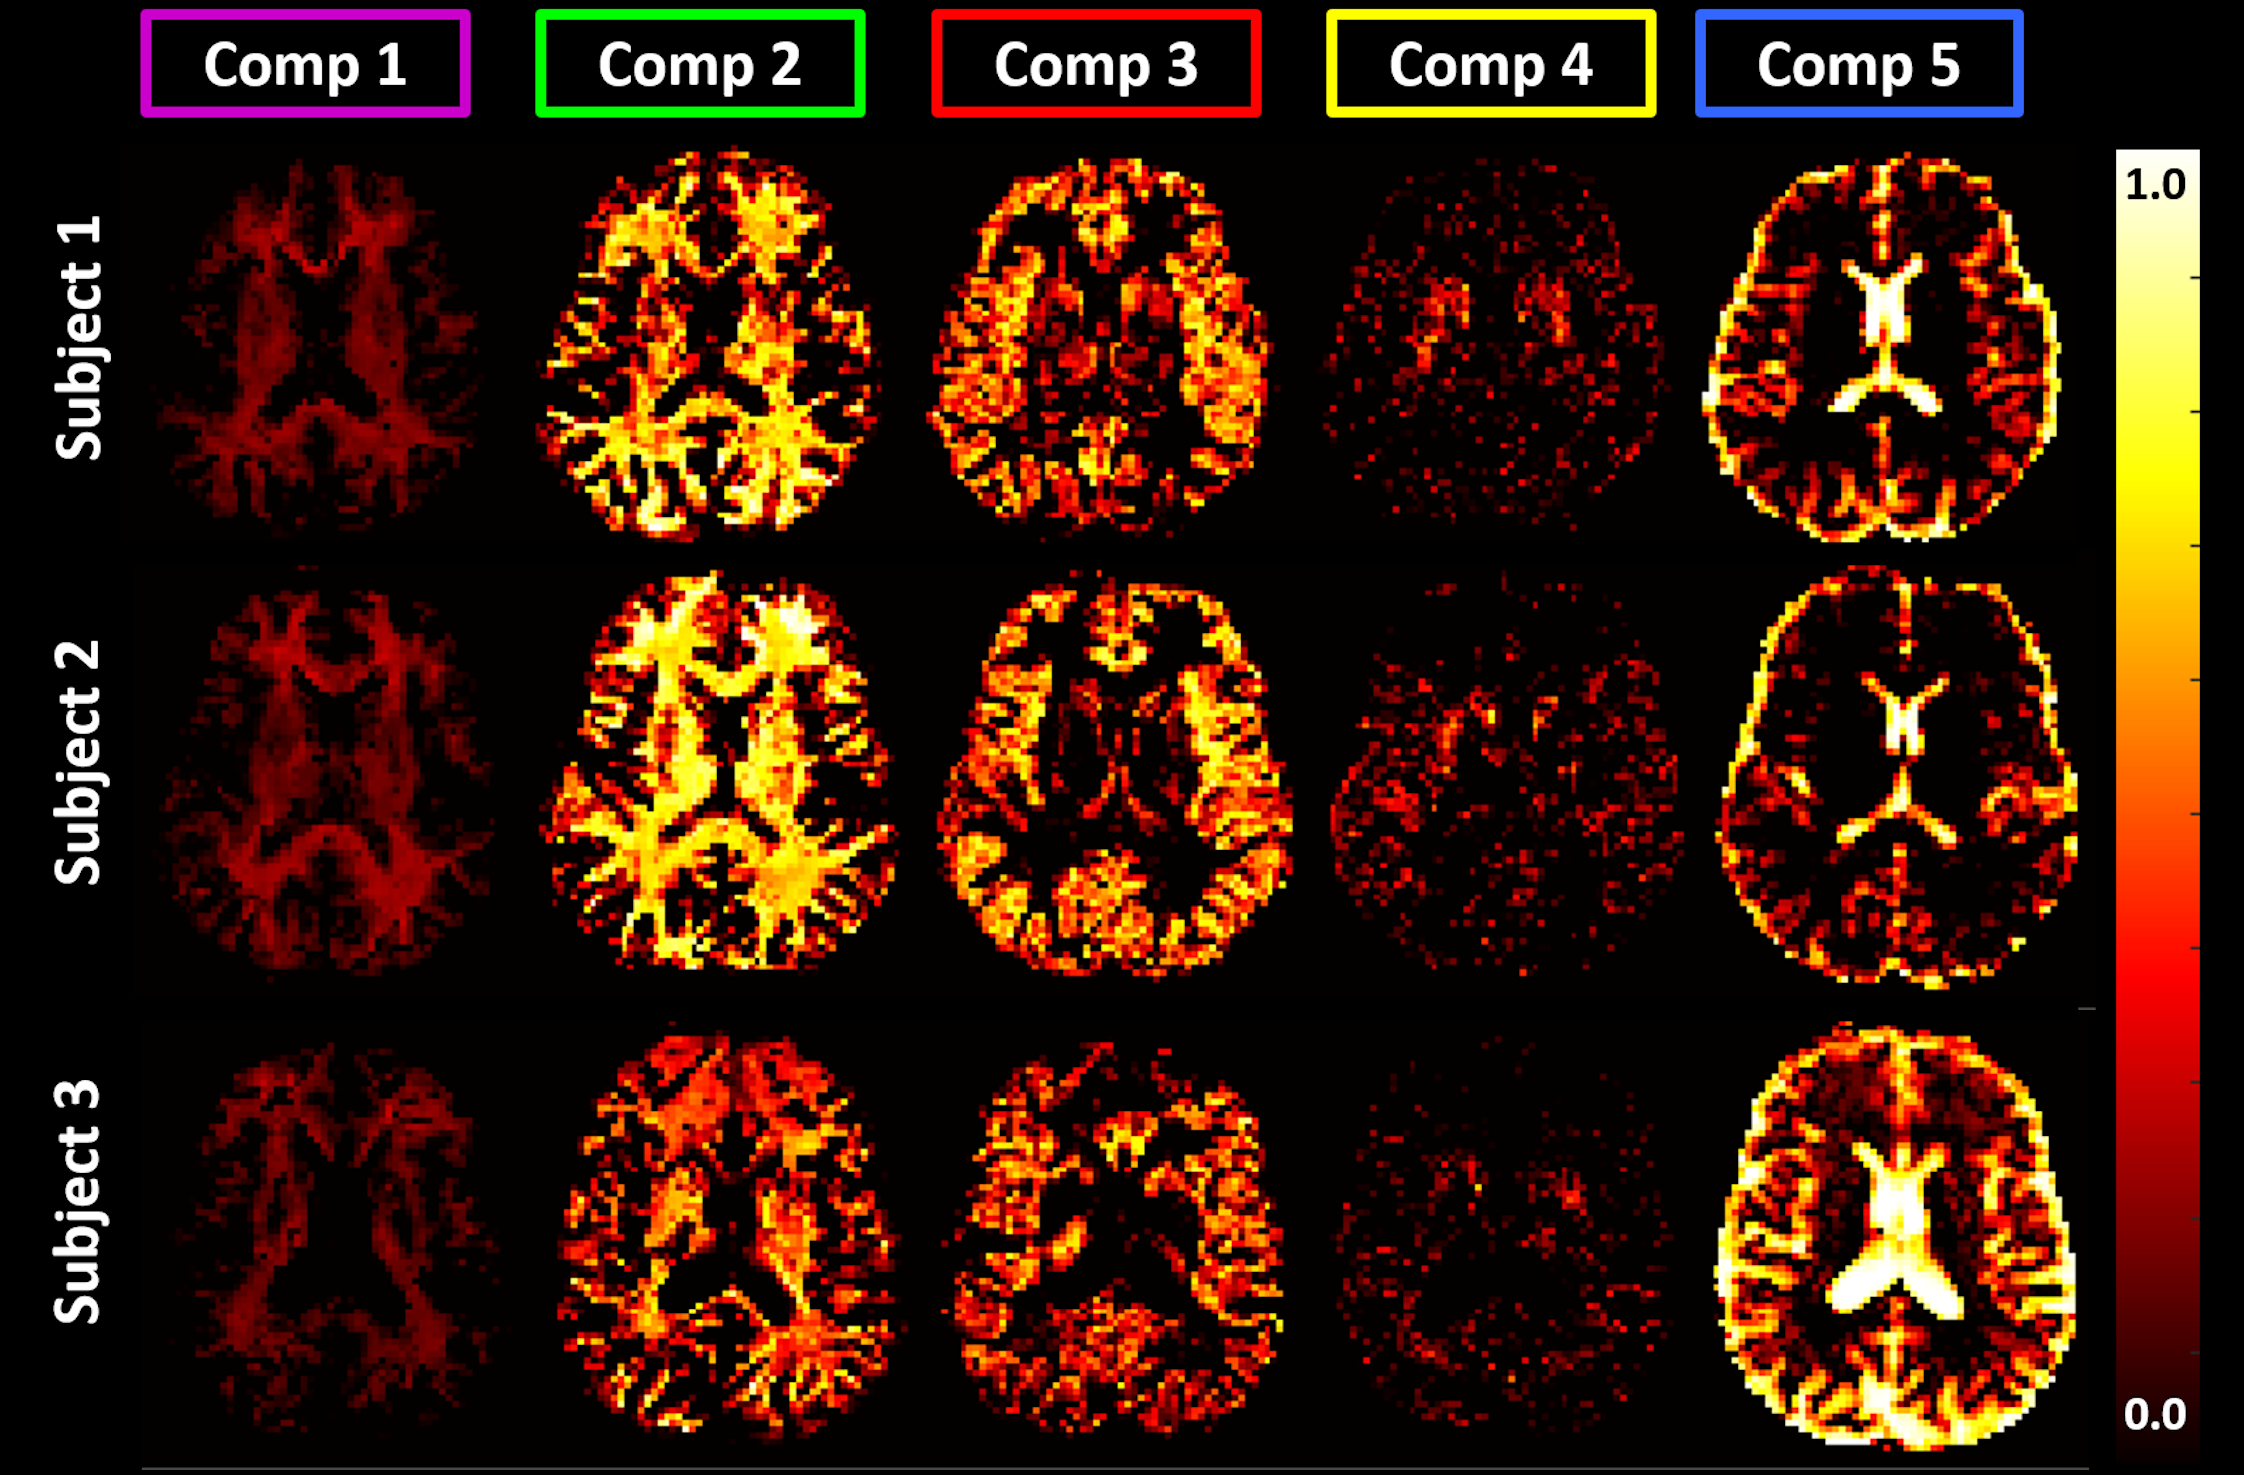
Fig. 2 shows the average estimated T1-MD normalized spectra obtained from 500 simulated noisy measurements with various SNR levels and demonstrate that reconstructed spectra provide good separation discrimination of multiple peaks over a wide range of SNR levels. Maps of T1-MD spectra obtained in a phantom show relatively small biases on the peak locations of the reconstructed spectra due to imaging artifacts (Fig. 3).IR-IDE MRIs showed good SNR throughout the brain. The tissue-dependence of the measured η suggest that magnetization transfer may contribute significantly to the available longitudinal magnetization at excitation, potentially affecting T1 quantitation, in agreement with the previous studies2. The T1-MD spectra (and corresponding marginal 1D spectra) allowed good separation of CSF and parenchymal spectral components (Fig. 4). We found single-peak spectra in GM and BG, with BG having slightly lower diffusivity. Meanwhile, in WM we found two peaks: a larger, broad peak centered around T1=1.3s and with a broader range of MD values, and a smaller peak (~10%) with T1 values between 150-350ms. The short-T1 peak likely reflects the indirect contribution from myelin water via magnetization transfer and chemical exchange. Specific signal components derived by integrating T1-MD spectral bands were consistent across the three volunteers (Fig. 5).
Discussion
The quantitation of T1 properties can be biased by magnetization transfer and cross-relaxation or chemical exchange. In high SNR MRIs, imaging artifacts such as ghosting, Gibbs ringing, or motion-induced partial volume inconsistencies can rise above the noise level, potentially biases the spectral estimation. In addition, the accuracy of MD encoding may be affected by concomitant gradient fields, gradient eddy currents, gradient nonlinearities, and magnetic field inhomogeneities.Nevertheless, the signal representation in T1-MD CS-MRI allows for arbitrary subvoxel heterogeneity and may detect subtle changes in T1-MD properties occurring during disease. Understanding the subvoxel landscape of joint T1-diffusion properties may help isolate spectral components most relevant for diagnosing and characterizing a wide range of pathologies.
Acknowledgements
This work was supported by the NIH BRAIN Initiative grants R24-MH-109068-01 and U01-EB-026996, the Intramural Research Program (IRP) of the Eunice Kennedy Shriver National Institute of Child Health and Human Development (NICHD), the National Institute of Biomedical Imaging and Bioengineering (NIBIB) within the National Institutes of Health (NIH) and the Center for Neuroscience and Regenerative Medicine (CNRM) under the auspices of the Henry Jackson Foundation (HJF).
References
1. Mackay, A. et al. In vivo visualization of myelin water in brain by magnetic resonance. Magnetic resonance in medicine 31, 673-677 (1994).
2. Labadie, C. et al. Myelin water mapping by spatially regularized longitudinal relaxographic imaging at high magnetic fields. Magnetic Resonance in Medicine 71, 375-387, doi:10.1002/mrm.24670 (2014).
3. Avram, A. V., Sarlls, J. E. & Basser, P. J. Measuring non-parametric distributions of intravoxel mean diffusivities using a clinical MRI scanner. NeuroImage 185, 255-262, doi:10.1016/j.neuroimage.2018.10.030 (2019).
4. Hürlimann, M. & Venkataramanan, L. Quantitative measurement of two-dimensional distribution functions of diffusion and relaxation in grossly inhomogeneous fields. Journal of Magnetic Resonance 157, 31-42 (2002).
5. Hürlimann, M. et al. Diffusion-relaxation distribution functions of sedimentary rocks in different saturation states. Magnetic resonance imaging 21, 305-310 (2003).
6. Does, M. D. & Gore, J. C. Compartmental study of T1 and T2 in rat brain and trigeminal nerve in vivo. Magnetic Resonance in Medicine: An Official Journal of the International Society for Magnetic Resonance in Medicine 47, 274-283 (2002).
7. Travis, A. R. & Does, M. D. Selective excitation of myelin water using inversion–recovery‐based preparations. Magnetic Resonance in Medicine: An Official Journal of the International Society for Magnetic Resonance in Medicine 54, 743-747 (2005).
8. English, A., Whittall, K., Joy, M. & Henkelman, R. Quantitative two‐dimensional time correlation relaxometry. Magnetic resonance in medicine 22, 425-434 (1991).
9. Benjamini, D. & Basser, P. J. Magnetic resonance microdynamic imaging reveals distinct tissue microenvironments. NeuroImage 163, 183-196, doi:https://doi.org/10.1016/j.neuroimage.2017.09.033 (2017).
10. Kim, D., Doyle, E. K., Wisnowski, J. L., Kim, J. H. & Haldar, J. P. Diffusion-relaxation correlation spectroscopic imaging: A multidimensional approach for probing microstructure. Magnetic Resonance in Medicine 78, 2236-2249, doi:10.1002/mrm.26629 (2017).
11. Kim, D., Wisnowski, J. L., Nguyen, C. T. & Haldar, J. P. Multidimensional correlation spectroscopic imaging of exponential decays: From theoretical principles to in vivo human applications. NMR in Biomedicine, e4244 (2020).
12. Hutter, J. et al. Integrated and efficient diffusion-relaxometry using ZEBRA. Scientific reports 8, 15138 (2018).
13. Kim, D., Wisnowski, J. L., Nguyen, C. T. & Haldar, J. P. Multidimensional Correlation Spectroscopic Imaging of Exponential Decays: From Theoretical Principles to In Vivo Human Applications. NMR in Biomedicine (2020): e4244
14. Slator, P. J. et al. Combined diffusion-relaxometry MRI to identify dysfunction in the human placenta. Magnetic Resonance in Medicine 82, 95-106, doi:10.1002/mrm.27733 (2019).
15. Park, H. W., Cho, M. H. & Cho, Z. H. Time-Multiplexed Multislice Inversion-Recovery Techniques for NMR Imaging. Magnetic Resonance in Medicine 2, 534-539, doi:10.1002/mrm.1910020604 (1985).
16. Bakker, C., De Graaf, C. & Van Dijk, P. Restoration of signal polarity in a set of inversion recovery NMR images. IEEE transactions on medical imaging 3, 197-202 (1984).
17. Pierpaoli, C., Sarlls, J., Nevo, U., Basser, P. J. & Horkay, F. Polyvinylpyrrolidone (PVP) water solutions as isotropic phantoms for diffusion MRI studies. Proceedings of the 8th Annual Meeting of ISMRM (2009).
Figures
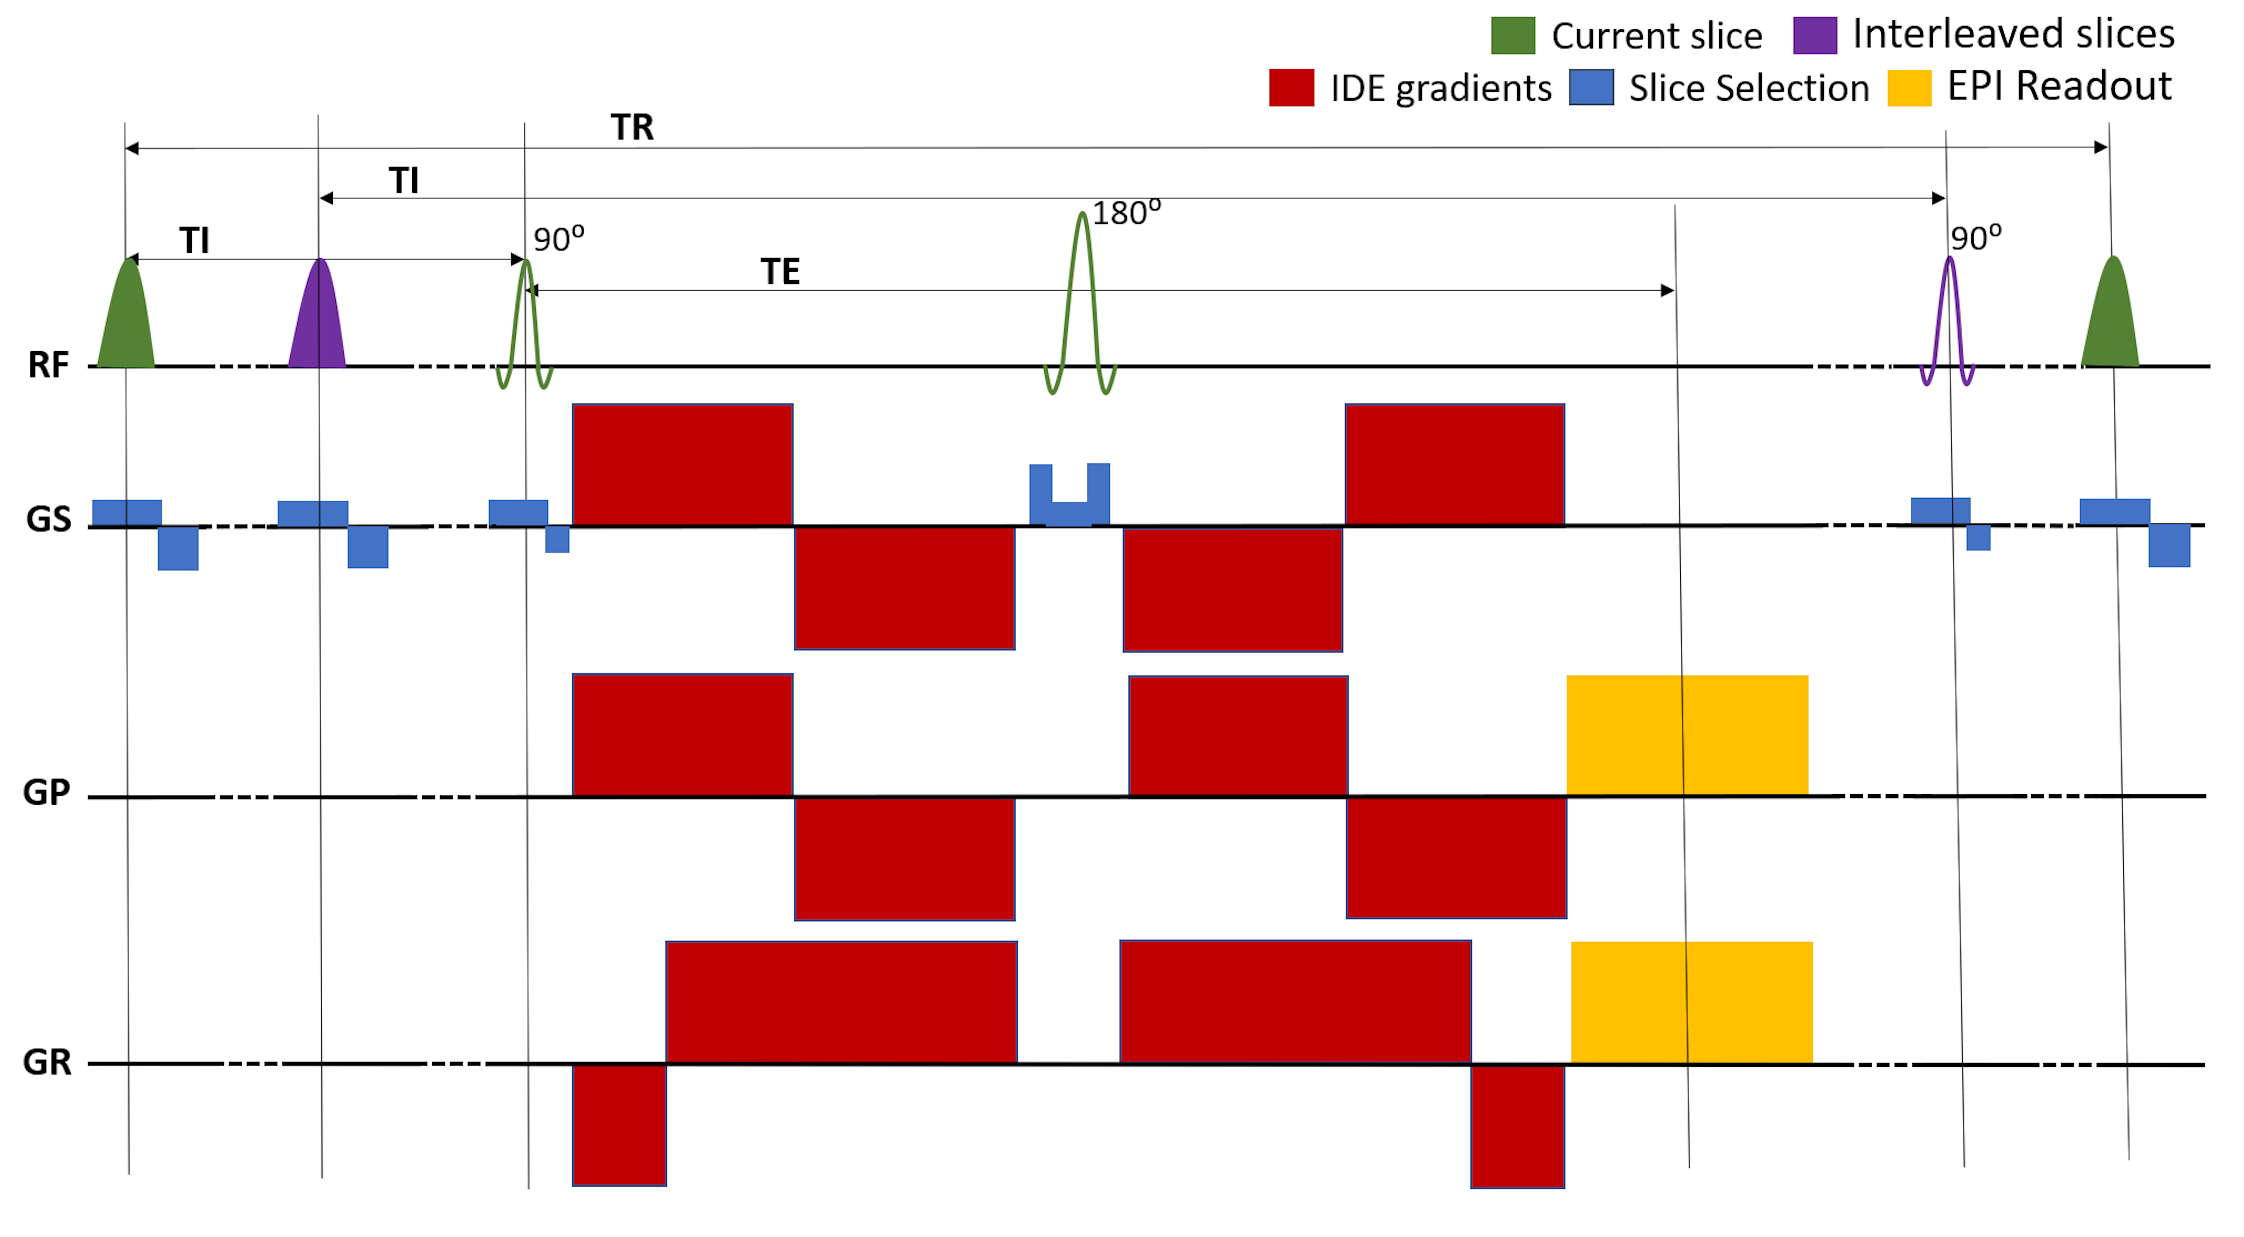
Figure 1: Pulse sequence diagram for multi-slice imaging with integrated inversion recovery (IR) and isotropic diffusion encoding (IDE)3 preparations. The slice-selective IR preparations and EPI acquisitions are interleaved so as to maintain the same TI and TR, i.e., T1-weighting, for each slice. The experiment consists of several repeated spin-echo IR scans, each with a different T1-weighting. In each scan, IR-IDE DWIs are acquired in successive TRs using different b-values. Different b-values were obtained by scaling the amplitudes of the IDE gradient waveforms3.