3057
Simultaneous T1, T2*, and Apparent Diffusion Coefficient Mapping with Stimulated Multi-Echo-Train EPI1Center for MR Research, University of Illinois at Chicago, Chicago, IL, United States, 2Department of Bioengineering, University of Illinois at Chicago, Chicago, IL, United States, 3Departments of Radiology and Neurosurgery, University of Illinois at Chicago, Chicago, IL, United States
Synopsis
A growing number of clinical applications rely on quantitative mapping of relaxation times and apparent diffusion coefficient (ADC). In addition, research interest in understanding the interplay between relaxation and diffusion processes is rising. Conventional methods for mapping relaxation and diffusion parameters require separate scans, resulting in not only a long acquisition time but also image co-registration challenges when inter-scan motion is present. We herein report a stimulated multi-echo-train EPI sequence with diffusion-weighting to achieve simultaneous, co-registered T1, T2* and ADC mapping. This technique was implemented at 3T and demonstrated in the brain and the prostate of healthy human subjects.
Introduction
Quantitative mapping of relaxation times and apparent diffusion coefficient (ADC) have been increasingly used in clinical applications, such as synthetic multi-contrast imaging, tumor characterization1, and cardiac imaging2, as well as in research to investigate the interplay between relaxation and diffusion processes3. Although simultaneous multi-parametric mapping can be accomplished using advanced techniques such as MR fingerprinting4, clinical protocols typically rely on separate scans for mapping relaxation times and ADC,5 resulting in not only a long acquisition time but also image co-registration challenges when inter-scan motion is present. Recently, Zhang et al. reported a stimulated echo-based mapping (STEM) technique,6 which allows integrated T1, T2, and ADC mapping using a single sequence. To produce the multi-parametric maps, the sequence must step through multiple mixing times (TMs), TEs, and b-values in different TRs. In addition, STEM did not include T2* mapping, which can be important when studying iron content, blood oxygenation, and other tissue properties. In this study, we incorporated multiple echo planar imaging (EPI) readouts into a diffusion-weighted STEAM sequence to add T2* mapping to the STEM arsenal without increasing the number of TRs. We demonstrated this technique in the brain and the prostate of healthy human subjects.Methods
Pulse sequence design: The stimulated multi-echo-train EPI sequence (Figure 1) is based on a diffusion-weighted (DW) stimulated echo, and employs multiple EPI echo-train readouts at and after the peak of the stimulated echo. Each echo train corresponds to a different effective TE during the T2*-decay process, where effective TE was defined as the TE when k-space center is sampled. A collection of these echo trains (e.g., 3) was used to estimate T2* values. To ensure that k-space was traversed repeatedly across the different EPI readout trains, a large phase-encoding gradient blip was placed in-between two adjacent readout trains to reset the k-space start point. In addition to T2* mapping, the stimulated multi-echo-train EPI sequence is also capable of producing T1, T2, and ADC maps by varying TM, TE1, and b-values, respectively, as described by Zhang et al.6 and shown in Figure 1.Data acquisition: The DW stimulated multi-echo-EPI sequence was implemented on a GE MR750 3T scanner and used to image the brain and prostate of healthy human subjects. For the brain, axial images were acquired using an 8-channel head coil with the following parameters: TR = 4000ms, TM = [100, 300, 600]ms, TE = [47.0, 70.8, 94.6]ms, b-valueNEX = [02, 5004, and 10008]s/mm2, diffusion gradient direction = right/left, FOV = 180×180 mm2, slice thickness = 4mm, matrix size = 128×128, acceleration factor = 2, and scan time = 2min and 48s. For the prostate, a 32-channel cardiac coil was employed with the similar parameters to those in the brain scan except for: TM = [100, 300, 500]ms, TE = [45.0, 63.2, 81.4]ms, b-valueNEX = [08, 3008 and 7508]s/mm2, FOV = 180×135 mm2, matrix size = 128×96, and scan time = 4min and 48s. Both brain and prostate images were reconstructed offline using custom programs in MATLAB (Mathworks).
Data analysis: The signal (S) from the DW stimulated multi-echo-train EPI sequence can be expressed as: $$S = S_0(1-exp(-{\frac{TR-TM-TE_1/2}{T1}}))exp(-\frac{TM}{T1})exp(-\frac{TE-TE_1}{T2^*})exp(-bADC)$$where S0 is the maximal signal intensity without T1, T2*, and diffusion weightings. T1, T2*, and ADC maps were estimated individually by using an iterative Levenberg-Marquardt non-linear fitting algorithm voxel-by-voxel in MATLAB. Regions of interest (ROIs) were placed in the frontal gray matter (GM) and white matters (WM) of the brain, and the peripheral and transitional zones in the prostate. The mean parameter values and standard deviations within each ROI were evaluated and compared with the literature values.
Results
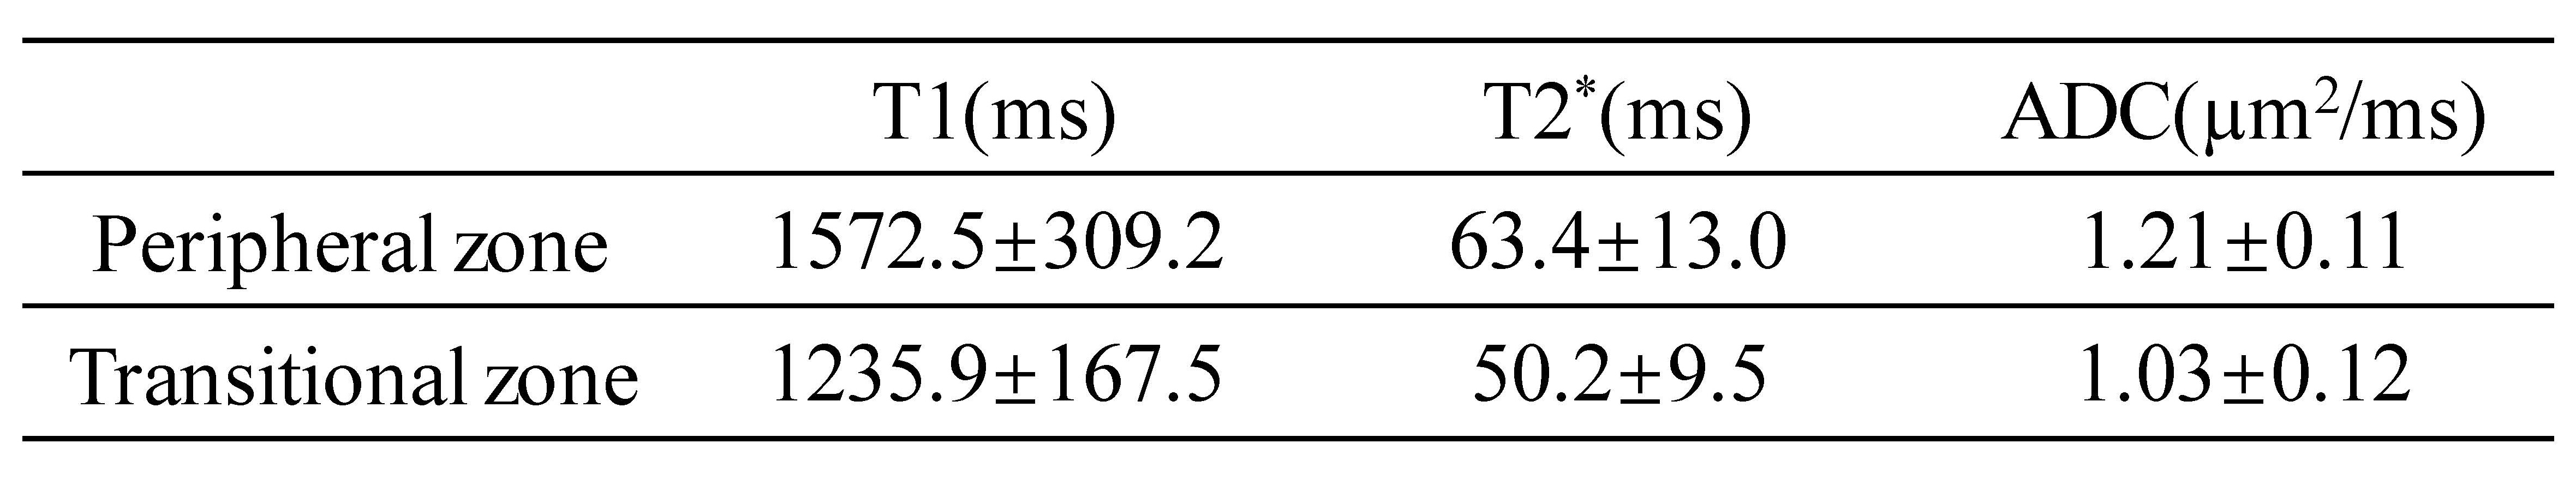
Figure 2a shows brain images acquired at different TMs, TEs, and b-values with good image quality. The T1, T2*, and ADC maps (Figure 2b) exhibited expected image contrasts. The prostate images and the resulting T1, T2*, and ADC maps in Figure 3 showed similar results. Figures 4 and 5 list the ROI-averaged values of T1, T2*, and ADC in the different brain and prostate regions, respectively. For the brain, the GM yielded higher T1, T2*, and ADC values than the WM (1313.6 vs. 829.8ms, 58.8 vs. 54.7ms, 0.78 vs. 0.68µm2/ms, respectively). For the prostate, T1, T2*, and ADC values in the peripheral zone (1572.5ms, 63.4ms, and 1.21µm2/ms) were larger than in the transitional zone (1235.9ms, 50.2ms, and 1.03µm2/ms).Discussion and Conclusion
We developed a stimulated multi-echo-train EPI sequence for simultaneous T1, T2*, and ADC mapping. This development expanded the capability of the STEM technique reported previously.6 The T1 and ADC values in the brain, and T1, T2*, and ADC values in the prostate were in agreement with the literature.6-11 The T2* values of the brain tissue obtained in this study were slightly higher than what have been reported7 (54.7ms vs. 44.7ms in WM, 58.8ms vs. 51.8ms in GM). This difference was likely related to different measurement sequences (i.e., EPI vs. gradient echo). A limitation of the study was that we did not incorporate T2 mapping (by varying TE1 in Figure 1) into the multi-parametric measurement due to scan time considerations. Despite this limitation, our study illustrated an integrated approach to providing multiple relaxation and diffusion parameters that can be explored in future clinical applications.Acknowledgements
This work was supported in part by the National Institutes of Health (5R01EB026716-01 and 1S10RR028898-01). The content is solely the responsibility of the authors and does not necessarily represent the official views of the National Institutes of Health. We thank Dr. Diego Hernando and Yuxin Zhang from University of Wisconsin-Madison for providing the original DW STEAM sequence, Dr. Arnaud Guidon from GE Healthcare for pulse sequence collaboration, and Drs. Zheng Zhong and Muge Karaman for helpful discussions.References
[1] Wang HJ, Pui MH, Guo Y, et al. Multiparametric 3-T MRI for differentiating low-versus high-grade and category T1 versus T2 bladder urothelial carcinoma. Am. J. Roentgenol. 2015;204(2):330-334.
[2] Moulin K, Viallon M, Romero W, et al. MRI of reperfused acute myocardial infarction edema: ADC quantification versus T1 and T2 mapping. Radiology. 2020;295:542-549.
[3] de Almeida Martins JP, Topgaard D. Multidimensional correlation of nuclear relaxation rates and diffusion tensors for model-free investigations of heterogeneous anisotropic porous materials. Scientific Reports. 2018;8(1):1-12.
[4] Ma D, Gulani V, Seiberlich N, et al. Magnetic resonance fingerprinting. Nature. 2013;495(7440):187-192.
[5] Moulin K, Viallon M, Romero W, et al. MRI of reperfused acute myocardial infarction edema: ADC quantification versus T1 and T2 mapping. Radiology. 2020;295:542-549.
[6] Zhang Y, Wells SA, Hernando D. Stimulated echo based mapping (STEM) of T1, T2, and apparent diffusion coefficient: validation and protocol optimization. Magn. Reson. Med. 2019;81:167-181.
[7] Wansapura JP, Holland SK, Dunn RS, et al. NMR relaxation times in the human brain at 3.0 tesla. J. Magn. Reason. Imaging. 1999;9(4):531-538.
[8] Baur AD, Hansen CM, Rogasch J, et al. Evaluation of T1 relaxation time in prostate cancer and benign prostate tissue using a Modified Look-Locker inversion recovery sequence. Sci. Rep. 2020;10(1):1-8.
[9] Wu LM, Chen XX, Xuan HQ, et al. Feasibility and preliminary experience of quantitative T2* mapping at 3.0 T for detection and assessment of aggressiveness of prostate cancer. Acad. Radiol. 2014;21(8):1020-1026.
[10] Xin JY, Gao SS, Liu JG, et al. The value of ESWAN in diagnosis and differential diagnosis of prostate cancer: Preliminary study. Magn. Reason. Imaging. 2017;44:26-31.
[11] Cihangiroglu M, Uluğ AM, Firat Z, et al. High b-value diffusion-weighted MR imaging of normal brain at 3 T. Eur. J. Radiol. 2009;69(3):454-458.
Figures