3055
Optimization of fast Quantitative Multiparameter Mapping (MPM) at 7T using parallel transmission1German Centre for Neurodegenerative Diseases (DZNE), Bonn, Germany, 2Department of Physics and Astronomy, University of Bonn, Bonn, Germany
Synopsis
We propose a fast MPM protocol at 7T using skipped-CAIPI 3D-EPI with simple PTx water-excitation based on 3 kT-points. By comparison to corresponding CP mode scans, the 3 kT-points excitation mainly improves the B1+ field homogeneity in the Cerebellum. Using MPM B1+ field correction, this simple improvement is sufficient to achieve good and homogeneous T1, PD and T2* estimates throughout the brain. However, the lack of MT homogenization still results in the inadequate MTsat CNR. By combining MPM with EPI and PTx, we obtained quantitative whole-brain parameter maps of high quality, except for Cerebellar MTsat within 3 minutes scan time.
Introduction
Recently, following a fast multiparameter mapping (MPM) implementation at 3T1, a corresponding protocol at 7T was proposed2 using 3D-EPI with segmented CAIPIRINHA (skipped-CAIPI) sampling3. In this work we propose to overcome a critical part of the remaining challenges of the previous work by utilizing water-selective kT-points pulses4.Methods
All data were acquired on a Siemens MAGNETOM 7T Plus scanner using 32-channel head receive coil and 8-channel transmit array. One set of 3D-EPI T1w, PDw and MTw images was acquired at 4 equidistant TEs between 4.64 and 19.64 ms at 1 mm isotropic resolution. A 20.2x2z1 skipped-CAIPI sampling was employed, resulting in an EPI factor of 4. Repetition time/flip angle were chosen as follows: 27 ms/20° for T1w, 27 ms/3° for PDw,and 45 ms/4° for MTw. A single rectangular RF pulse with long duration (1.0 ms) was used for simple fat suppression using traditional circularly polarized excitation5. The corresponding PTx scans were acquired using 3 kT-points RF excitation pulses with the same nominal flip angles. Each sub-pulse also had 1.0 ms duration for fat suppression as previously used for fMRI4. Both CP and PTx MTw scans used the same Gaussian-shaped CP mode RF pulse applied prior to each excitation.In order to keep the specific absorption rate (SAR) within the safety limits, the nominal MT flip angle had to be reduced from 320° in the CP mode MTw scan to 260° in the PTx-MTw scan. A second PTx-MTw scan was acquired with prolonged TR (74 ms) to achieve the same 320° nominal MT flip angle within SAR limits. The total acquisition time of the CP mode MPM scans and the PTx MPM scans (incl. both MTw scans) were 2:59 and 5:05, respectively. All imaging parameters are summarized in Tab.1.
Two B1 maps were acquired using the same CP mode and PTx pulses by modifying the 3D-EPI sequence to include two subsequent TRs according to the Actual Flip angle Imaging (AFI) method6 with TR2 = 100 ms/TR1 = 20 ms, nominal flip angle = 50°, 5 mm isotropic resolution, 4.2x2z1 skipped-CAIPI sampling (EPI factor 5), TA = 0:10 for both.
All parameter maps are calculated with the hMRI toolbox7.
Results
Fig.1 shows representative sagittal, coronal and axial slices of all scans at TE = 4.64 ms. In the PDw images, it can be observed that PTx excitation is more homogeneous in the Cerebellum (red arrow). In the T1w images, this shows as an improved WM/GM contrast compared to the CP scan. However the PTx scans have slightly reduced signals above the sphenoid sinus (blue arrow). The different nominal saturation flip angles and TRs resulted in nearly 100% SAR estimation (in “1st level safety mode“).Fig.2 demonstrates the example sagittal slices of distortion corrected MTw image along with MTw scan with uncorrected AP and PA phase encoding. The difference is neglectable, therefore the remaining results are presented for AP phase encoding only.
Fig.3 shows the quantitative parameter maps acquired using CP mode and PTx pulses together with the corresponding B1+ scale maps.
Fig.4 shows the (a) MTsat histogram and bar plots of (b) T2*, (c) PD*, (d) T1 estimates in different regions of interest (ROI) from CP and PTx scans. The smaller error bars of T1 in WM and GM in PTx scans show that the transmit field inhomogeneities could be compensated for in the parameter maps. However, low MT saturation flip angles of all three scans are not adequate to provide enough MT contrast: the low CNR is not sufficient to create clearly separated modes in histogram8. In some ROIs, the T1 estimates of PTx scans are slightly higher than that of CP scans and the literature values.
Discussion
Our study shows that MPM protocol using skipped-CAIPI 3D-EPI with PTx pulses is feasible. The simplest form of water-selective kT-points PTx pulses is utilized in order to reduce the B1+ field inhomogeneity with reasonable pulse prolongation and minimal SAR increase. The PTx pulses achieve improved excitation in specific regions like Cerebellum, which CP mode pulses could not excite sufficiently. With an additionally acquired B1+ map, the remaining transmit field variation was successfully counterbalanced, which was not possible using CP mode pulses. Thus more homogeneous quantitative parameter maps of high-quality can be obtained.Although PTx pulses provide the expected benefits, the acquisition currently suffers from SAR limitations. The MT saturation flip angle had to be reduced at the price of lower CNR. Currently, if MTsat is not required, PTx scans can provide quantitative T1, T2* and PD* maps at 1mm isotropic resolution of high quality within 2 minutes scan time.
In a future study, we will investigate the use of parallel transmit MT pulses, or different CP mode MT saturation, like TIAMO13.
Conclusion
We have presented a fast MPM protocol at 7T using skipped-CAIPI 3D-EPI with simple PTx pulses. This sufficiently improved the CNR of T1w and PDw scans in the Cerebellum, while the MTw scans still suffered from CP mode saturation in the current implementation. With an additional B1+ map acquired, more homogeneous T1, PD* and T2* maps of high-resolution and high-quality can be obtained throughout the brain.Acknowledgements
No acknowledgement found.References
1. Wang D, Stöcker T, Stirnberg R. Fast Quantitative Multiparametric Mapping using 3D-EPI with Segmented CAIPIRINHA Sampling at 3T. In: Proceedings of the international society of magnetic resonance in medicine.; 2020. pp. 4–7.
2. Wang D, Stirnberg R, Stöcker T. Fast high-quality and -resolution multi parameter mapping (MPM) at 7 Tesla using skippedCAIPI 3D-EPI. ESMRMB 2020. pp. 2–4.
3. Stirnberg R, Stöcker T. Segmented K‐space blipped‐controlled aliasing in parallel imaging for high spatiotemporal resolution EPI. Magnetic Resonance in Medicine 2021;85:1540–155.
4. Le Ster C, Moreno A, Mauconduit F, et al. Comparison of SMS-EPI and 3D-EPI at 7T in an fMRI localizer study with matched spatiotemporal resolution and homogenized excitation profiles. PLOS ONE 2019;14:e0225286.
5. Stirnberg R, Brenner D, Stöcker T, Shah NJ. Rapid fat suppression for three-dimensional echo planar imaging with minimized specific absorption rate. Magn. Reson. Med. 2016;76:1517–1523.
6. Yarnykh VL. Actual flip-angle imaging in the pulsed steady state: A method for rapid three-dimensional mapping of the transmitted radiofrequency field. Magnetic Resonance in Medicine 2007;57:192–200.
7. Tabelow K, Balteau E, Ashburner J, et al. hMRI – A toolbox for quantitative MRI in neuroscience and clinical research. Neuroimage 2019;194:191–210.
8. Helms G, Dathe H, Kallenberg K, Dechent P. High-resolution maps of magnetization transfer with inherent correction for RF inhomogeneity and T1 relaxation obtained from 3D FLASH MRI. Magn. Reson. Med. 2008;60:1396–1407.
9. Andersson JLR, Skare S, Ashburner J. How to correct susceptibility distortions in spin-echo echo-planar images: application to diffusion tensor imaging. NeuroImage 2003;20:870–888.
10. Smith SM, Jenkinson M, Woolrich MW, et al. Advances in functional and structural MR image analysis and implementation as FSL. NeuroImage 2004;23:208–219.
11. Peters AM, Brookes MJ, Hoogenraad FG, et al. T2* measurements in human brain at 1.5, 3 and 7 t. Magnetic Resonance Imaging 2007;25:748–753.
12. Rooney WD, Johnson G, Li X, et al. Magnetic field and tissue dependencies of human brain longitudinal 1H2O relaxation in vivo. Magnetic Resonance in Medicine 2007;57:308–318.
13. Orzada S, Maderwald S, Poser BA, Bitz AK, Quick HH, Ladd ME. RF excitation using time interleaved acquisition of modes (TIAMO) to address B1 inhomogeneity in high‐field MRI. Magnetic Resonance in Medicine 2010;64:327–333.
Figures
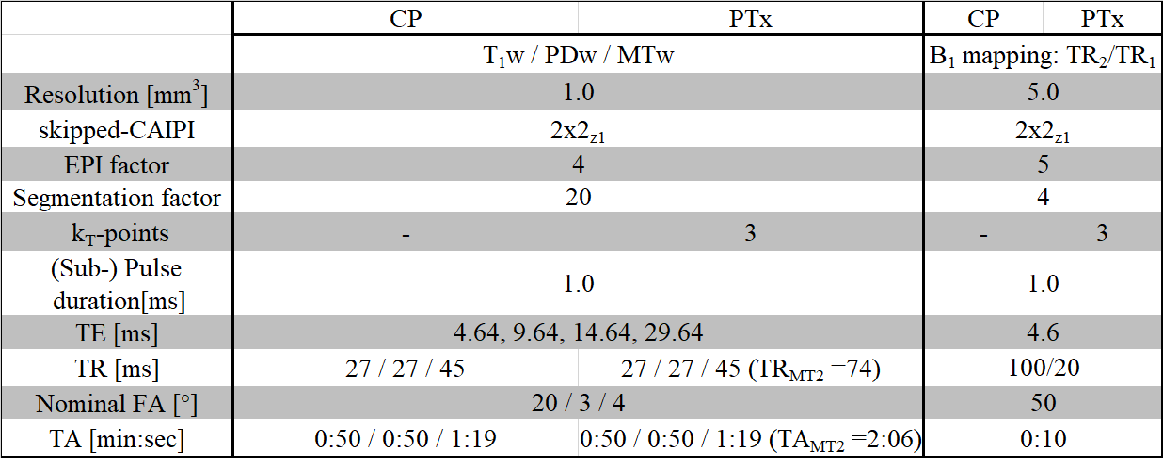
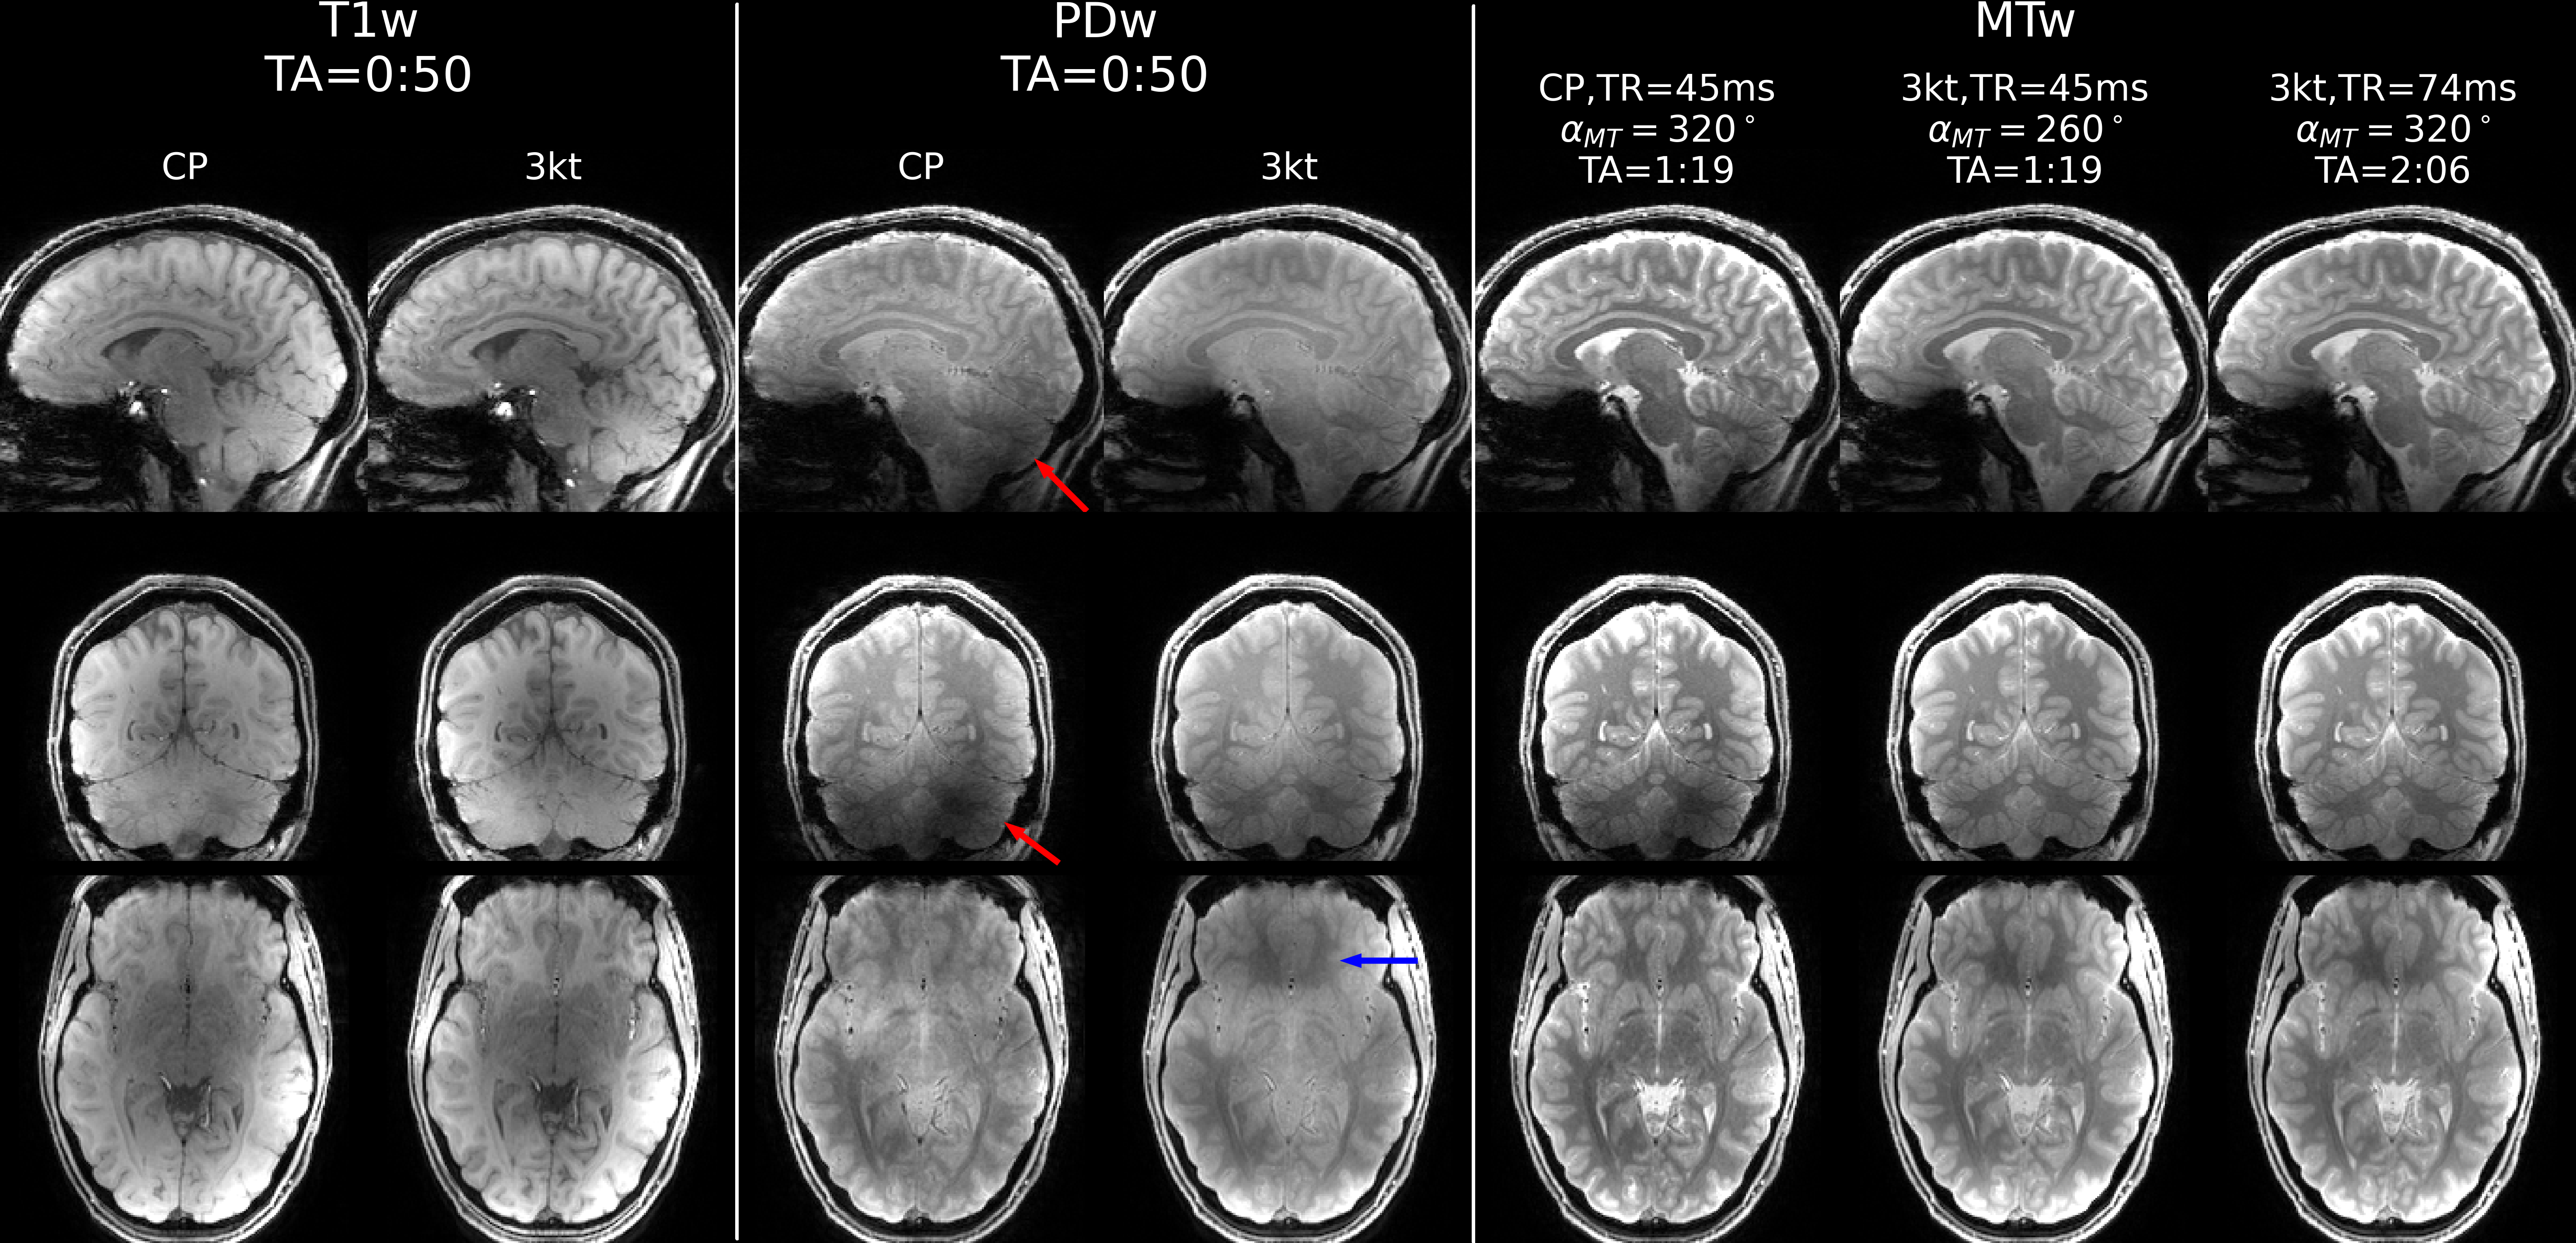
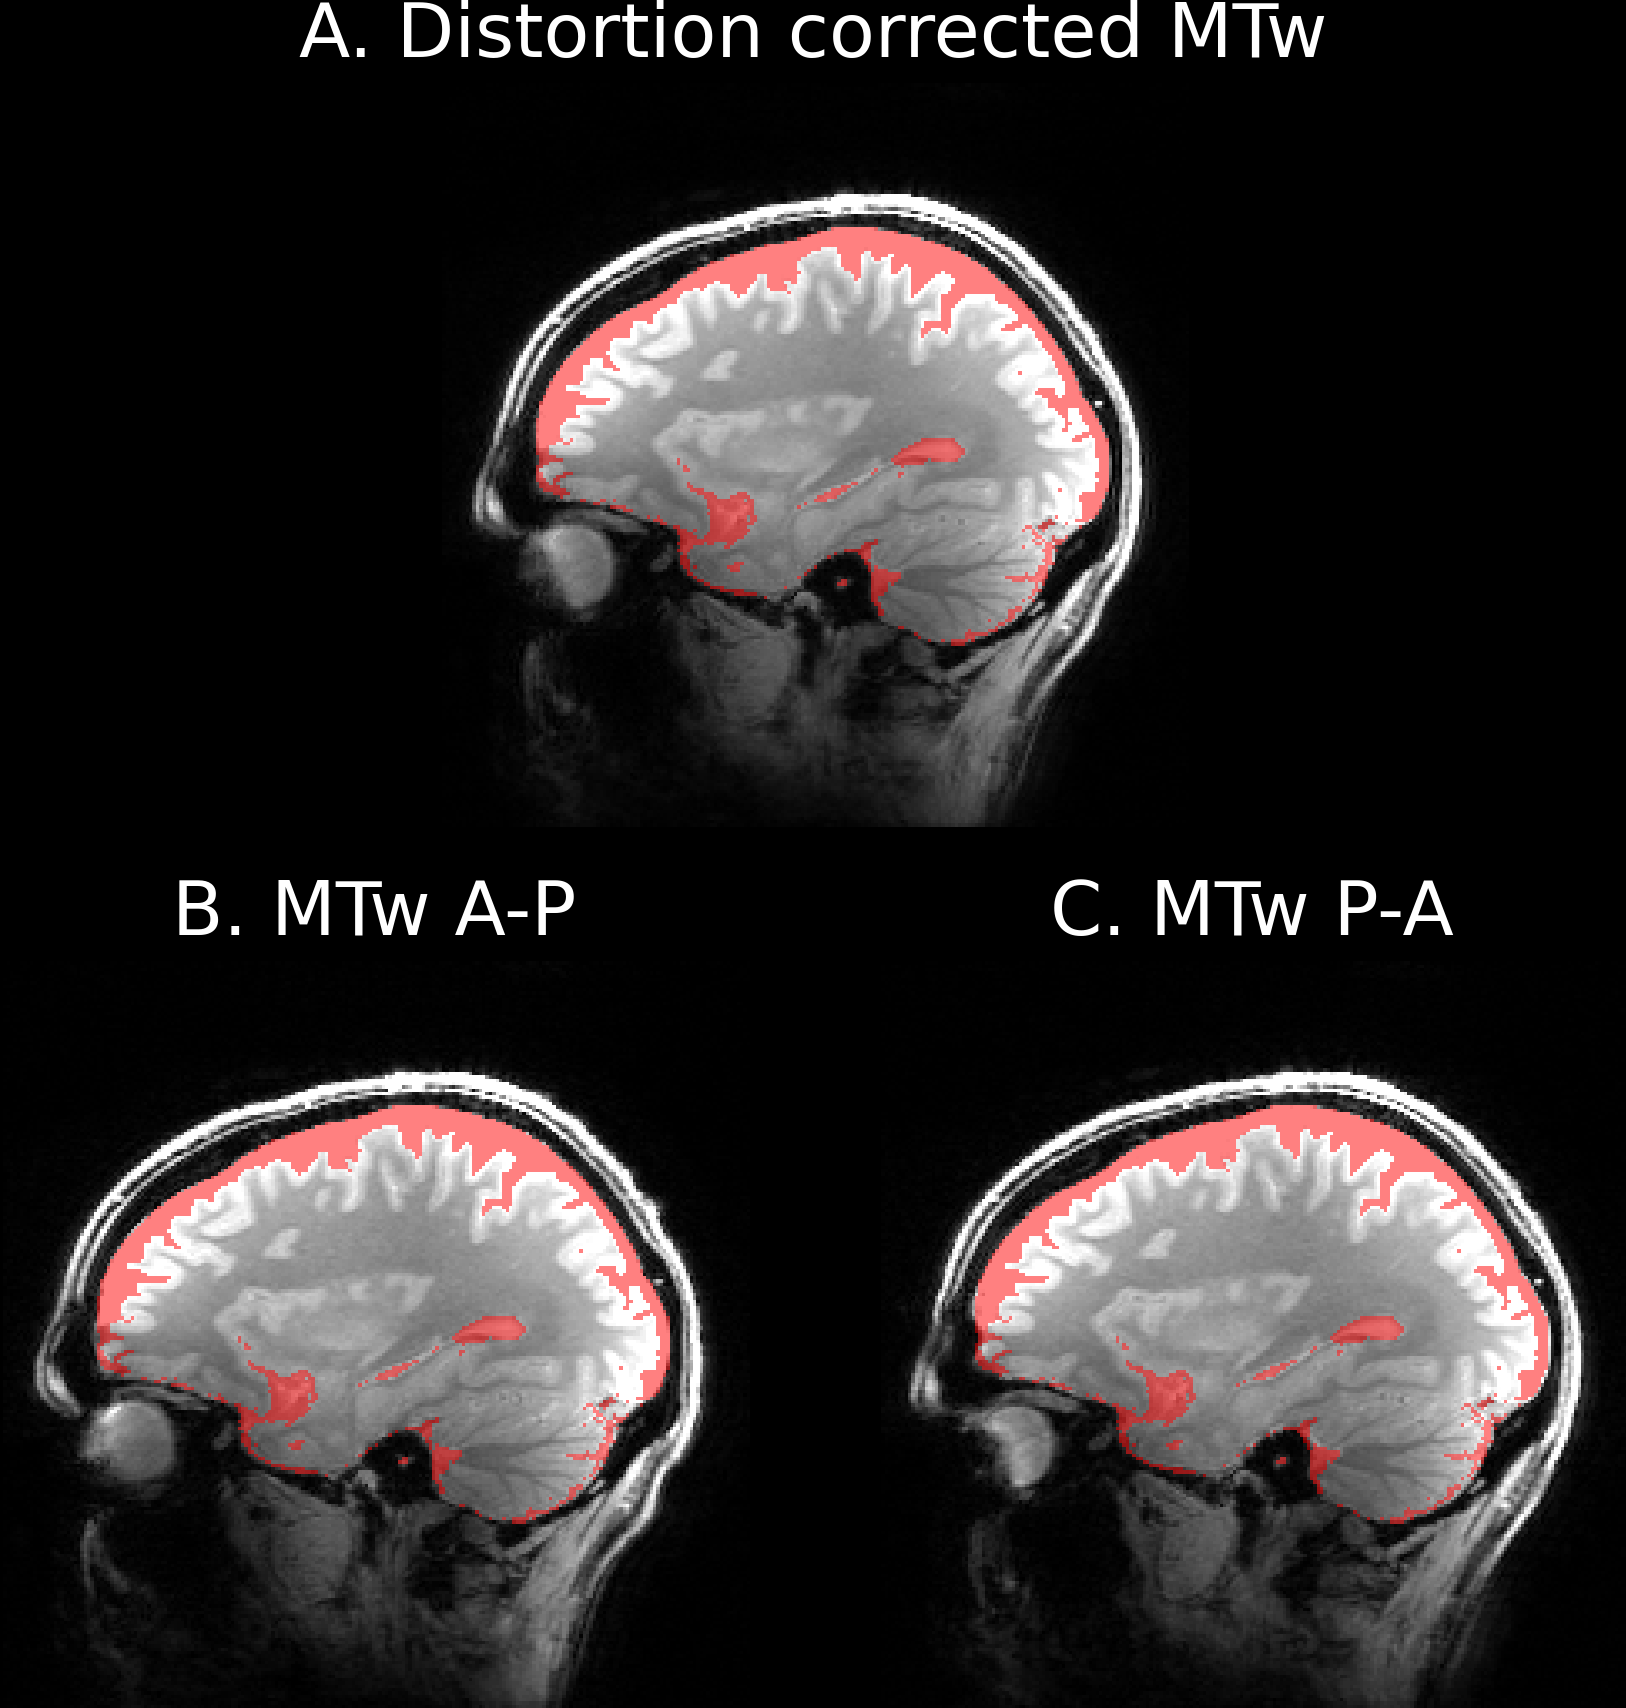
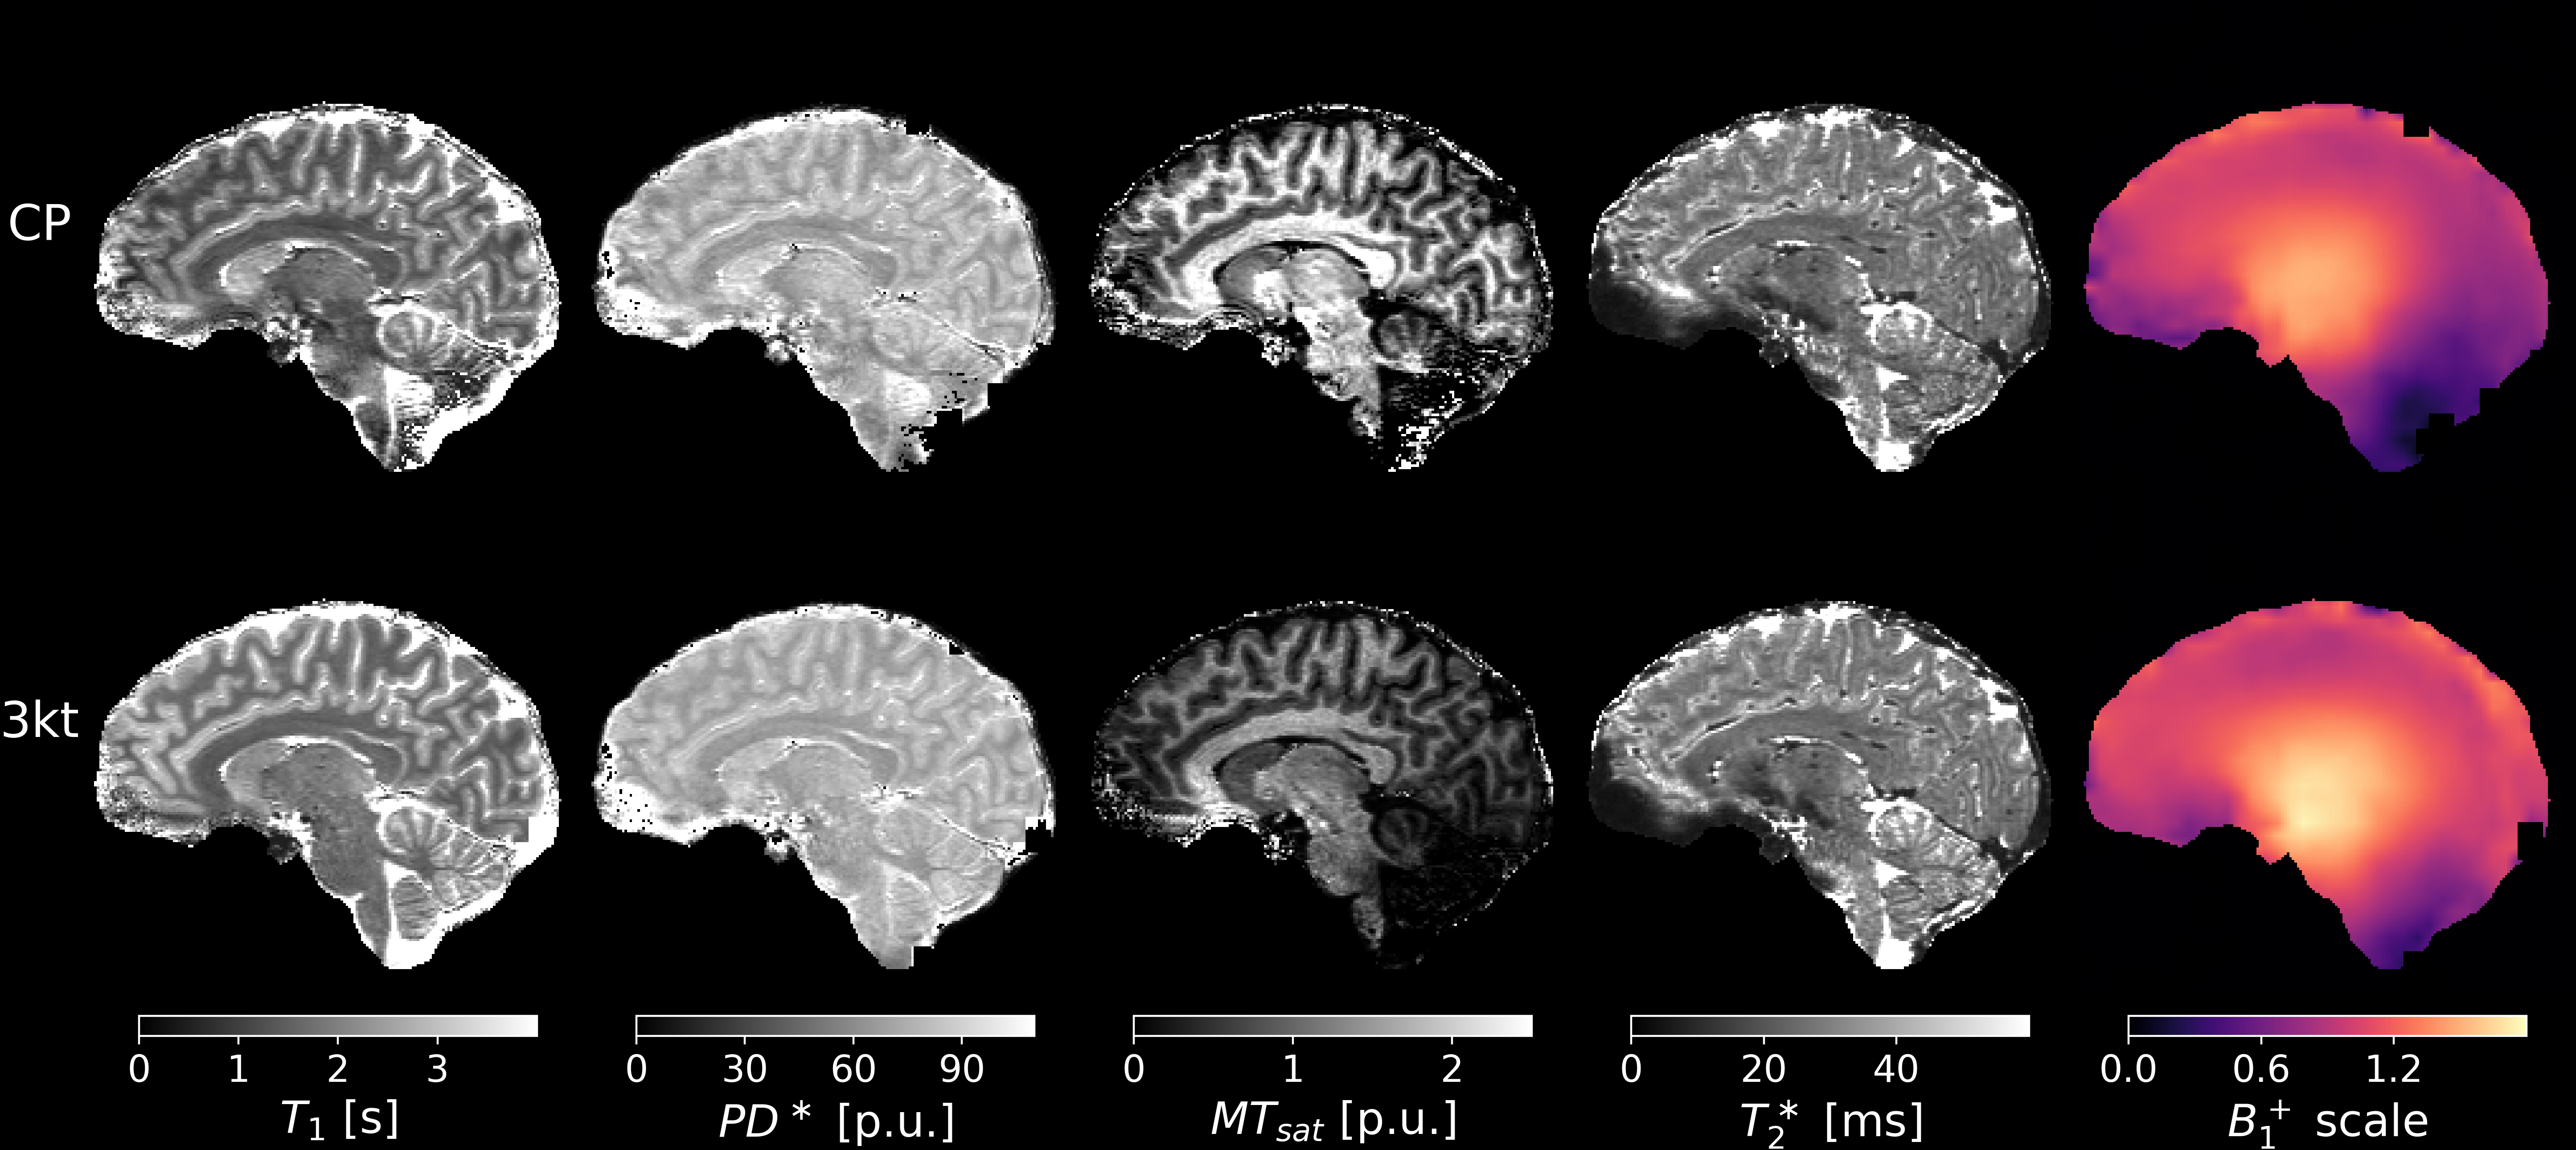
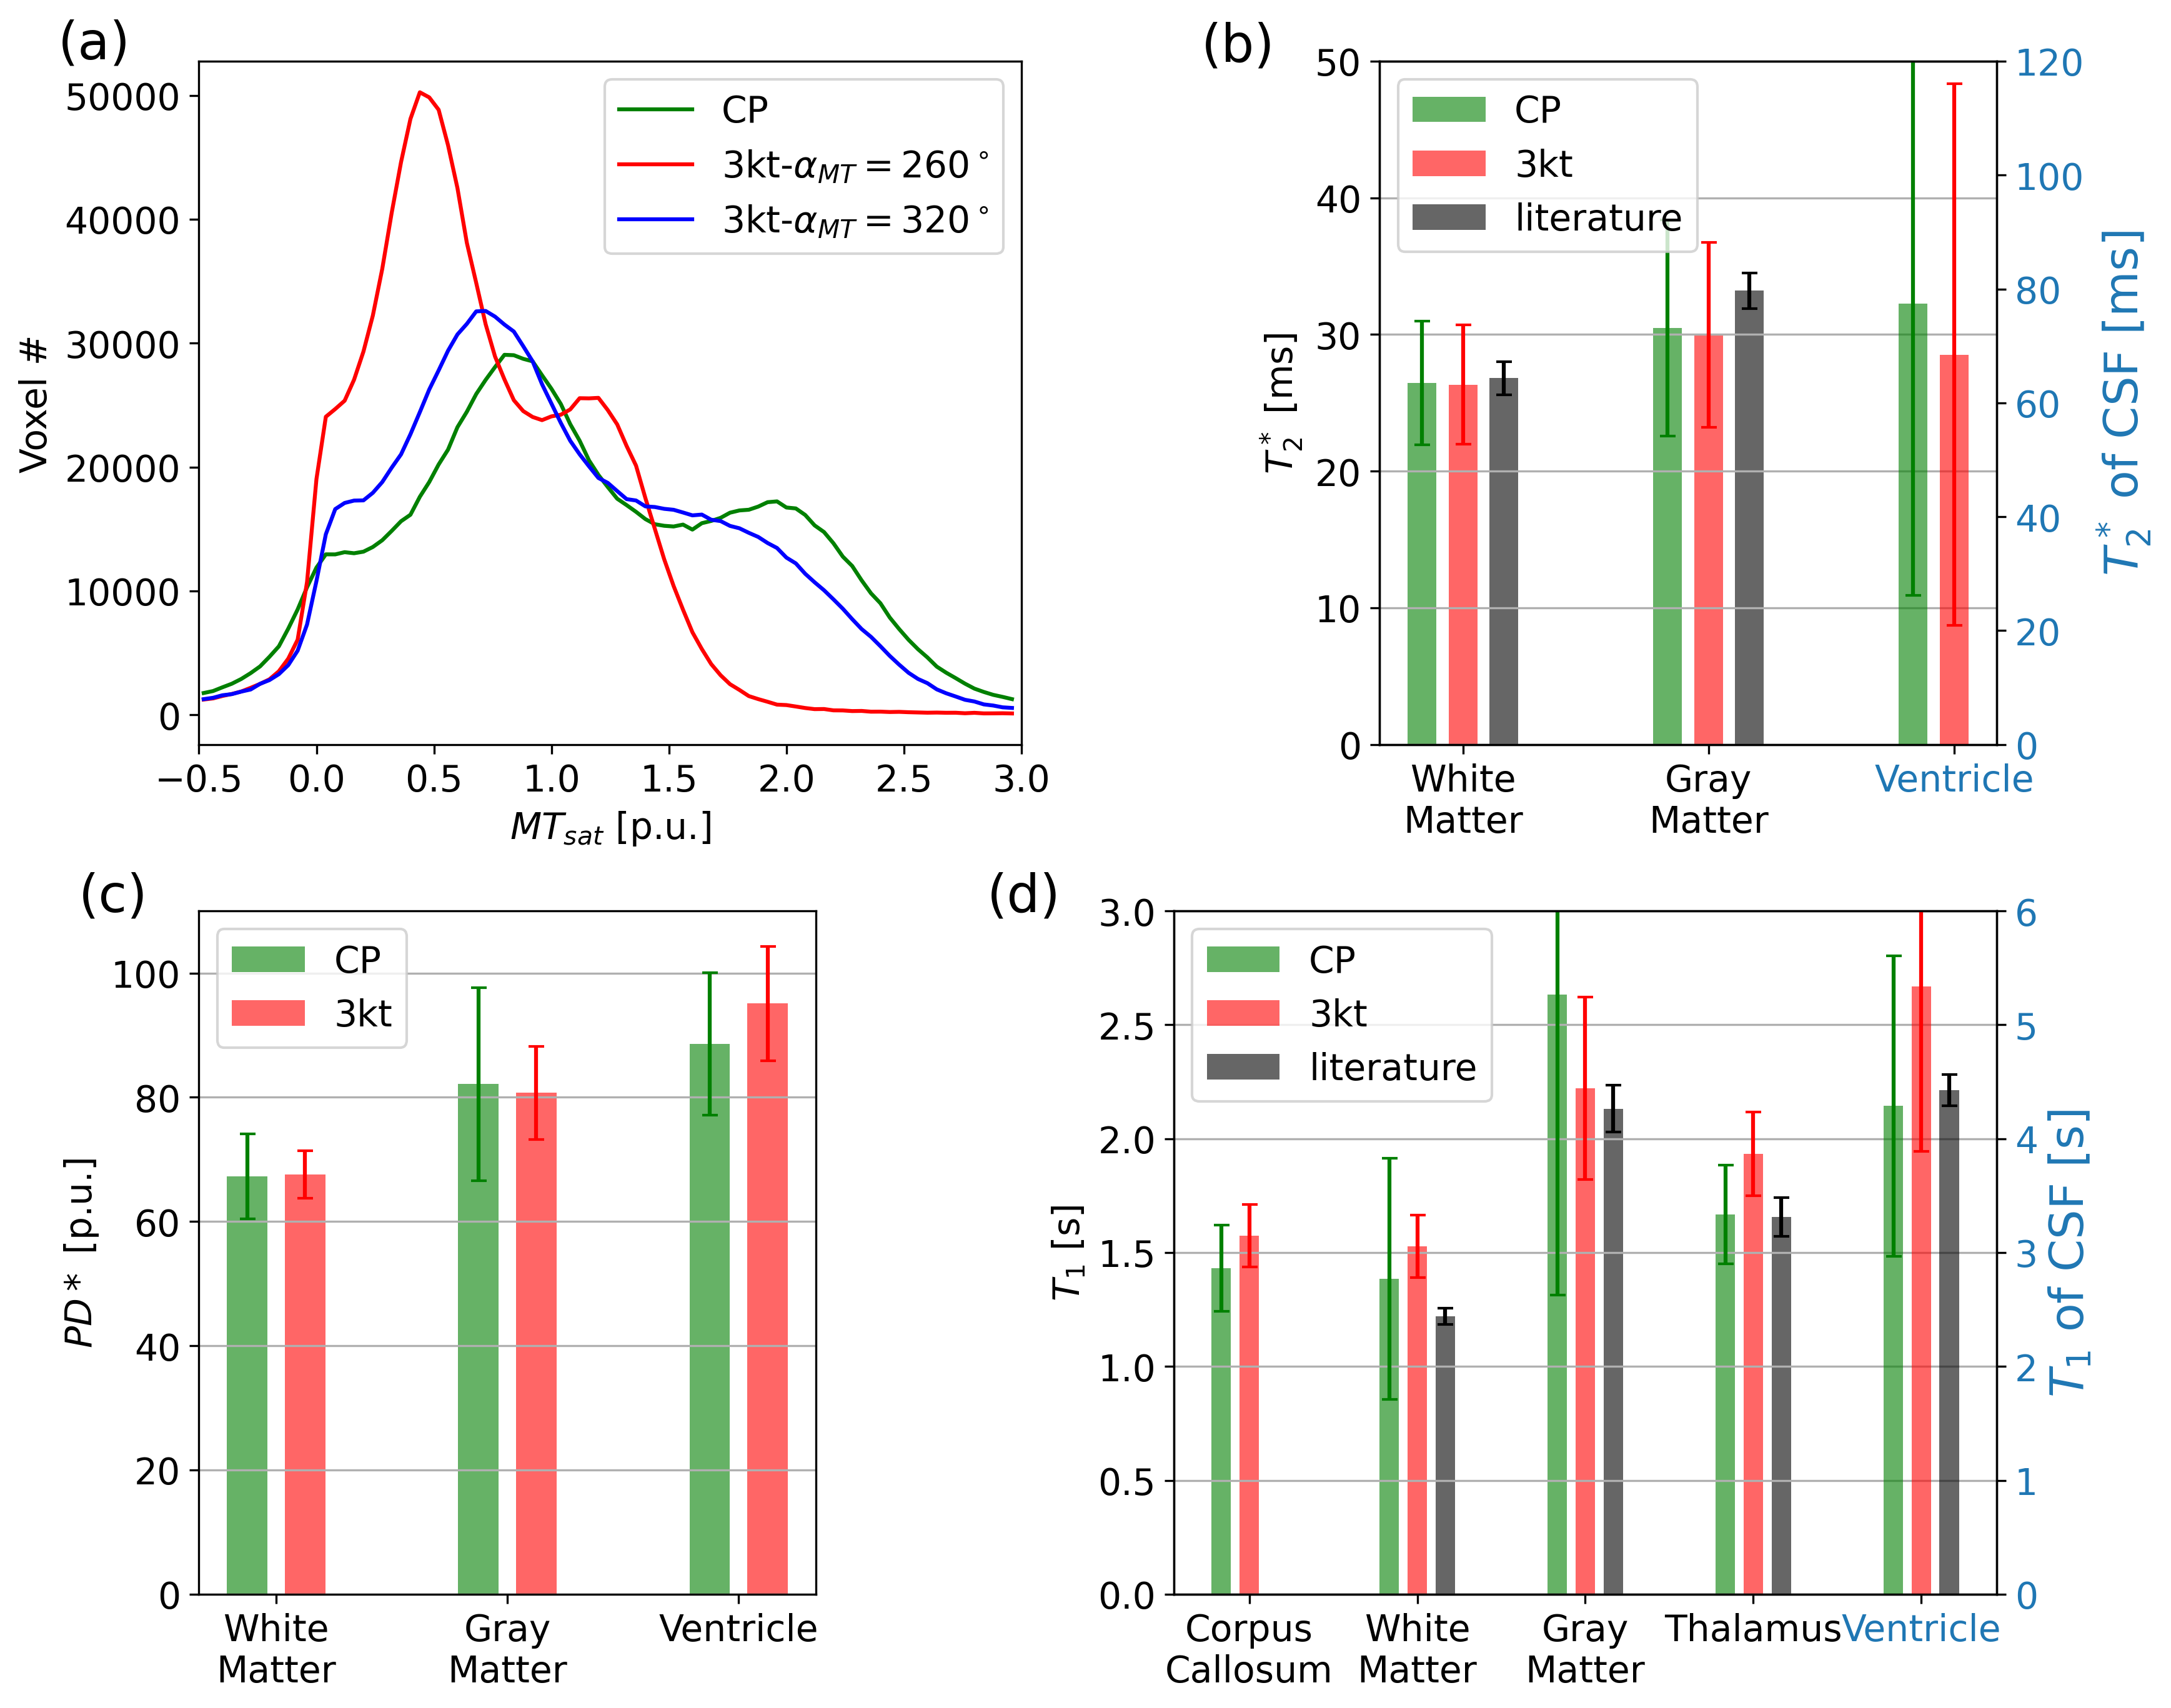
Fig. 4 (a) Whole-brain MTsat histogram with Cerebellum excluded and (b) T2*, (c) PD*, (d) T1 estimates in different ROIs. The T2* literature values are taken from (11) and the T1 literature values are taken from (12). The bars of CSF in (b) and (d) refer to the second vertical axis. The TR/nominal MT saturation flip angle were 45 ms/260° (red line) and 74 ms/320° (blue line) in the histogram. The low MT saturation flip angle (260°) is not sufficient to provide enough saturation effect to clearly separate different modes for CSF, WM and GM.