3054
Two multi-echo SPGR acquisitions for the simultaneous generation of SWI, qT1 and other parametric maps: preliminary data1Institute of Medical Science, University of Toronto, Toronto, ON, Canada, 2Brain Health Imaging Centre - MRI, Centre for Addiction and Mental Health, Toronto, ON, Canada, 3Department of Neuroimaging, King's College London, London, United Kingdom
Synopsis
Multi-parametric mapping is often conducted using multiple separate scans, leading to errors in registration and long scan times. Multi-echo complex data was acquired for two flip angles, with a total scan time of 11 minutes at high resolution. Optimized processing allowed for the generation of high resolution qT1, R2*, QSM, SWI and B0 maps in the same space. The use of all echoes in processing, as well as long maximum TE allows for improvements in image quality. Future studies will investigate optimizing phase processing to further improve image quality while decreasing scan time.
Body of Abstract
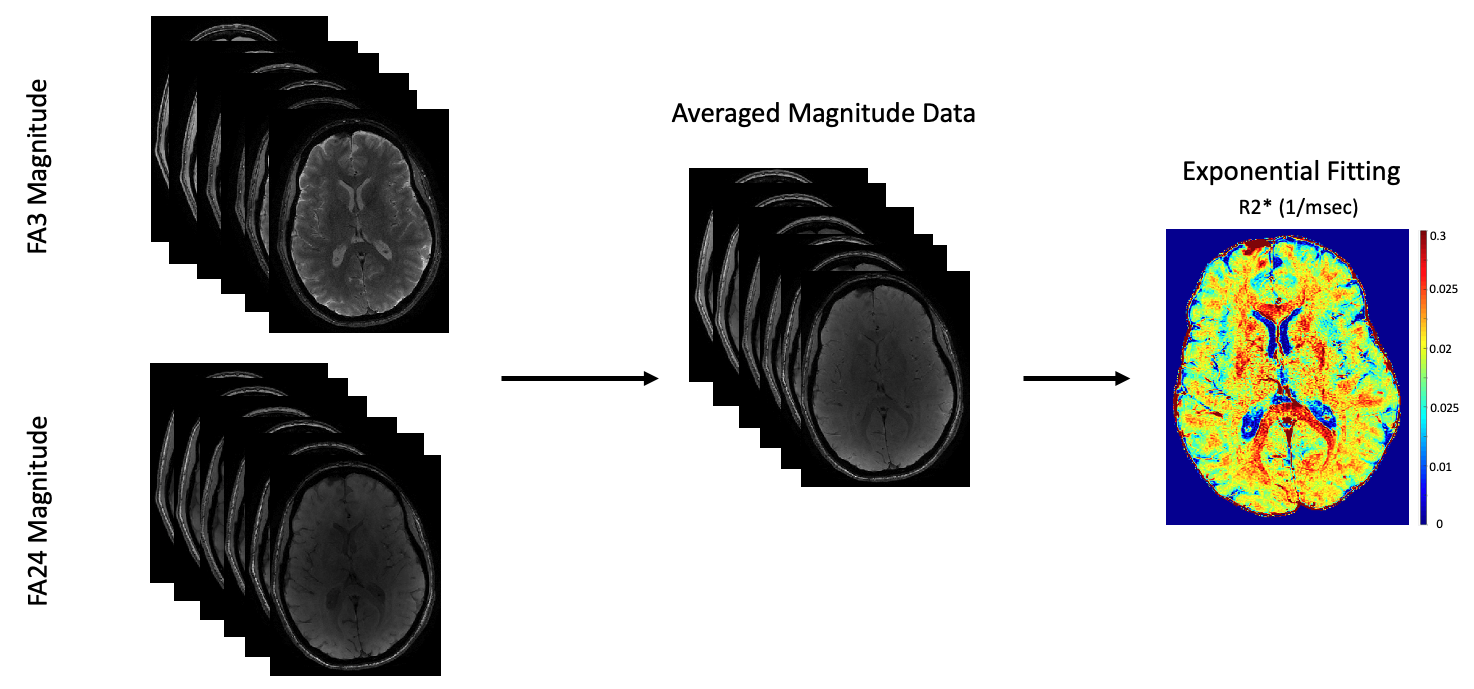
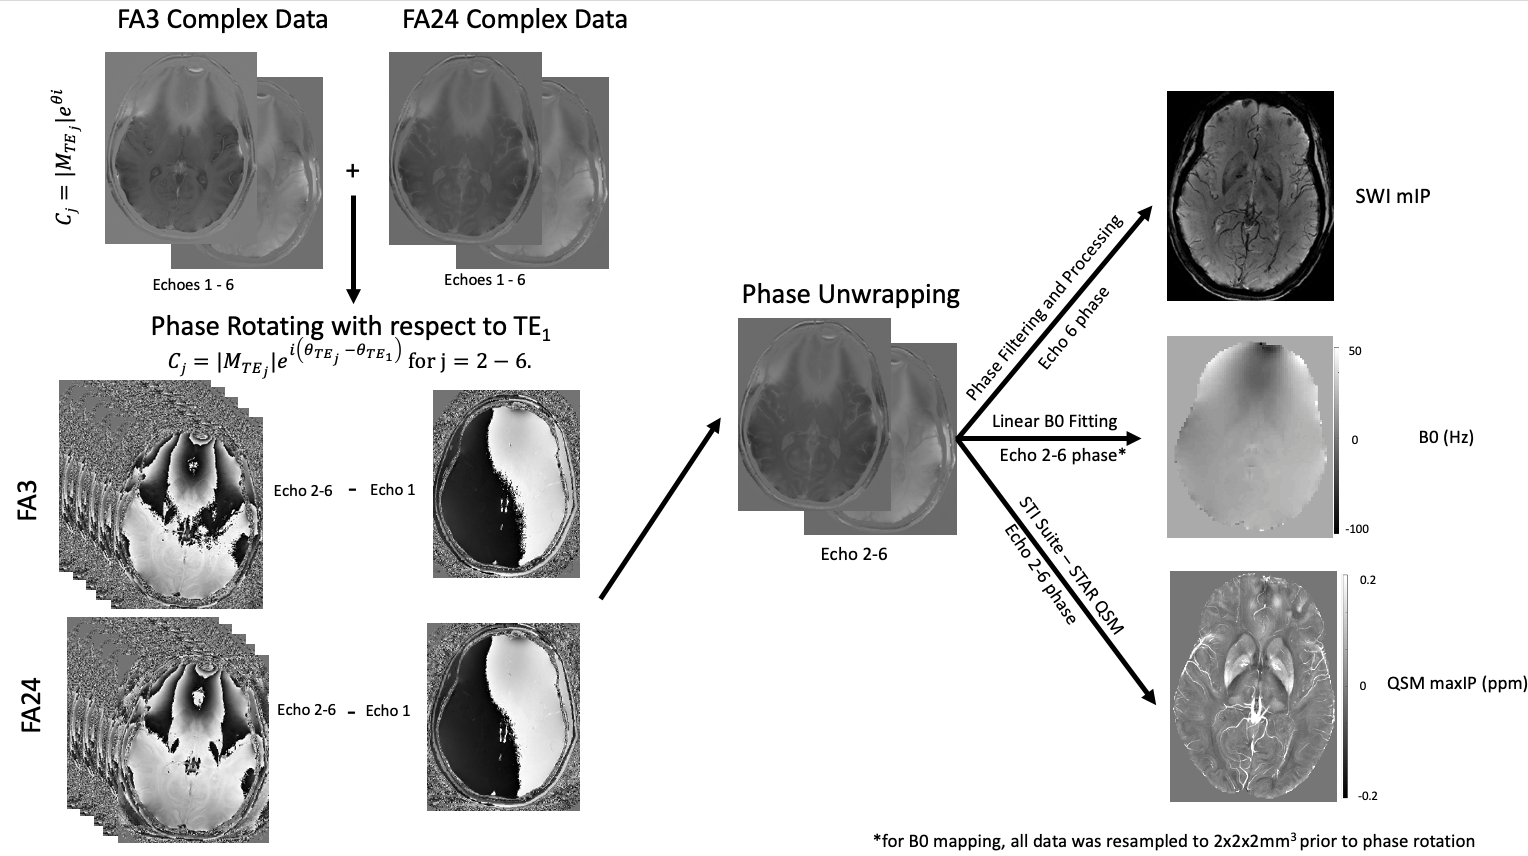
INTRODUCTION: Quantitative T1 (qT1) maps provide information relating to tissue microstructure1, whereas susceptibility weighted image (SWI) contrast is dependent on local changes in magnetic susceptibility3. Both qT1 and SWI scans are typically generated using the spoiled-gradient-echo (SPGR) sequence2, with qT1 maps using magnitude data, and SWI using complex data. Furthermore, multi-echo complex data from SPGR scans can be used to generate quantitative susceptibility maps (QSM), B0 maps and R2* (1/T2*) maps. Generally, quantitative maps are acquired from separate acquisitions, increasing scan time and mis-registrations. Recently, two acquisitions have been designed where qT1 and SWI data can be acquired using the phase and magnitude from the same set of scans4,9. We propose a new implementation which uses complex data from two multi-echo SPGR scans (and a B1 map) to generate qT1, SWI, QSM, R2* and B0 maps at high resolution, in the same space. We demonstrate the benefit of acquiring several echoes through our proposed processing pipeline to improve contrast and limit artifacts in resulting quantitative maps.METHODS: Four healthy volunteers were scanned using a 32-channel head coil (Nova Medical), in a 3T MRI scanner (MR750, GE Healthcare) according to institutional REB. A modified SPGR sequence was used to enable multi-echo acquisitions (ME-SPGR). Axial ME-SPGR (0.5x0.75x2mm3) phase and magnitude data were acquired at two flip angles (α = 3° & 24°), for 6 echoes (TE1 = 3.57 ms, echo spacing = 4.42ms), TR=31ms, total scan time= 5.5 min x 2=11min. Comparatively, our standard 1mm3 3D-qT1 mapping protocol5 (8 min, including B1 mapping with an efficient FSE-based calibrated DAM8) was acquired as well as two EPI-T2w images collected with opposing phase encode direction (AP & PA) for B0 mapping. Images were processed using FSL (FMRIB Software Library). Phase processing was done with MATLAB (The MathWorks, Inc., MA), and STI Suite6 for QSM. For SWI and QSM, complex data from echoes 2-6 were individually phase rotated relative to TE1 (their phase was replaced by the phase difference, relative to TE1), to remove background phase effects and ensure phase alignment across both flip-angles. Data was then complex-averaged to create a dataset consisting of 5-echoes (TE2 – TE6). Phase from the rotated, averaged TE6 was unwrapped (using PRELUDE), filtered and processed to create SWIs3. Phase from the five averaged echoes (TE2 – TE6) were processed with STI Suite6 using the STAR-QSM algorithm. B0 maps were generated by resampling the complex dataset for both flip angles to 2x2x2mm3 before phase rotating relative to TE1 and complex-averaging across flip-angles. These complex-averaged images were phase-unwrapped and fit to a linear function (Δθ vs ΔTE) to generate B0 maps. R2* maps were obtained by fitting the magnitude-averaged signal intensity for the two flip angles at all 6 echoes to an exponential decay function.
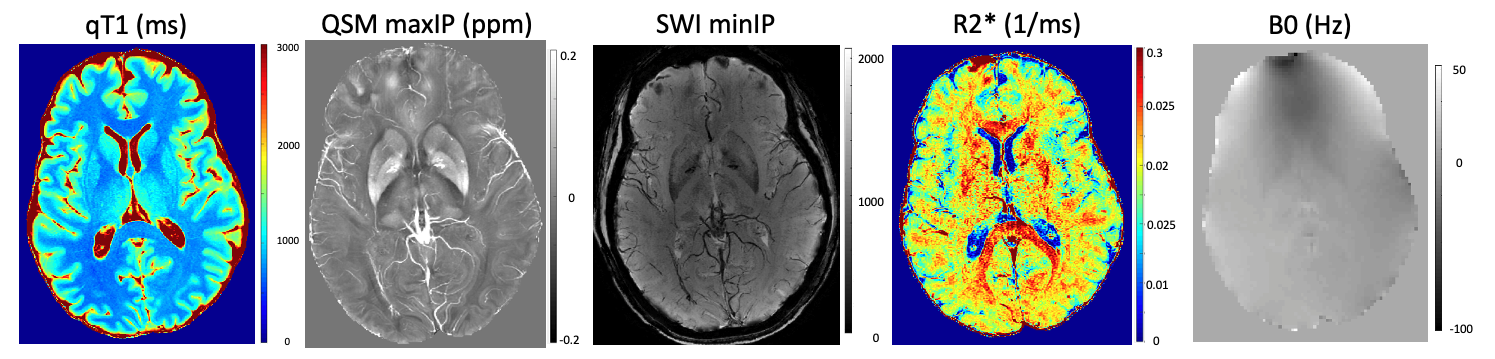
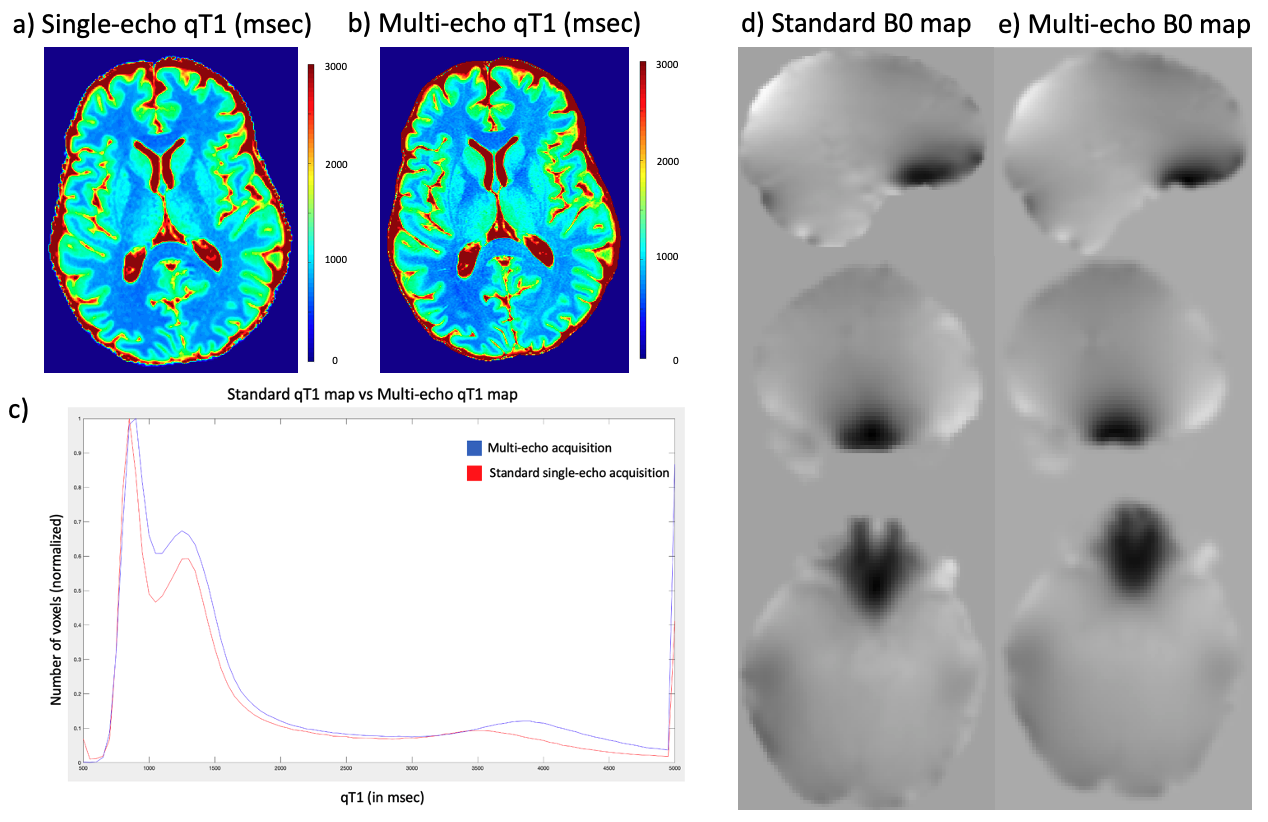
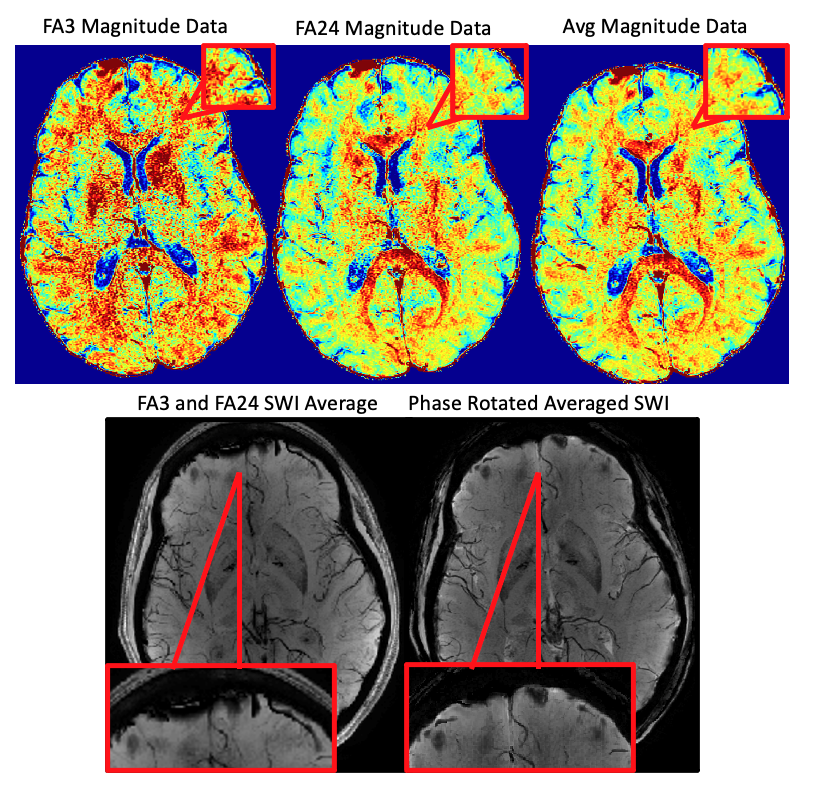
RESULTS: High-resolution (0.5x0.75x2mm3) multi-parametric maps (qT1, QSM, SWI, R2* and B0) were generated in the same space through processing of complex data from our protocol (Fig.1). ME-qT1 maps and B0 maps were consistent with separately acquired standard qT1 and B0 maps for all subjects (Fig.2). Averaging of magnitude data from both flip-angle datasets prior to R2* mapping increased image quality (Fig.3). Phase-rotating echoes 2-6 relative to TE1 allowed for complex-averaging across flip angles prior to SWI and QSM phase-processing. SWIs & QSM showed robust depictions of vasculature over min/Max intensity projections (IP), respectively with QSM being less affected by distortions and phase artifacts.
DISCUSSION: The current data show that the proposed protocol allows for the efficient generation of high-resolution qT1, QSM, SWI, R2* and B0 maps in the same space with a total scan time of 11 min (in addition to B1 mapping). Compared to averaging SWIs and QSM generated for each flip angle independently, the complex-averaging across flip angles (enabled by the phase-rotation relative to TE1) before SWI and QSM processing, improved image quality overall. Compared to STAGE imaging9, these results show that multi-parametric mapping/processing can be optimized by gathering complex data for a higher number of echoes at each flip-angle (6 echoes here vs 2 echoes for STAGE). We acquired our data at higher resolution (0.5x0.75x2mm3) than STAGE (0.67x1.33x2mm3) and with a higher TEmax (25.65ms here vs 18.75ms for STAGE) such that our TR was longer (31ms vs 25ms) leading to a longer total scan time (11 minutes vs 5 minutes). For the same resolution as STAGE, the TR=31ms would give a total scan time of 6 minutes. The longer TEmax allows for optimization of phase processing, through the removal of TE1 phase while maintaining enough phase evolution for proper SWI and QSM processing.
CONCLUSION: Acquiring 6-echo SPGR complex datasets at two flip-angles allows for multi-parametric mapping while also limiting errors related to registrations and phase artifacts and allowing for optimized processing through complex averaging across flip-angles. By having qT1 and QSM in the same space, the T1 of blood can be estimated in vasculature7. Future work includes exploiting complex data for all computations, including T1 and R2*, acquiring 5 echoes to decrease TR and scan time, as well as using multi-echo data to unwrap phase temporally.
Acknowledgements
No acknowledgement found.References
1. Lorio S, Kherif F, Ruef A, et al. Neurobiological origin of spurious brain morphological changes: A quantitative MRI study. Human Brain Mapping. 2016; 37(5): 1801–1815
2. Chavez, S. and Stanisz, G.J. A novel method for simultaneous 3D B1 and T1 mapping: the method of slopes (MoS). NMR Biomed. 2012; 25:1043-1055.
3. Haacke EM, Mittal S, Wu Z, et al. Susceptibility-Weighted Imaging: Technical Aspects and Clinical Applications, Part 1. 2009; 30(1): 19-30
4. Cao T, Wang N, Sen M, et al. Simultaneous quantitative mapping of T1, R2* and susceptibility with magnetic resonance multitasking. ISMRM Annual Meeting. 2020; abstract #881.
5. Chavez S. Calibrating variable flip angle (VFA)-based T1 maps: when and why a simple scaling factor is justified. ISMRM Annual Meeting. 2018; abstract #537.
6. Li W, Wu B and Liu C. STI Suite: A Software Package for Quantitative Susceptibility Imaging. ISMRM Annual Meeting. 2014; abstract #3265
7. Sumra V, Chavez S. Simultaneous vasculature and multiparametric mapping enabled blood T1 measurements: preliminary data. ImNO Annual Meeting. 2020; abstract #76
8. K.L. Desmond, R. Xu, Y. Sun, et al., A practical method for post-acquisition reduction of bias in fast, whole-brain B1-maps, Magnetic Resonance Imaging. 2020;12.
9. Chen Y, Saifeng L, Wang Y, et al. STrategically Acquired Gradient Echo (STAGE) imaging, part I: Creating enhanced T1 contrast and standardized susceptibility weighted imaging and quantitative susceptibility mapping. Magnetic Resonance Imaging. 2018; 46: 130-139.
Figures