3053
Simultaneous Mapping of Myelin Water Fraction and Quantitative Susceptibility of Whole Brain1Shanghai Jiao Tong University, Shanghai, China
Synopsis
The feasibility of simultaneously obtaining the quantitative myelin water fraction (MWF) mapping and susceptibility mapping (QSM) is demonstrated by using the multi-echo gradient echo (mGRE) sequence in this study. The retrospective and the perspective undersampling experiments have shown the potential of obtaining whole brain QSM/MWF quantifications in 1 minute.
Introduction
Myelin water quantification provides specific information about the integrity of the myelin sheath in the brain1,2. QSM is a contrast mechanism based on intrinsic differences in the magnetic susceptibility of different tissues3,4. QSM has also provided promising applications in the detection of demyelination5. The mGRE sequence can be used to quantify the MWF in the brain6 and can also be applied to obtain the magnetic susceptibility information of different tissues7. Whereas, the acquisitions of the MWF and QSM maps are usually carried out separately. Moreover, the collection of whole brain mGRE data requires several minutes8,9. In this study, the feasibility of simultaneous MWF/QSM quantification is investigated using the mGRE acquisition. The potential of obtaining whole brain QSM/MWF quantifications in 1 minute is further tested retrospectively and prospectively.Methods
Nine healthy subjects (7 males, 2 females, age 25.7 ± 5.3) were scanned using a multi-slice mGRE sequence on a 3T MRI scanner (uMR790, United Imaging Healthcare, Ltd., Shanghai, China). Written consent was obtained before each scan. The following scanning parameters were applied: FOV = 240 mm × 240 mm, matrix = 176 × 176, flip angle = 90°, time repetition = 2 s, first echo time = 1.95 ms, echo spacing = 1.16 ms, echo train length = 30, slice thickness = 3 mm, 25 slices were scanned with a 1.5 mm slice gap. The whole brain scan time was 5.9 min. A variable-density random phase-encoding mask with R=6 was used for retrospective undersampling. The undersampled datasets were reconstructed by the low-rank and sparse regularized tensor dictionary learning algorithm (TDLLS) reconstruction algorithm developed in our lab. The non-negative jointly sparse (NNJS) algorithm was used to estimate the MWF from the T2*WIs10. A joint 2D and 3D phase processing method was used for quantitative susceptibility mapping calculation7. The last ten echoes were used for the QSM estimation. In the prospective undersampling, blip gradients were added to the mGRE sequence at the ramps of a train of readout gradients to cover large Ky-t space in one shot. A pseudo-random sampling pattern with variable sampling density in the Ky direction and constrained blip gradients in the temporal direction was designed. For the prospective undersampling with R = 6, a total of 30 shots were acquired to collect all T2* signals. The 8 central k-space lines were collected at all echoes. The rest 22 Ky lines were designed to pseudo-randomly distributed in periphery k-space, which could be clustered into several groups. Each Ky line in the first group was set to be randomly varied within 6 phase steps along the time direction, and each Ky line in the second group was set to be randomly varied within 9 phase steps at different echoes. The first group included 10 Ky lines, which were closer to the central k-space than the 12 Ky lines in the second group. The phase encodings within each shot covered the Ky-t space complementarily. To reduce the eddy current effects, the randomness of the Ky variation along the time direction was restrained within 2 Ky lines by constraining the max blip gradients. One subject was scanned and the whole brain scan time was 1 min.Results
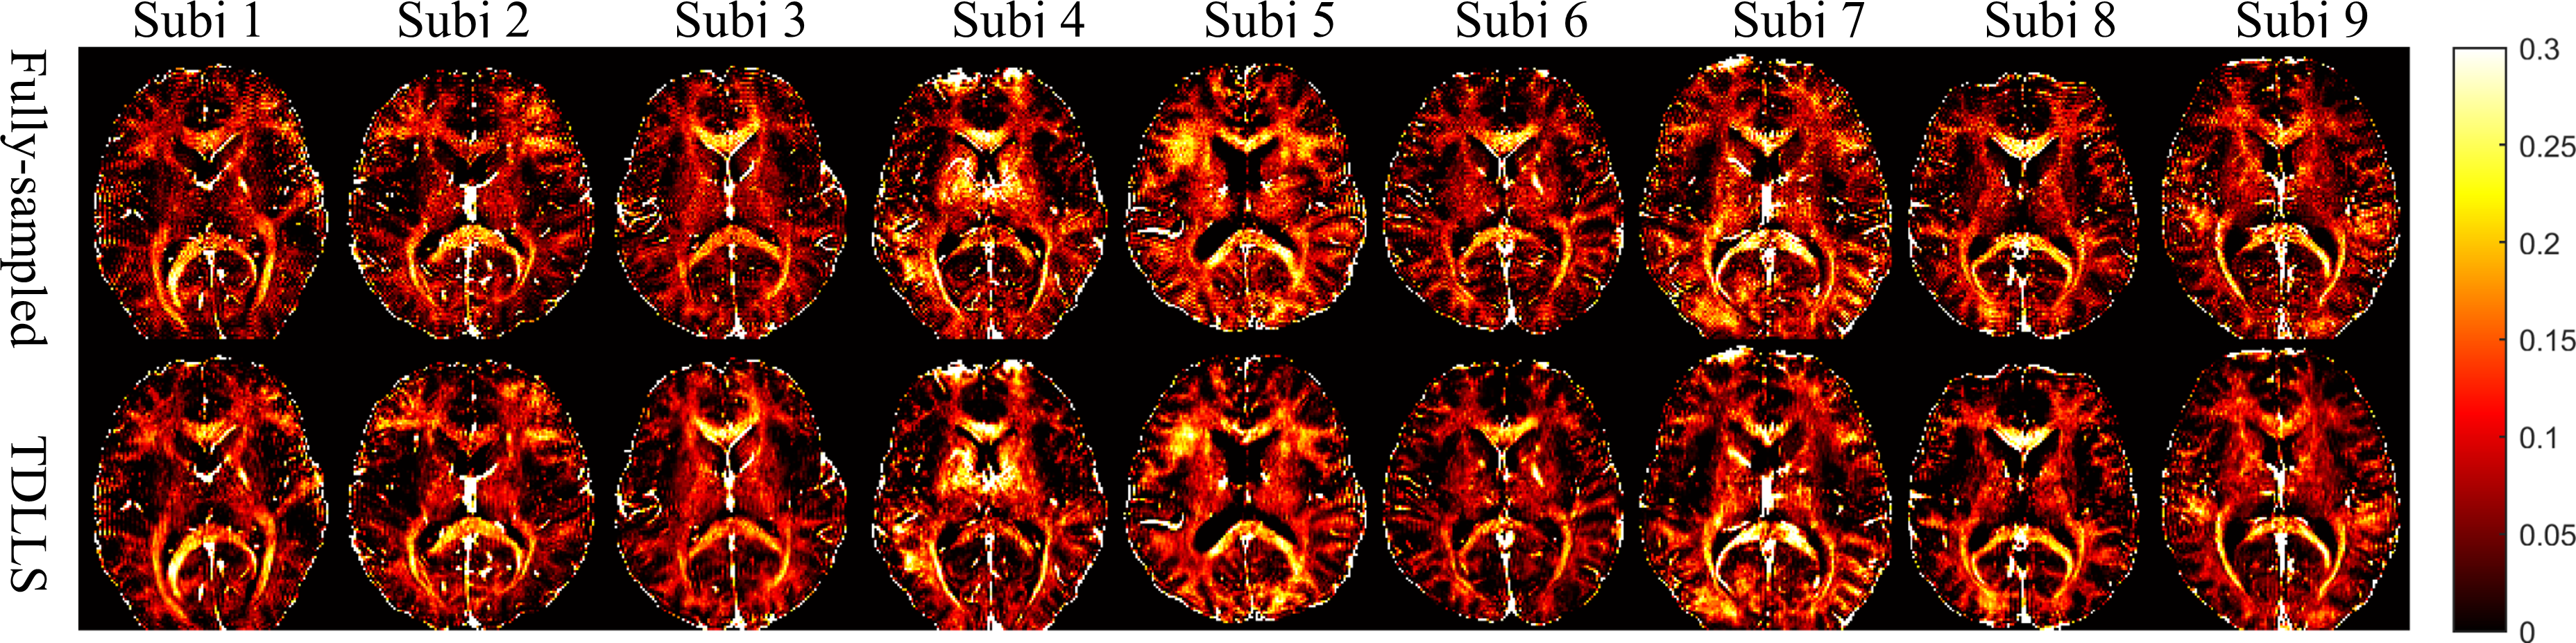
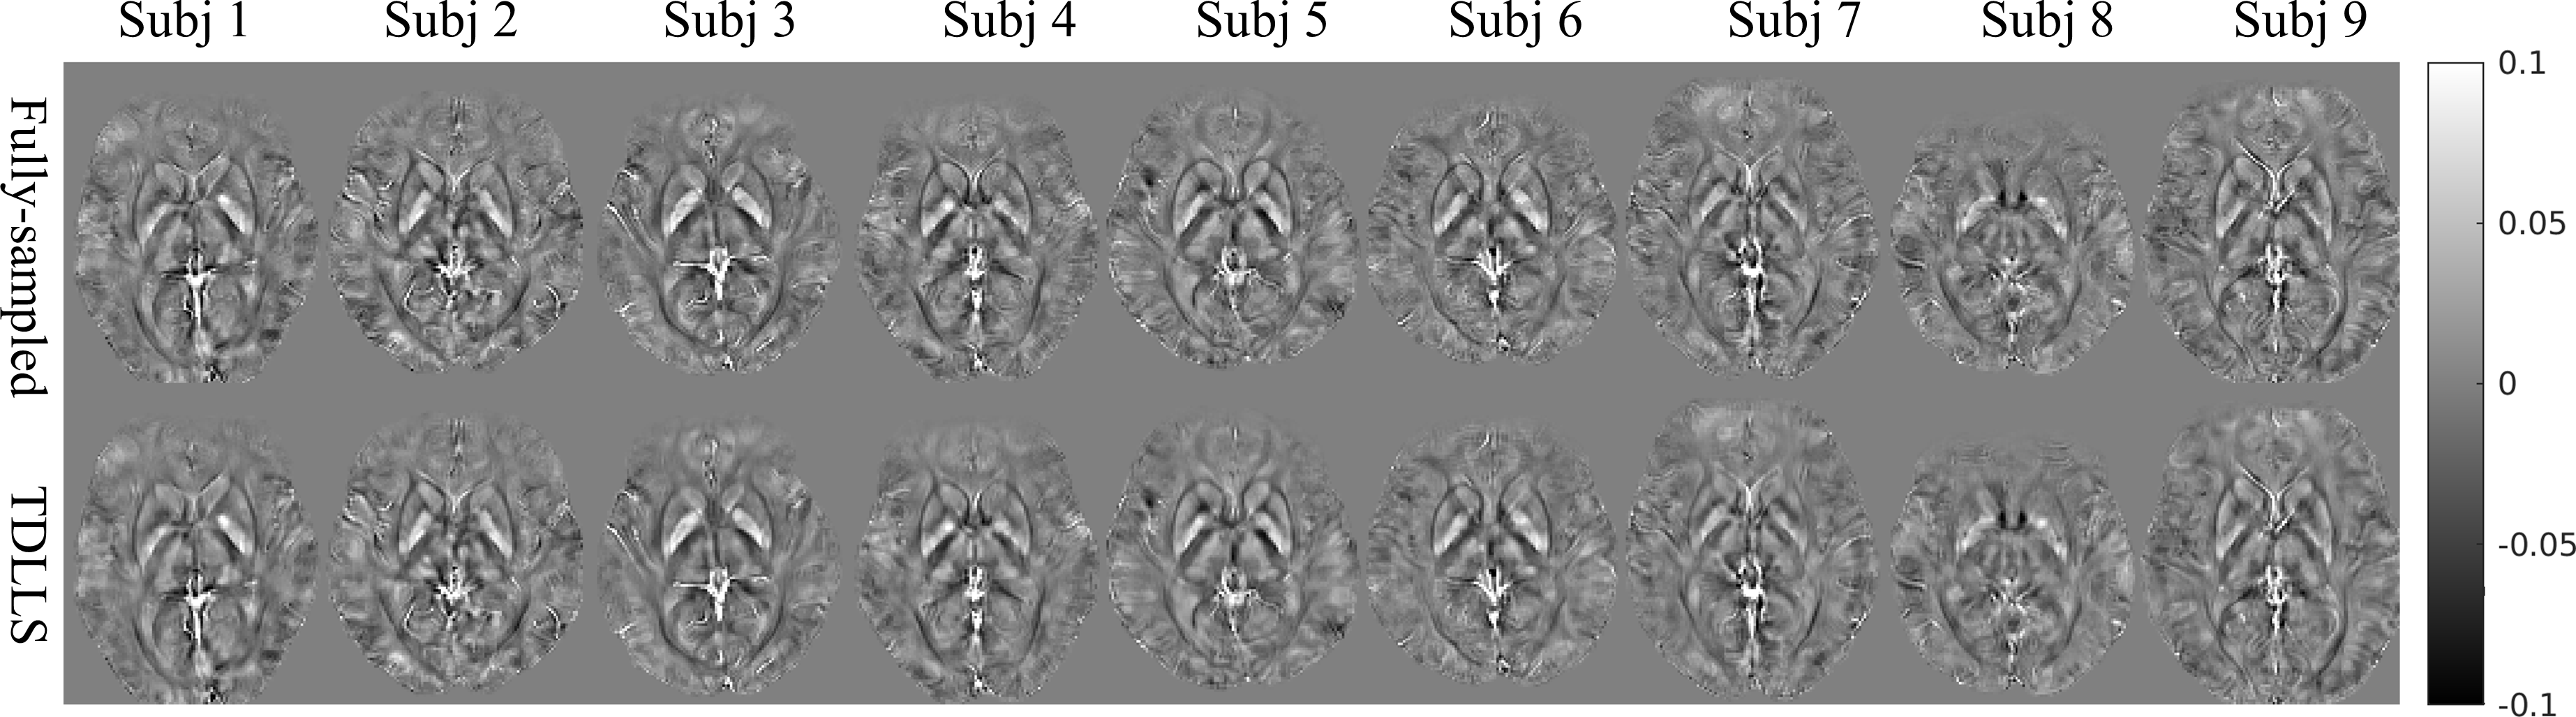
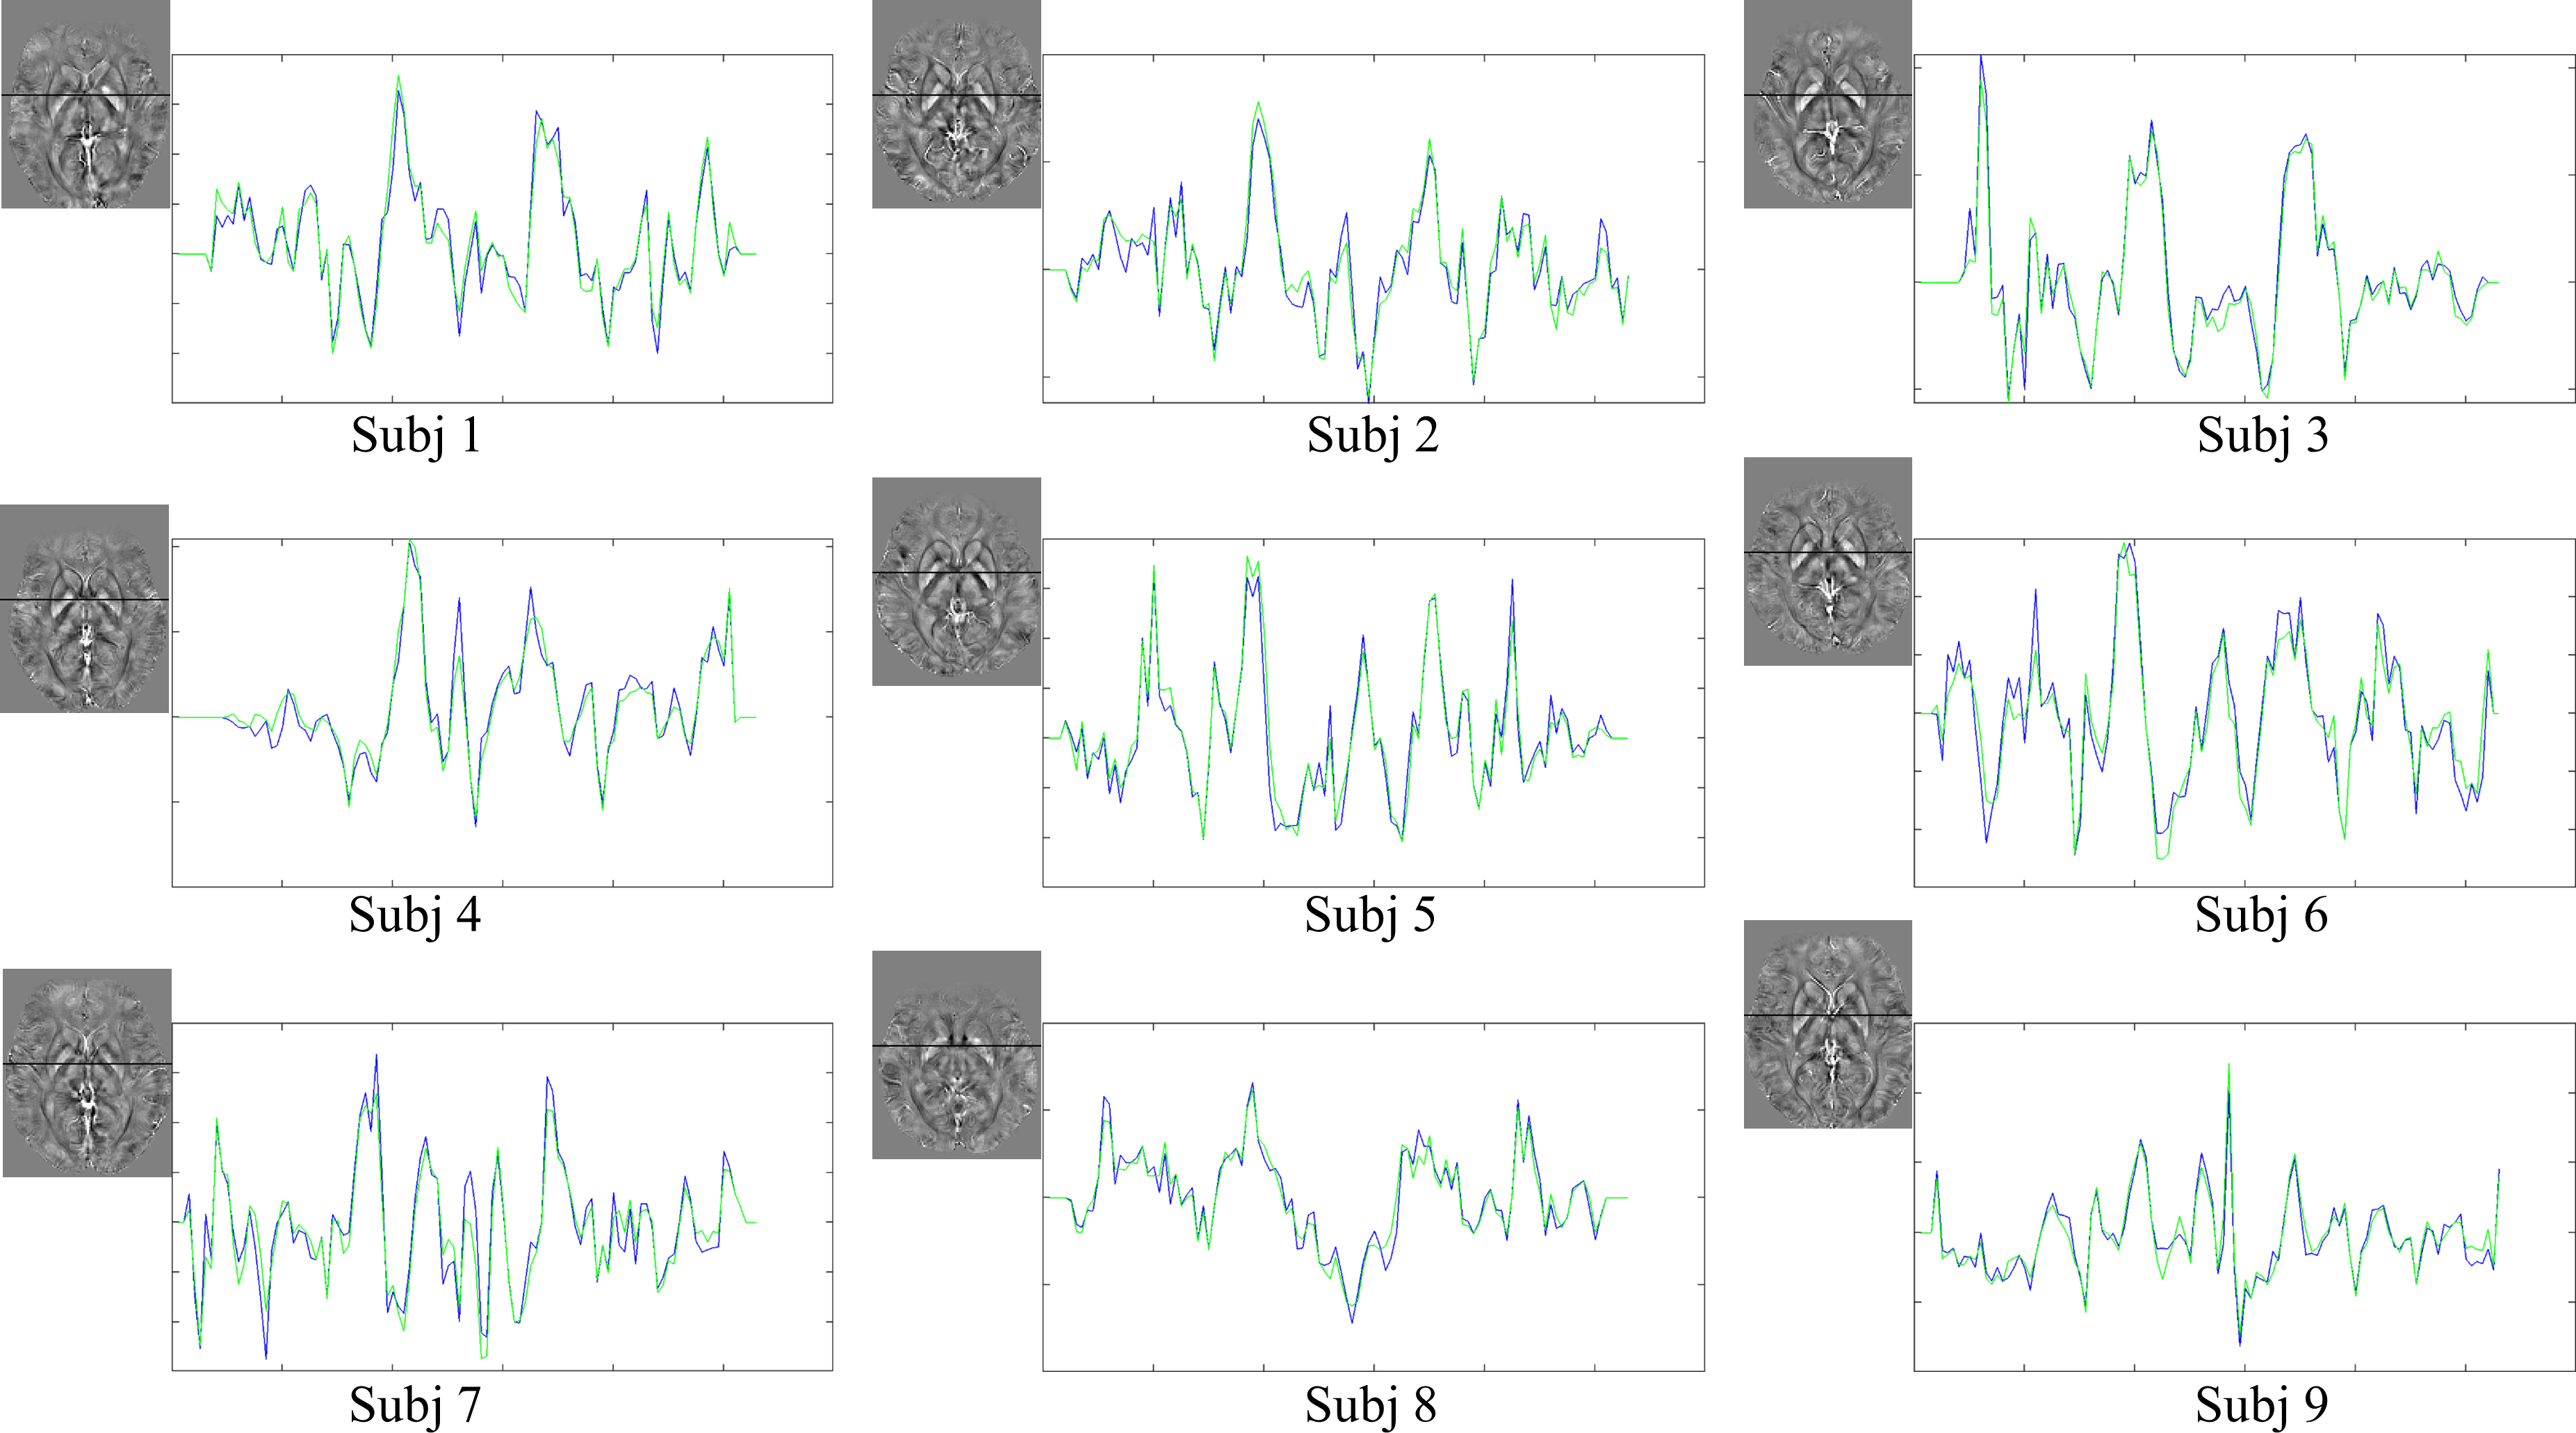
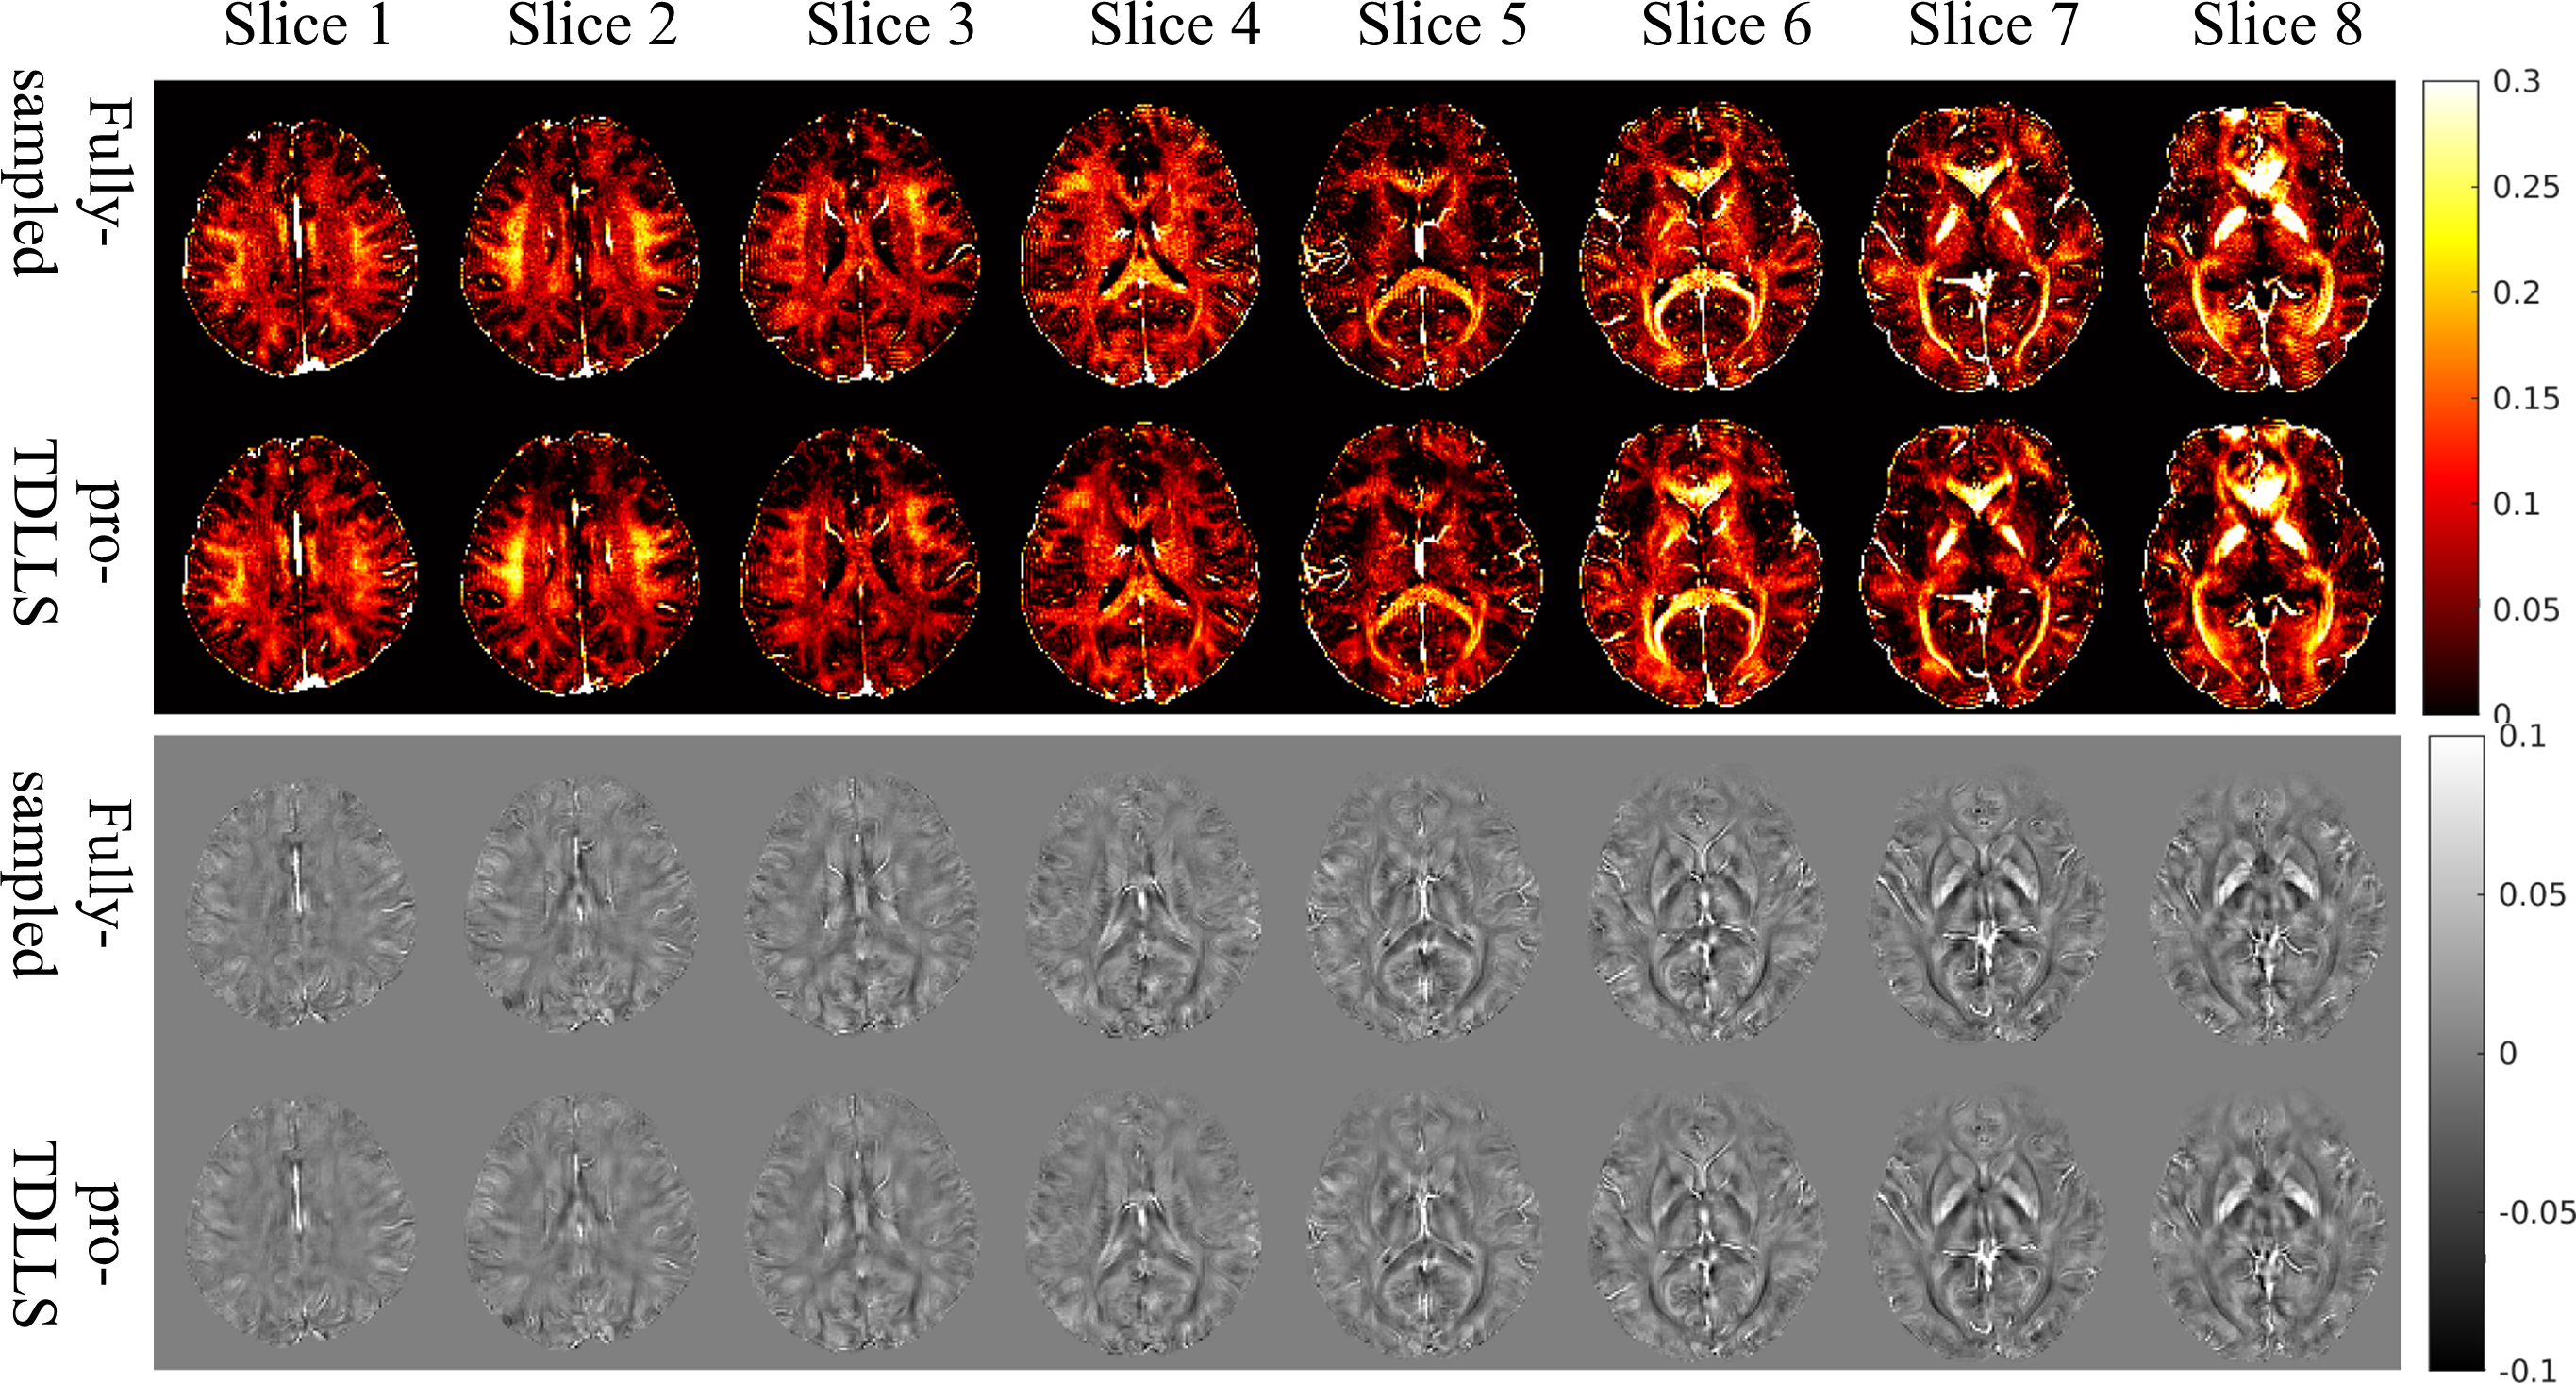
Figure 1 and Figure 2 show the MWF and QSM maps obtained from the fully-sampled mGRE data and the retrospectively undersampled data with R=6 from 9 subjects. High-quality MWF and QSM maps can be obtained from the fully-sampled mGRE data. The brain tissue structures can be clearly depicted in both the MWF maps and the QSM maps. The MWF/QSM maps obtained from the retrospectively undesampled data show high similarity with the MWF/QSM results of the fully-sampled data. The profile plots have demonstrated the similar variations in the QSM maps of the fully-sampled data and the TDLLS reconstructed data, as shown in Figure 3. Figure 4 shows the MWF/QSM maps of 8 adjacent slices from one prospectively undersampled datasets with R=6. The MWF/QSM results of the prospective undesampled data also show high similarity with that of the fully-sampled data.Discussion and Conclusions
The high-quality QSM maps and MWF maps can be obtained simultaneously using the mGRE acquisition. The 1 minute whole brain QSM/MWF quantifications can be achieved by the joint application of the prospective undersampling scheme with pseudo-random and complementary Ky-t space encodings and the TDLLS reconstruction algorithm.Acknowledgements
No acknowledgement found.References
[1] Mackay AL, Whittall KP, Adler J, Li DKB, Paty DW, Graeb DA. In vivo visualization of myelin water in brain by magnetic resonance. Magn Reson Med 1994;31:673-677.
[2] Whittall KP, MacKay AL, Graeb DA, Nugent RA, Li DK, Paty DW. In vivo measurement of T2 distributions and water contents in normal human brain. Magn Reson Med 1997;37:34-43.
[3] Wang Y, Liu T. Quantitative susceptibility mapping (QSM): decodingMRI data for a tissue magnetic biomarker. Magn Reson Med 2015;73:82-101.
[4] Haacke EM, Liu S, Buch S, Zheng W, Wu D, Ye Y. Quantitative susceptibility mapping: current status and future directions. Magn Reson Imaging 2015;33:1-25.
[5] Liu C, Li W, Johnson GA, Wu B. High-field (9.4 T) MRI of brain dysmyelination by quantitative mapping of magnetic susceptibility. NeuroImage 2011; 56(3): 930–938.
[6] Du YP, Chu R, Hwang D, et al. Fast multislice mapping of the myelin water fraction using multicompartment analysis of T2* decay at 3T: a preliminary postmortem study. Magn Reson Med 2007;58:865-870.
[7] Wei HJ, Zhang YY, et al. Joint 2D and 3D phase processing for quantitative susceptibility mapping: application to 2D echo-planar imaging. NMR in Biomedicine 2016; 30. 10.1002/nbm.3501.
[8] Nam Y, Kim DH, Lee J. Physiological noise compensation in gradient-echo myelin water imaging. Neuroimage 2015;120:345-349.
[9] Lee H, Nam Y, Kim DH. Echo time-range effects on gradient-echo based myelin water fraction mapping at 3T. Magn Reson Med. 2019;81:2799-2807.
[10] Chen Q, She H, and Du YP. Improved quantification of myelin water fraction using joint sparsity of T2* distribution. J Magn Reson Imaging 2020;52:146-158.
Figures