3050
Simultaneous Mapping of Metabolite Concentration and T1 Relaxation Time Using Subspace Imaging Accelerated Inversion Recovery MRSI1Radiology, Massachusetts General Hospital, Boston, MA, United States, 2Radiology, Harvard Medical School, Boston, MA, United States
Synopsis
Absolution quantification of metabolite concentration requires accurate measurement of the longitudinal relaxation times of metabolites. However, it will be very time consuming to access the spatial variations of metabolite T1 relaxation times using the conventional MRS-based methods. Inspired by the recent success of the subspace-based methods for fast high-resolution MRSI, we propose a subspace imaging-based method for simultaneous mapping of metabolite concentration and T1 relaxation time. We propose a fast Look-Locker EPSI sequence for data acquisition and a low-rank tensor-based method for simultaneous reconstruction of MRSI images at different TIs.
INTRODUCTION
Absolution quantification of metabolite concentration requires accurate measurement of the longitudinal relaxation times of metabolites1-4. The T1 relaxation times of cerebral metabolites can vary within normal human brain5 and depend on physiological conditions6. The conventional way for metabolite T1 relaxation time measurement is to acquire multiple spectra of VOIs at different inversion times (TI) using inversion pulse prepared STEAM or PRESS sequence. However, it will be very time consuming to access the spatial variations of metabolite T1 relaxation times using the conventional MRS-based methods. Inspired by the recent success of the subspace-based methods for fast high-resolution MRSI7-10, we propose a subspace imaging-based method for simultaneous mapping of metabolite concentration and T1 relaxation time. We propose a fast Look-Locker11 EPSI sequence for data acquisition and a low-rank tensor-based method12,13 for simultaneous reconstruction of MRSI images at different TIs. We demonstrate the feasibility of the proposed method using in vivo data acquired on a 3T scanner.METHOD
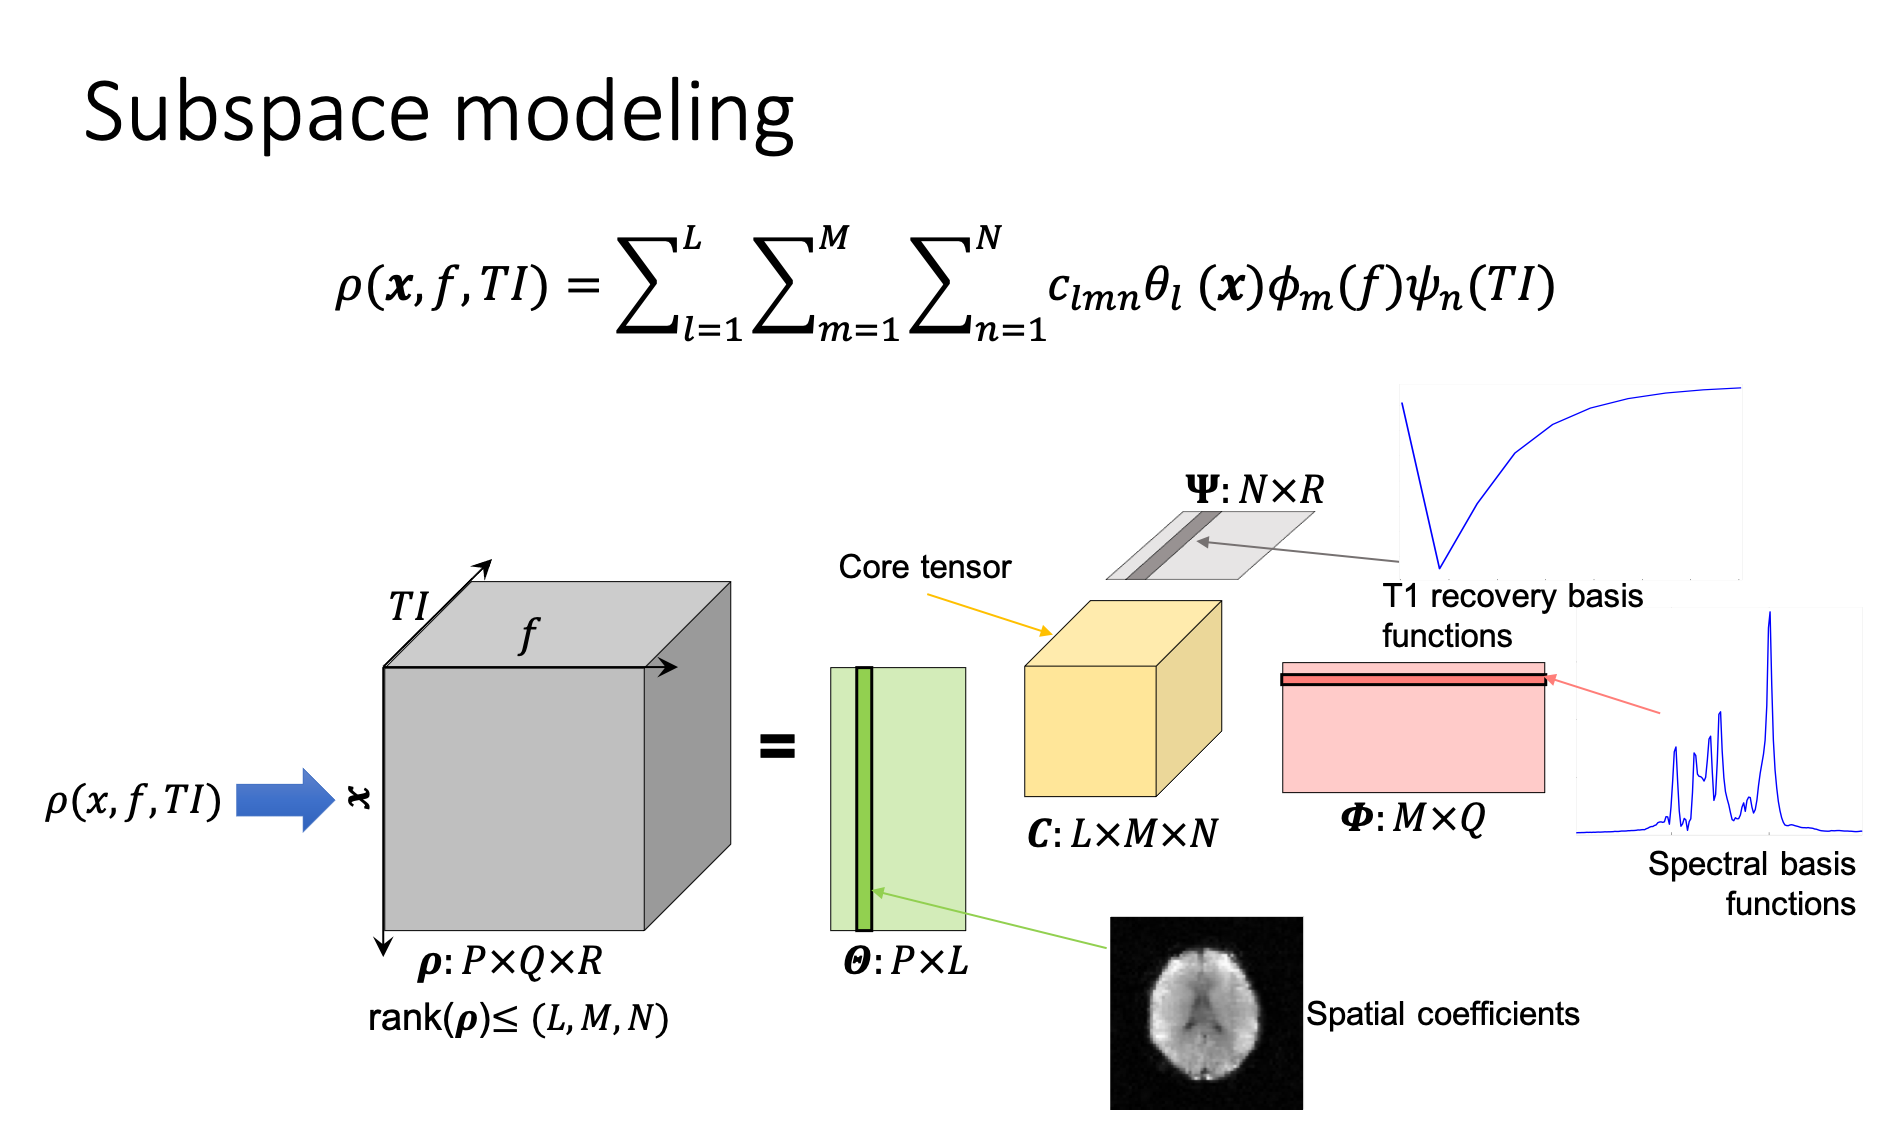
Data acquisition: A Look-Locker inversion recovery sequence is developed for efficient acquisition of MRSI images at different TIs. Right after a non-selective adiabatic inversion pulse, 10 MRSI data are acquired with EPSI readouts and the following imaging parameters: TR/TE=390/4.5ms, flip angle=45o, FOV=240x240mm2, slice thickness=12 mm, spatial-spectral encoding matrix=64x64x310, and echo-spacing=0.8ms. WET pulses and OVS bands can be inserted for suppression of water and lipid signals.Image reconstruction: As illustrated in Fig. 1, we represent MRSI images acquired at different TIs $$$\rho(\mathbf{x},f,TI)$$$ using a low-rank tensor model: $$\rho(\mathbf{x},f,TI)=\sum_{l=1}^{L} \sum_{m=1}^{M} \sum_{n=1}^{N} c_{lmn} \theta_{l}(\mathbf{x}) \phi_{m}(f) \psi_{n}(TI)$$ where $$$\{\phi_{m}(f)\}_{m=1}^{M}$$$, and $$$\{\psi_{n}(TI)\}_{n=1}^{N}$$$ are basis functions that describe the spectral distribution and T1 recovery of the signal, respectively. $$$\{\theta_{l}(\mathbf{x})\}_{l=1}^{L}$$$ are the corresponding spatial coefficients. $$$\{ c_{lmn} \}_{l,m,n=1}^{L,M,N}$$$ are core-tensor coefficients describing the correlation of the high-dimensional data along multiple directions. MRSI images at different TIs are reconstructed simultaneously by fitting the low-rank tensor model to the measured k-space data with anatomical priors as in12-13.
Spectral quantification: For each voxel, the spectra at different TIs are jointly fitted in the temporal domain using the following signal model: $$s(t,TI) = \sum_{j} \alpha_j(TI) e^{-t/T_{2,j}^{*} + i 2 \pi \Delta f_{j} t} \beta_j(t), $$ where $$$\alpha_j(TI) $$$, $$$ T_{2,j}^{*} $$$, $$$\Delta f_{j} $$$, and $$$\beta_j(t)$$$ denotes the amplitude, transverse relaxation time, frequency offset, and spectral basis function of the $$$j$$$-th metabolite, respectively. The macromolecular signals are estimated along with other brain metabolites using a time-segmented fashion similar to that in 9. Finally, the T1 relaxation time of each metabolite is estimated by fitting $$$\alpha_j(TI) $$$ to the following model of a Look-Locker acquisition11: $$ \alpha_j(TI) = \alpha_j(n TR) = A_j – B_j \cos(\omega)^n e^{-n TR/T1_j},$$ where $$$\omega$$$ is the flip angle.
RESULTS
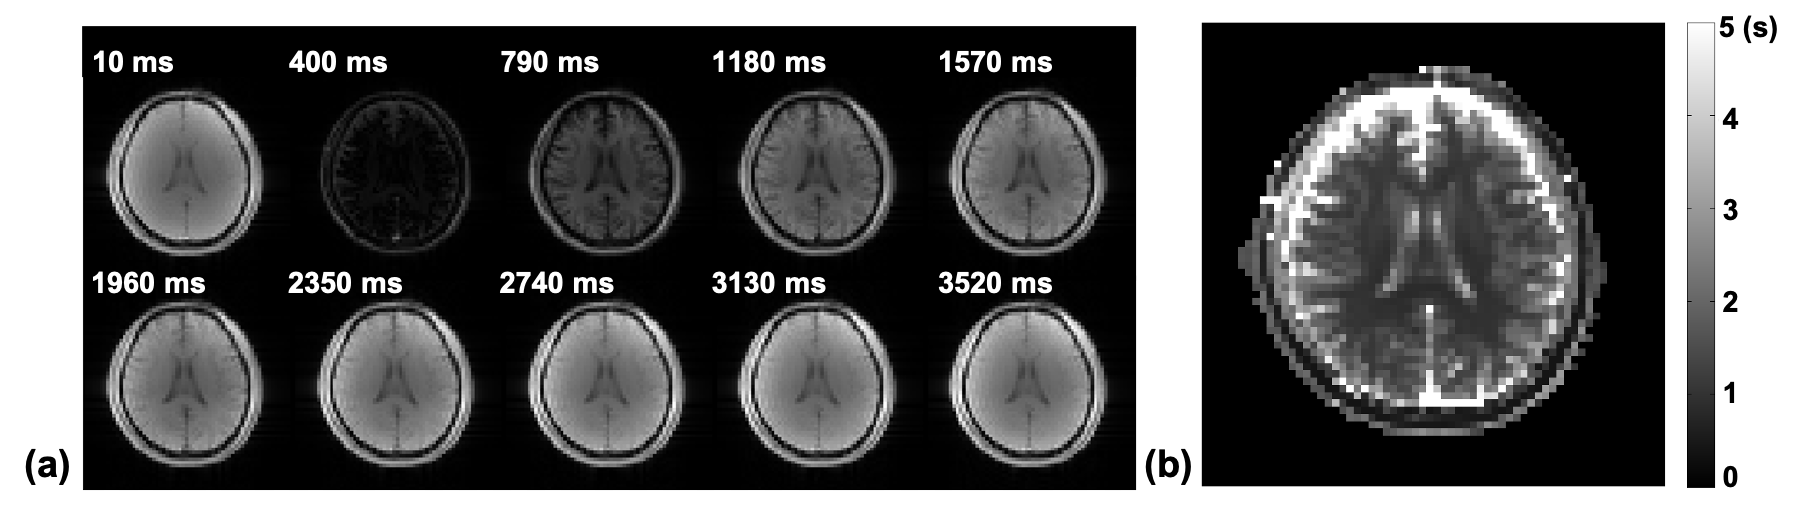
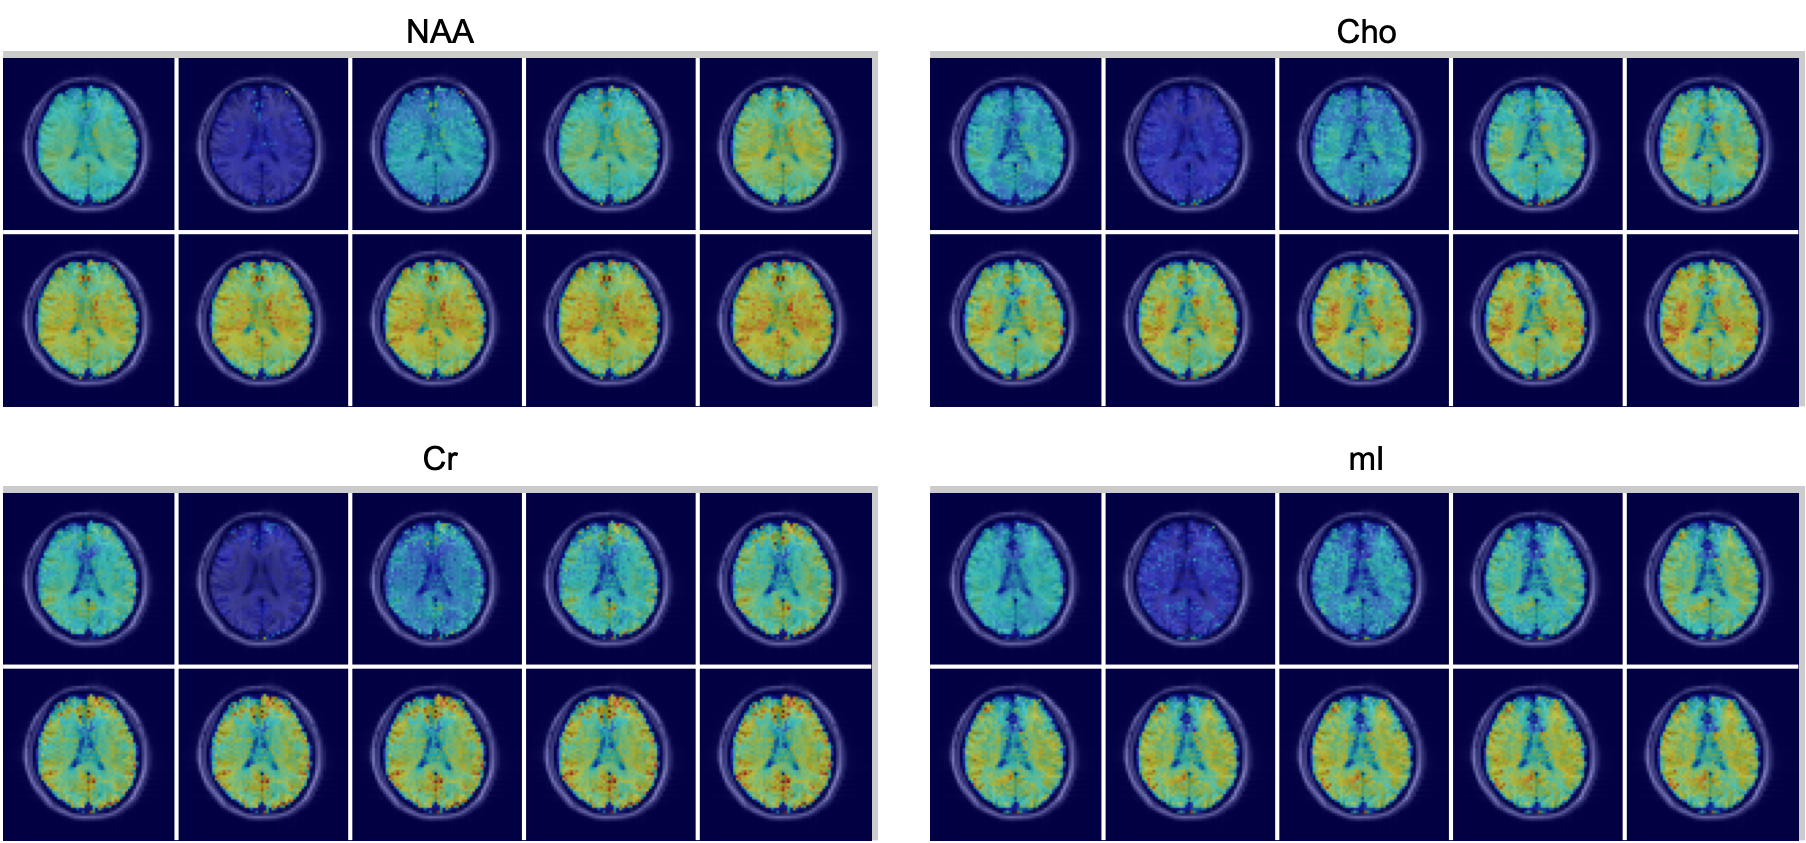
In vivo brain MRSI data were acquired from a healthy subject on a 3T Siemens scanner (approved by our local IRB). The proposed sequence was used to acquire 2D multi-TI MRSI data with 4 signal averages and nuisance signal suppression. The acquisition time was 16 minutes. For comparison, the same sequence was used for T1 mapping of the water signal without nuisance signal suppression and signal averaging. It was also used to acquire a low-resolution MRSI data with 16x16 phase encodings and FID acquisitions for spectral encodings.Figure 2 shows the water images acquired using the propose sequence without nuisance signal suppression at each TI and the estimated T1 map. Figure 3 shows the maps of NAA, Cho, Cr, and mIns at each TI, which are arranged the same way as the water images and overlaid with anatomical reference image. Both the metabolite maps and water images show the expected T1 recovery as TI increases. The contrasts of metabolite maps at TI=3520 ms are expected to be similar to those acquired with the same TR/TE and flip angle but without inversion pulse. Note that the metabolite signals are close to be nulled at TI = 400 ms, which is expected since the Look-Locker acquisition makes the signal recovered at an apparent T1 faster than the native T1.
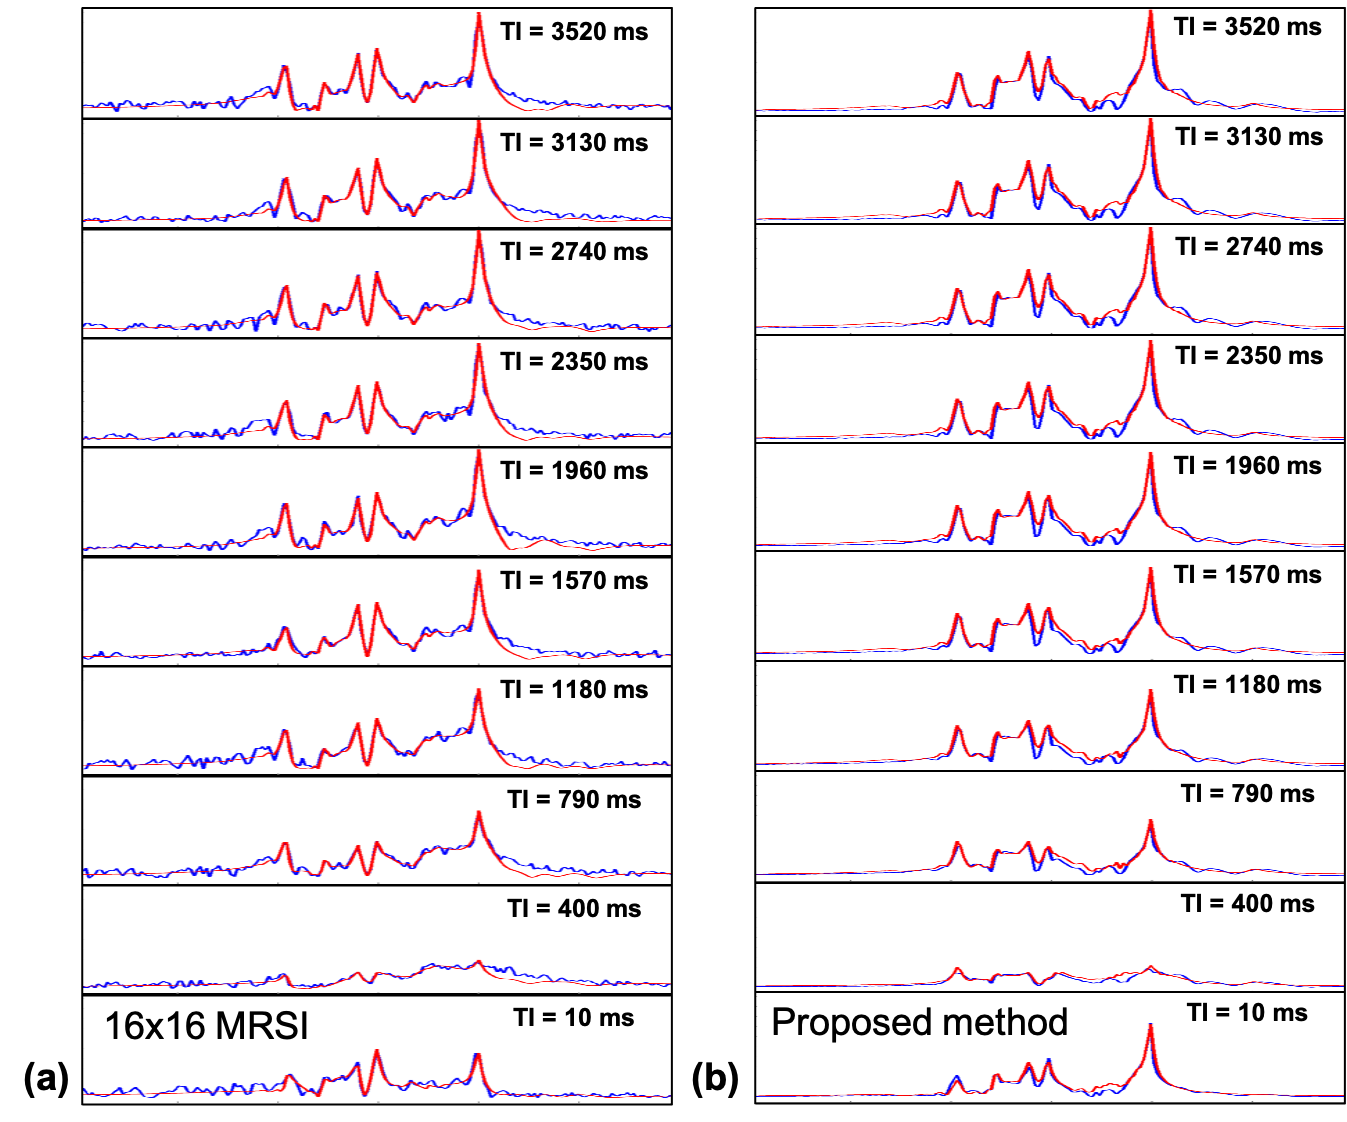
Figure 4 shows Representative spectra at different TIs from (a) the low-resolution IR-MRSI and (b) the proposed high-resolution IR-MRSI (64x64). Note the spectra obtained by both methods show dominant macromolecular signals when TI=400 ms. The spectra of the low-resolution IR-MRSI show noticeable residual lipid signals around 2.5 ppm.
The estimated T1 relaxation times of water, NAA, Cr-CH2, Cr, mIn, and Cho within the white matter were: 1120.8±185.6 ms, 1383.3±165.7 ms, 854.1±132.0 ms, 1417.0±181.4 ms, 1297.8.8±244.5 ms, and 1454.6±246.0 ms, respectively. These measurement are in a good agreement with literature reported values at 3T1,5. Further investigation is necessary with increased number of subjects to validate and assess the regional difference of the metabolite T1 relaxation times by the proposed method.
Conclusion
A new method is proposed for simultaneous mapping of metabolite concentration and T1 relaxation time with a fast inversion recovery-based MRSI sequence for data acquisition and a low-rank tensor-based method for simultaneous reconstruction of MRSI images at different TIs. We demonstrate the feasibility of the proposed method using in vivo data acquired on a 3T scanner.Acknowledgements
This work was supported in part by NIH grants P41 EB022544, R01 CA165221 and K01 EB030045References
[1] V. Mlynrik, S. Gruber, and E. Moser, “Proton T1 and T2 relaxation times of human brain metabolites at 3 Tesla,” NMR Biomed., vol. 14, no. 5, pp. 325–331, 2001.
[2] D. R. Rutgers and J. Van Der Grond, “Relaxation times of choline, creatine and N-acetyl aspartate in human cerebral white matter at 1.5 T,” NMR Biomed., vol. 15, no. 3, pp. 215–221, 2002.
[3] F. Träber, W. Block, R. Lamerichs, J. Gieseke, and H. H. Schild, “1H Metabolite Relaxation Times at 3.0 Tesla: Measurements of T1 and T2 Values in Normal Brain and Determination of Regional Differences in Transverse Relaxation,” J. Magn. Reson. Imaging, vol. 19, no. 5, pp. 537–545, 2004.
[4] Y. Li et al., “T1 and T2 Metabolite Relaxation Times in Normal Brain at 3T and 7T,” J. Mol. Imaging Dyn., vol. 02, no. 02, pp. 1–5, 2013.
[5] E. E. Brief, K. P. Whittall, D. K. B. Li, and A. MacKay, “Proton T1 relaxation times of cerebral metabolites differ within and between regions of normal human brain,” NMR Biomed., vol. 16, no. 8, pp. 503–509, 2003.
[6] Y. Li, R. Srinivasan, H. Ratiney, Y. Lu, S. M. Chang, and S. J. Nelson, “Comparison of T1 and T2 metabolite relaxation times in glioma and normal brain at 3T,” J. Magn. Reson. Imaging, vol. 28, no. 2, pp. 342–350, 2008.
[7] F. Lam and Z. P. Liang, “A subspace approach to high-resolution spectroscopic imaging,” Magn. Reson. Med., vol. 71, no. 4, pp. 1349–1357, 2014.
[8] F. Lam, C. Ma, B. Clifford, C. L. Johnson, and Z.-P. Liang, “High-resolution 1 H-MRSI of the brain using SPICE: Data acquisition and image reconstruction,” Magn. Reson. Med., vol. 76, no. 4, pp. 1059–1070, 2016.
[9] F. Lam, Y. Li, B. Clifford, and Z.-P. Liang, “Macromolecule mapping of the brain using ultrashort-TE acquisition and reference-based metabolite removal,” Magn. Reson. Med., vol. 00, no. May, pp. 1–10, 2017.
[10] X. Peng, F. Lam, Y. Li, B. Clifford, and Z. P. Liang, “Simultaneous QSM and metabolic imaging of the brain using SPICE,” Magn. Reson. Med., vol. 79, no. 1, pp. 13–21, 2018.
[11] E. Henderson, G. McKinnon, T. Y. Lee, and B. K. Rutt, “A fast 3D look-locker method for volumetric T1 mapping,” Magn. Reson. Imaging, vol. 17, no. 8, pp. 1163–1171, 1999.
[12] J. He, Q. Liu, A. G. Christodoulou, C. Ma, F. Lam, and Z. P. Liang, “Accelerated High-Dimensional MR Imaging with Sparse Sampling Using Low-Rank Tensors,” IEEE Trans. Med. Imaging, vol. 35, no. 9, pp. 2119–2129, 2016.
[13] C. Ma et al., “High-resolution dynamic 31P-MRSI using a low-rank tensor model,” Magn. Reson. Med., vol. 78, no. 2, pp. 419–428, 2017.
Figures