3049
Quantification of transverse relaxation times in vivo at 7T field-strength.1Neurophysics, Max Planck Institute for Human Cognitive and Brain Sciences, Leipzig, Germany, 2Biomedical Engineering, Tel Aviv University, Tel Aviv, Israel, 3Sagol School of Neuroscience, Tel Aviv University, Tel Aviv, Israel, 4Center for Advanced Imaging Innovation and Research (CAI2R), New-York University Langone Medical Center, New York, NY, United States, 5Felix Bloch Institute for Solid State Physics, Faculty of Physics and Earth Sciences, Leipzig University, Leipzig, Germany
Synopsis
Accurate quantification of transverse relaxation times in vivo is of vital importance for research and clinical applications. At higher field-strength, the gain in signal enables T2 mapping at sub-millimetre resolutions, but with infeasible scan time for standard spin-echo techniques. Using CPMG echo trains reduces the acquisition time. However, inhomogeneities of the transmit B1 field hamper accurate T2 quantification. Correcting for resulting bias effects is possible through signal response simulations via the Bloch equations using the specific sequence parameters. Matching acquired data to the simulated signal points allows accurate and robust fitting of T2 values as shown by our 7T study.
Purpose
An accurate and robust quantification of relaxation times is of vital importance for studying the structural composition of the human brain in vivo1. However, the estimation of the irreversible transverse relaxation T2 is hampered by potential biases and/or long scan times. When performing T2 measurements at ultra-high fields using a multi-echo CPMG (Carr-Purcell-Meiboom-Gill) sequence2,3, stimulated echoes caused by the inhomogeneous pattern of the B1 transmit field and degradation in the slice profile of a 2D sequence violate the assumption of a simple exponential decay 4,5,6. The problem can be solved by simulating the spin response to a given multi-echo spin-echo (MESE) sequence using the Bloch equations for a wide range of parameters and searching for the best matching curve to the acquired data7. In the presented study, we investigated the accuracy and robustness of this method applied to data acquired with sub-millimetre resolution at an ultra-high field strength of 7 Tesla.Material & Methods
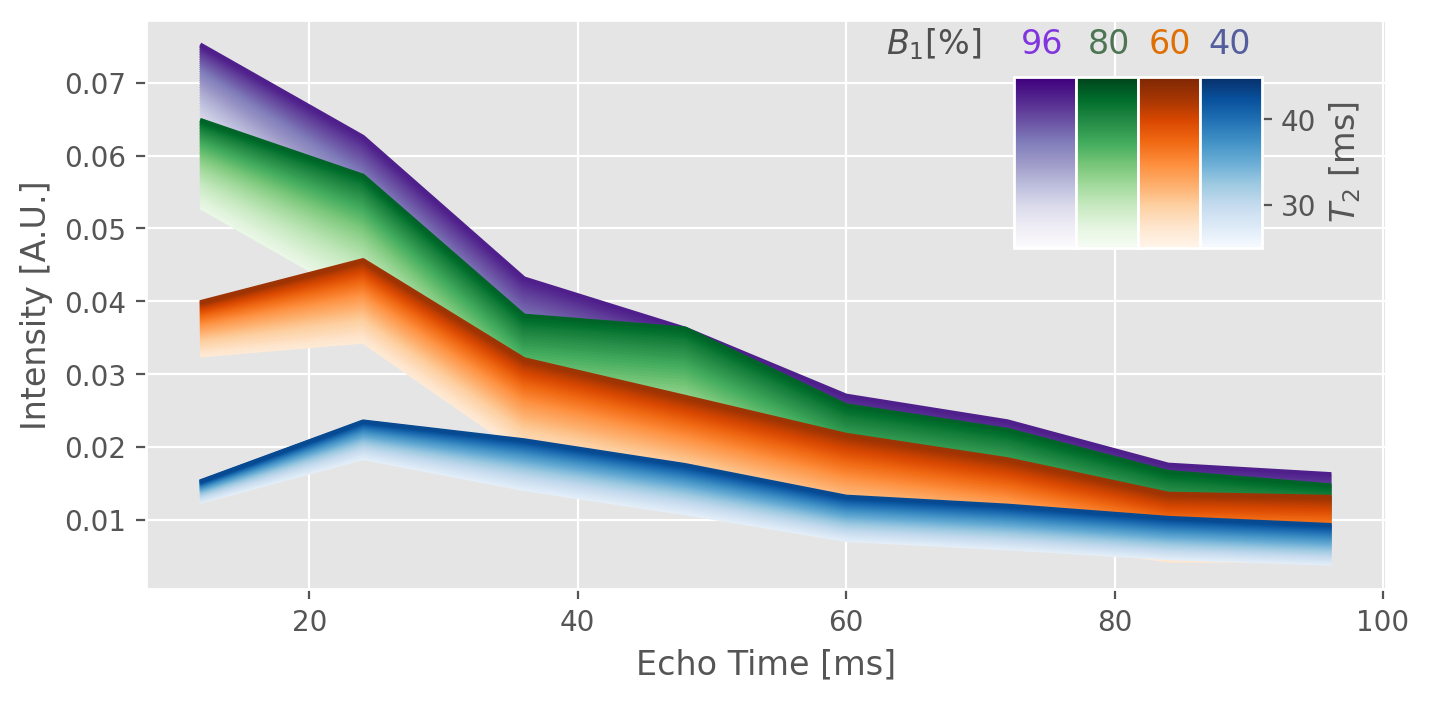
All measurements were conducted on a 7T scanner using a 32-channel RF receive head coil. For quantitative reference, a standard single spin-echo (SSE) technique8 was used to acquire 8 slices with 5 different echo times (TE = 12, 24, 48, 96, 150 ms), which took ≈ 32:30 min, at 1mm isotropic resolution. Slices were chosen to cover a range of different brain features. A CPMG sequence, aligned to the same slices, was used with nominal refocussing pulses of 180°. SAR limitations caused a reduction in the echo-train length to ETL = 15 (echo-spacing = 12.1 ms) and the tailored slice-selective gradients (VERSE9). Total scan time for a 1mm isotropic resolution scan amounts to ≈ 6:40 min. Higher resolutions (0.6mm isotropic) were achieved in ≈ 14 min.The simulation of the response curves is based on the echo-modulation curve (EMC) approach7,10. This was adopted in a self-written python package tailored to Siemens IDEA sequence simulations. Signal response curve databases were obtained for a range of T2 values (0 - 200 in steps of 1 ms, 200 - 500 in steps of 5 ms) and B1 offsets (0.6 - 1.2 in steps of 0.02). A Rician noise mean correction for bias reduction of low intensity echoes was included. Noise characteristics were extracted from sample free regions of the echo magnitude data. Figure 1 depicts excerpts from database curves for different B1 efficiencies and T2 values. The best matching curve, i.e. minimizing the l2 norm of the vector difference of signal response curve and signal points per voxel, was found by a brute force searching algorithm. Processed quantitative T2 maps were compared against SSE reference data modelled with a mono-exponential signal description.
Results
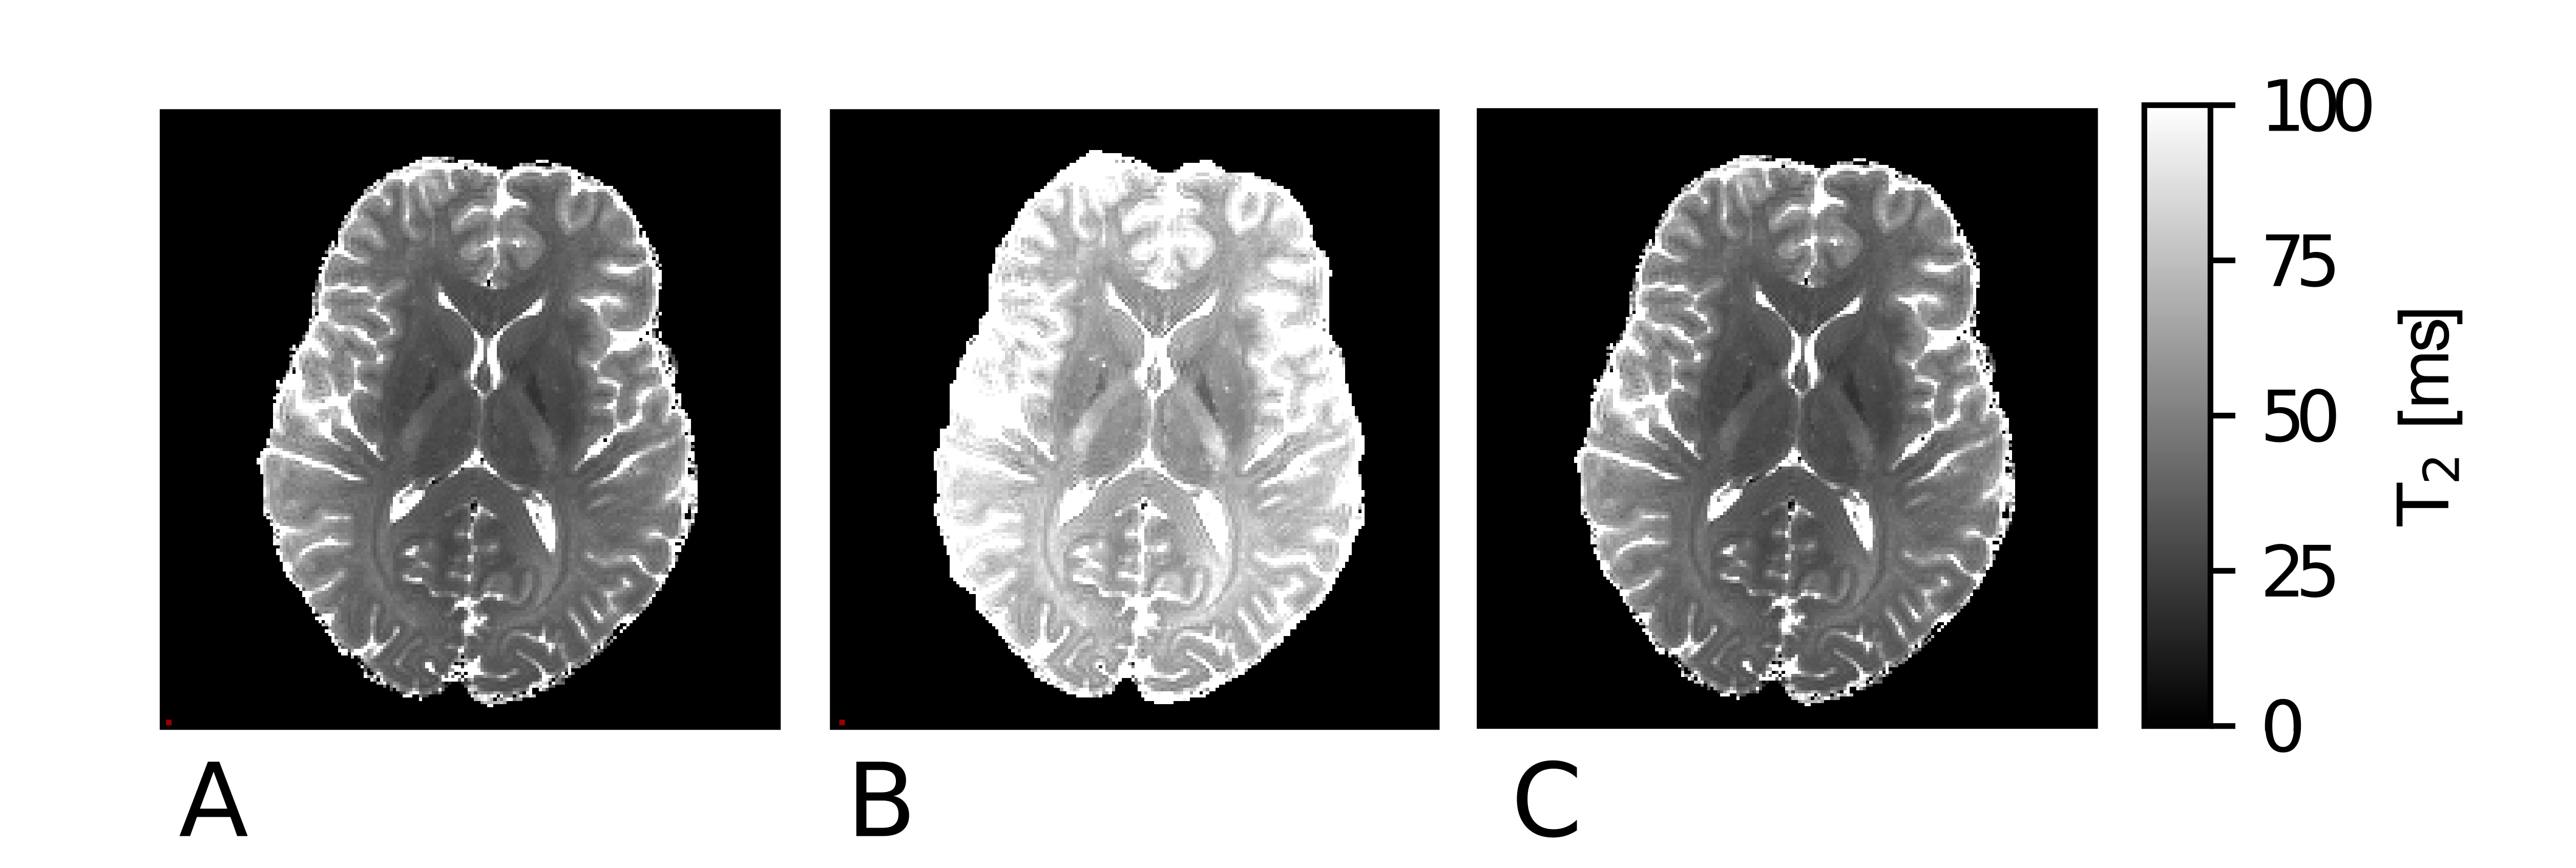
One slice of a T2 map, produced with the SSE reference acquisition, is given in Figure 2 A. The values are in good agreement with previously reported 7T data11. The MESE method yields qualitative T2 maps in feasible time. If fitted to an exponential decay, T2 was overestimated for all tissue compartments (Fig. 2 B). This is expected, besides higher T2 values, an inefficient transmit field can result in flattened decay characteristics, as predicted in Figure 1. Fitting the acquired MESE data with EMC, quantitative agreement with the reference T2 values is achieved (Figure 2 C).A T2 map with sub-millimetre resolution of 0.6 mm isotropic is shown in Figure 3. Imperfect bias field corrections are still apparent in temporal brain regions, where B1 inhomogeneities at 7T are typically pronounced. Especially with a 1-channel transmit system, signal drop-outs at inferior slices can be too severe for correction. Acquisition of a SSE data set of comparable resolution was not possible due to infeasible scan durations (> 60 min).
Discussion
The MESE approach reduces the scan time to a range used in clinical settings, while acquiring enough echoes to estimate reliable T2 maps. At ultra-high field strength, bias transmit field effects lead to imperfect phase-reversals and stimulated echo pathways. Hence, modelling the MESE signal by an exponential decay results in overestimation of the T2 value in all brain tissue compartments. Simulating the signal response to the exact sequence parameters and subsequently choosing the best fit of the obtained relaxation curves to the acquired data can solve this problem. Comparison with the SSE acquisition shows the accuracy of the suggested approach. Due to the above mentioned problems, steady state or gradient echo based acquisition schemes are also used for T2 mapping12,13,14, with the advantage of lower SAR and scan time demands, however, at the cost of inferior quantitative accuracy15. Obtaining accurate T2 values at sub-millimetre resolution is a challenge for all approaches, only a few studies presented data with comparable resolution (0.8 - 1.2 mm isotropic)12,13,14. It needs to be mentioned that, in our study, the signal decay within a voxel was assumed to be driven by a single value, which is not necessarily correct for all tissue compartments16. However, our framework can be extended to consider multiple T2 values and other effects such as variable refocussing flip angles and/or magnetization transfer.Conclusion
We demonstrate in vivo T2 mapping with sub-millimetre resolution at 7T with clinically feasible acquisition times. The proper simulation of CPMG signal evolution using EMC is key to accurate quantitative T2 estimation and low artefact levels.Acknowledgements
No acknowledgement found.References
1. Edwards, L. J., Kirilina, E., Mohammadi, S. & Weiskopf, N. Microstructural imaging ofhuman neocortex in vivo. NeuroImage 182, 184–206 (2018).
2. Carr, H. Y. & Purcell, E. M. Effects of diffusion on free precession in nuclear magneticresonance experiments. Physical Review 94, 630–638 (1954).
3. Meiboom, S. & Gill, D. Modified spin-echo method for measuring nuclear relaxationtimes. Review of Scientific Instruments 29, 688–691 (1958).
4. Van De Moortele, P. F. et al. B1destructive interferences and spatial phase patterns at 7T with a head transceiver array coil. Magnetic Resonance in Medicine 54, 1503–1518(2005).
5. Vaughan, J. T. et al. 7T vs. 4T: RF power, homogeneity, and signal-to-noise comparisonin head images. Magnetic Resonance in Medicine 46, 24–30 (2001).
6. Uddin, M. N., Marc Lebel, R. & Wilman, A. H. Transverse relaxometry with reducedecho train lengths via stimulated echo compensation. Magnetic Resonance in Medicine70, 1340–1346 (2013).
7. Ben-Eliezer, N., Sodickson, D. K. & Block, K. T. Rapid and accurate T2 mapping frommulti- spin- echo data using Bloch- simulation- based reconstruction. Magnetic Reso-nance in Medicine 73, 809–817 (2015).
8. Hahn, E. Spin Echoes. Physical Review 80, 580–594 (1950).
9. Hargreaves, B. A., Cunningham, C. H., Nishimura, D. G. & Conolly, S. M. Variable-rateselective excitation for rapid MRI sequences. Magnetic Resonance in Medicine 52, 590–597 (2004).
10. Ben-Eliezer, N. et al. Accelerated and motion-robust in vivo T 2 mapping from radiallyundersampled data using bloch-simulation-based iterative reconstruction. MagneticResonance in Medicine 75, 1346–1354 (2016).
11. Zhu, J. et al. Relaxation measurements in brain tissue at field strengths between 0.35Tand 9.4T. Proceedings of the International Society of Magnetic Resonance in Medicine22, 6286 (2014).
12. Massire, A. et al. Parallel-transmission-enabled three-dimensional T2-weighted imag-ing of the human brain at 7 Tesla. Magnetic Resonance in Medicine 73, 2195–2203(2015).
13. Deoni, S. C. Transverse relaxation time (T2) mapping in the brain with off-resonancecorrection using phase-cycled steady-state free precession imaging. Journal of Mag-netic Resonance Imaging 30, 411–417 (2009).
1. Zi, R., Zhu, D. & Qin, Q. Quantitative T2 mapping using accelerated 3D stack-of-spiralgradient echo readout. Magnetic Resonance Imaging 73, 138–147 (2020).
15. Teixeira, R. P. A., Malik, S. J. & Hajnal, J. V. Joint system relaxometry (JSR) and Crámer-Rao lower bound optimization of sequence parameters: A framework for enhanced precision of DESPOT T1 and T2 estimation. Magnetic Resonance in Medicine 79, 234–245 (2018).
16. Mackay, A. et al. In vivo visualization of myelin water in brain by magnetic resonance.Magnetic Resonance in Medicine 31, 673–677 (1994).
Figures