3048
T1 mapping of the ISMRM/NIST system phantom at 7T.1Sir Peter Mansfield Imaging Centre, UP, University of Nottingham, Nottingham, United Kingdom, 2Max Planck Institute for Human Cognitive and Brain Sciences, Leibzig, Germany, 3NIHR Nottingham Biomedical Research, University of Nottingham, Nottingham, United Kingdom
Synopsis
We report the quantitative T1 values of the NIST/ISMRM system phantom T1 and T2 spheres at 7T. We compare the accuracy and repeatability of T1 measurements using a 2D multi-slice multi-shot IR-EPI sequence, to 3D MP2RAGE and standard single-slice IR sequences at 3 and 7 T. We show that T1 measurements are more accurate using MS-IR-EPI compared to MP2RAGE. The T2-spheres of the NIST/ISMRM system phantom are shown to be best suited for T1-mapping at 7T as they offer a wider range of T1-values, better matched than those of the T1-spheres to those found within the human brain.
Introduction
High spatial resolution quantitative T1 maps provide evidence of heavily myelinated cortical layers1, providing the basis for in-vivo parcellation of distinct cortical areas2. Currently, the most popular method for efficient T1 mapping at 7T is the 3D MP2RAGE sequence3. Recently we proposed a faster method based on 2D multi-slice multi-shot inversion recovery EPI (MS-IR-EPI)4 combined with slice order shifting across multiple acquisitions5 to provide a set of equally spaced distinct inversion times. Here, we assess the accuracy and repeatability of MP2RAGE and MS-IR-EPI T1 mapping at 7T against standard single slice IR-EPI T1 measurements.Methods
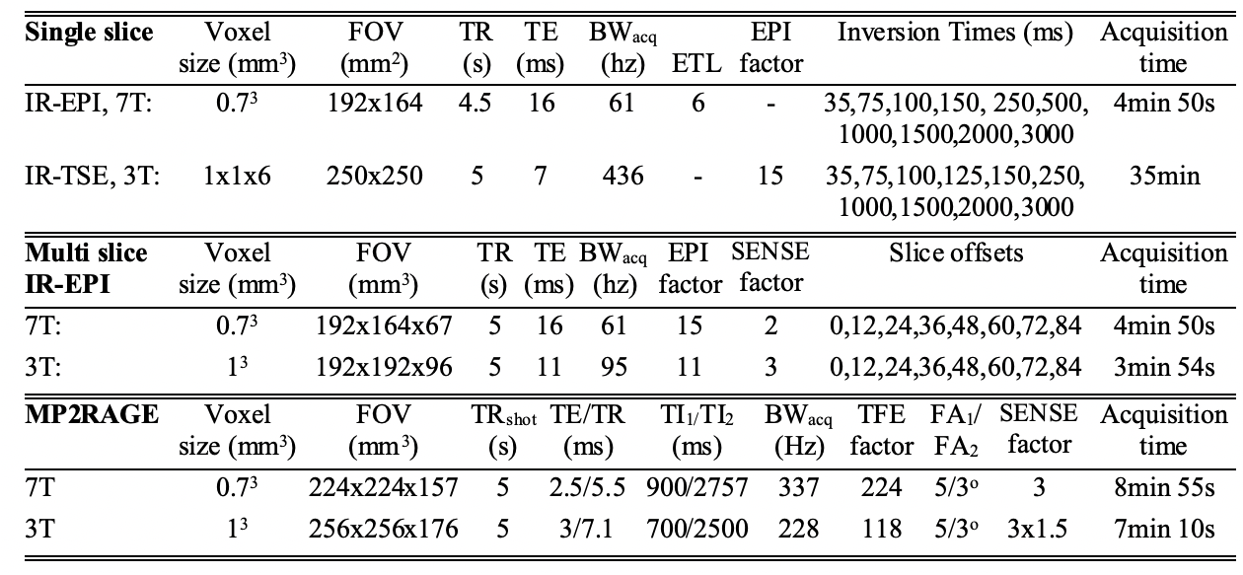
A subset of NIST/ISMRM6 NicCl2-doped T1-calibrated (T1_1 to T1_6) and MNCl2-doped T2-callibrated (T2_1 to T2_10) spheres with T1-values within the human brain range (>300ms)7 were assessed. Home-built casings were built to fit each plate of T1-spheres and T2-spheres within a separate 160mm diameter spherical phantom which would fit within the 7T NOVA head coil. Reference T1 measurements were obtained using standard single slice IR-TSE at 3T and single slice IR-EPI at 7T. T1 measurements were collected at both 3T and 7T using MP2RAGE and MS-IR-EPI acquisitions. Figure 1 provides image parameters for each protocol. A B1-map was acquired to compute the effective excitation flip angles for improved accuracy of T1 maps derived with a MP2RAGE look-up table. T1 maps for single slice IR-EPI and MS-IR-EPI data were computed by least squares linear regression fit of the polarity corrected modulus data to a mono-exponential T1-recovery curve: S(TI) = S0[1-2exp(−TI/T1)+exp(-TR/T1)]. Repeated measurements were collected for the T1-spheres/T2-spheres at 3T (2/3 repeats) and 7T (4/6 repeats) and the coefficient of variation (CoV) computed as the ratio of standard deviation to mean T1-values across all repeats7. T1-values obtained with MS-IR-EPI and MP2RAGE were compared with those obtained with the reference single slice IR-EPI method.Results
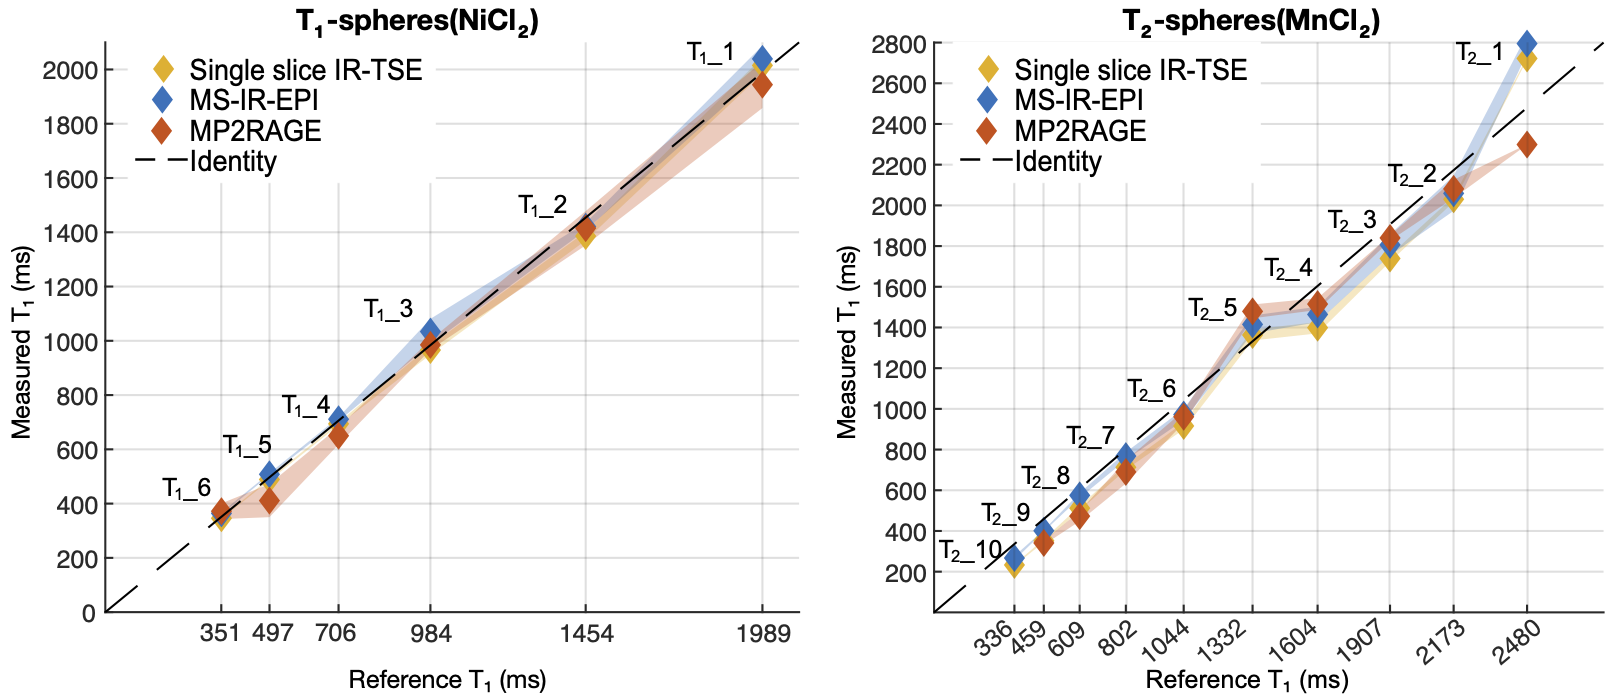
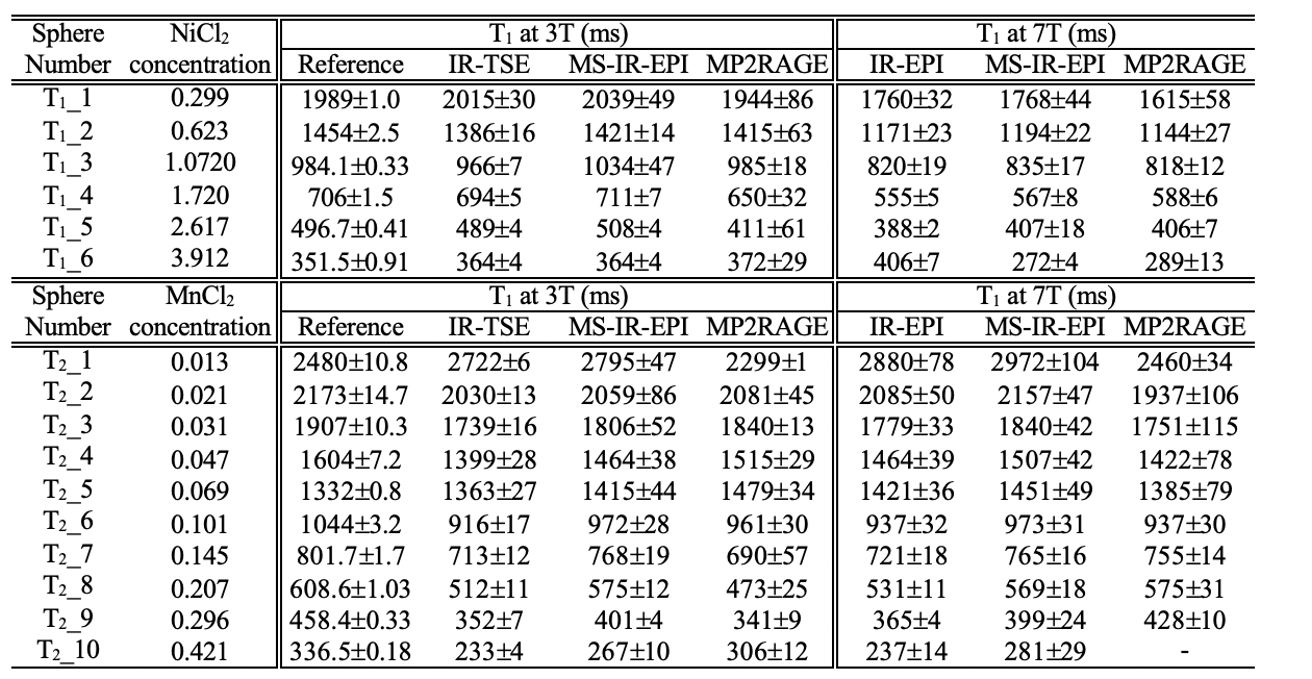
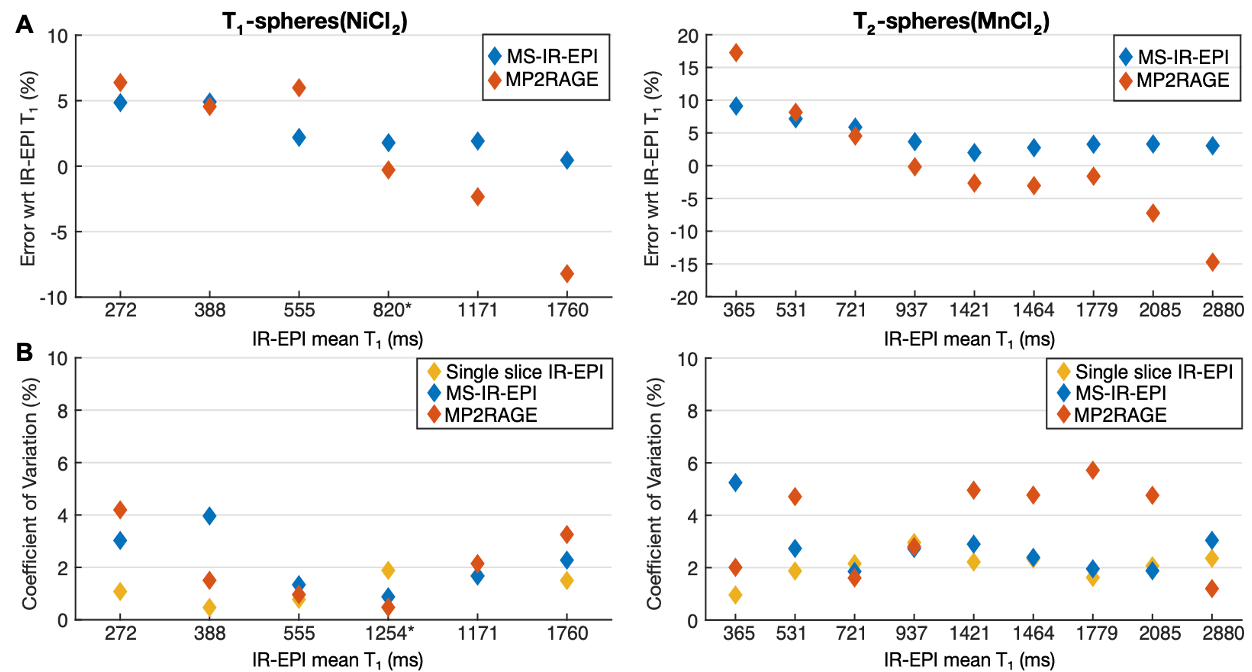
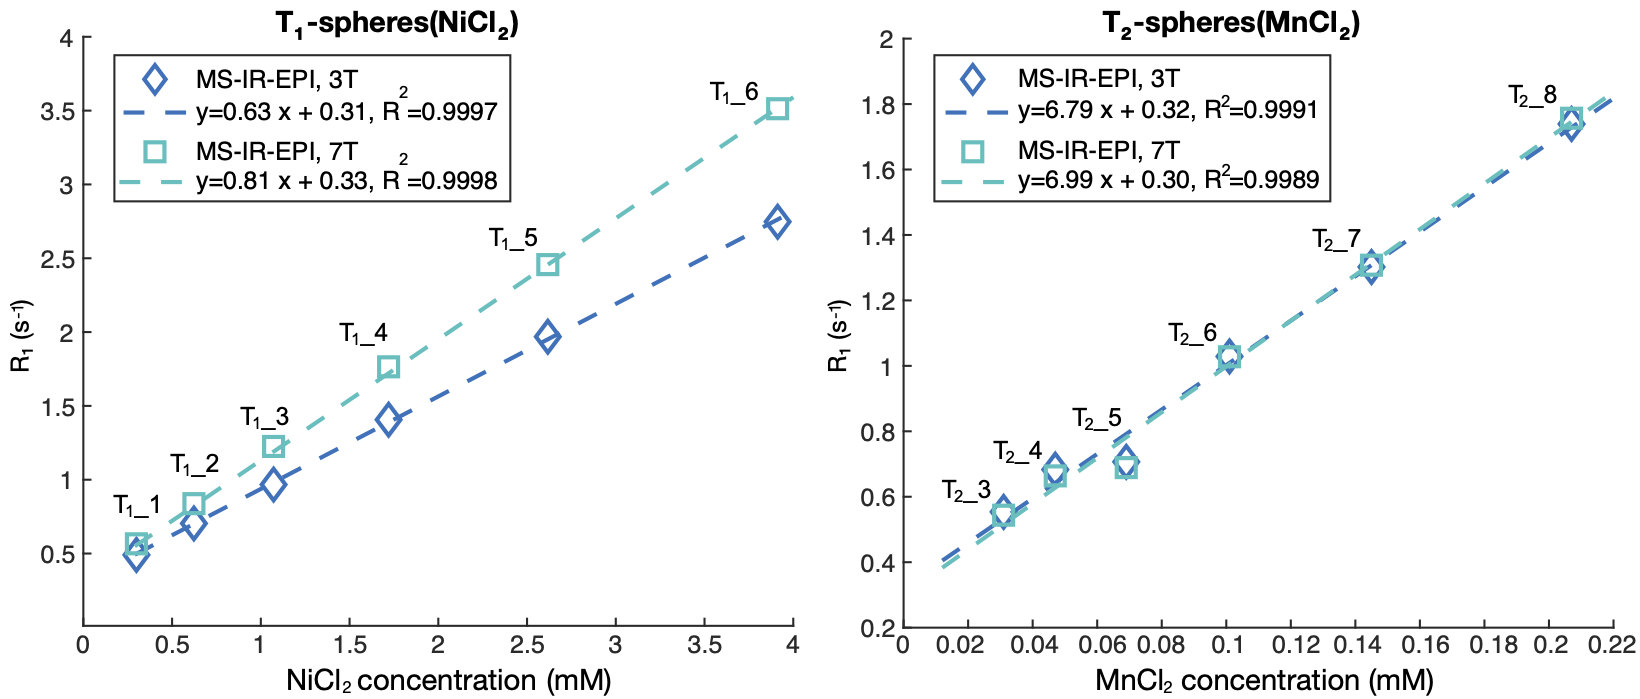
The mean temperature of the T1-spheres /T2-spheres phantoms was 21.2/20.0 oC at 3T and 20.5/20.4 oC at 7T. At 3T, linear regression analysis of the T1 measurements against the NIST reference T1-values showed a strong linear correlation for the T1-spheres (R2=0.9976/0.9976/0.9962) and T2-spheres (R2=0.9780/0.9767/0.9838) using IR-TSE/MS-IR-EPI/MP2RAGE respectively (Figure 2). T1 measurements for the T2-spheres were shorter than the NIST reference T1-values, except for T2_1 and T2_5 spheres, which were longer (by 9.2 and 2.3% respectively, IR-TSE). Since T2_10 was below 300ms, this sphere was excluded from further analysis. Sphere T1_3 exhibited a large increase in T1 with time (across a 9-month period) but consistently across the T1 mapping methods used, the accuracy was evaluated in the first measurement alone. At 7T, compared to 3T, T1-values were slightly longer for the T2-spheres but shorter for the T1-spheres (Figure 3). Figure 4A shows the error of T1-measures obtained with MS-IR-EPI and MP2RAGE with respect to single slice IR-EPI at 7T. The accuracy of MS-IR-EPI is better than 5% for all spheres except for the three T2-spheres with shortest T1-values, while MP2RAGE shows poor accuracy for those spheres with the longest T1 (overestimation of ~14/7/8% for T2_1/T2_2/T1_1) compared with MS-IR-EPI (3.2/3.5/0.5%). Figure 4B shows the repeatability of T1 measurements at 7T (last 4 repeats across 10-day window for sphere T1_3). CoVs of T1 values were smaller for the T1- than for T2-spheres, and in general lowest for single slice IR-EPI measures, and largest for MP2RAGE measures. The CoV for MS-IR-EPI measures for spheres was below 3.5% for T1s> 400ms. Linear fits of the longitudinal relaxation rates (R1) measured with each method versus the NiCl2 (T1-spheres) and MnCl2 (T2 _3 to T2_8 spheres) nominal concentrations (Figure 3D shows MS-IR-EPI data) yield a relaxivity (r) of 0.66/0.63/0.65 and 0.86/0.81/0.79 s-1mM-1 (single slice IR/MS-IR-EPI/MP2RAGE) for NiCl2 at 3T and 7T respectively, and r=7.86/6.79/9.00 and 7.65/6.99/6.72 s-1mM-1 for MNCl2 at 3 and 7T.Discussion
We report quantitative T1-values of the T1- and T2- spheres in the ISMRM/NIST system phantom at 7T using differing T1 mapping methods, and at 3T we compare measured values with reference T1-values provided by NIST at 3T. Both the T1 mapping accuracy (with respect to the standard single slice IR measure) and repeatability of MS-IR-EPI was superior to MP2RAGE. In particular, for long T1-values (>1800ms) MS-IR-EPI provides good accuracy while MP2RAGE underestimates T1, suggesting a longer TRshot is required for MP2RAGE to accurately measure T1 in grey matter tissue. The reduction in the T1-values of the T1-spheres at 7T compared with 3T is in line with the increased relaxivity of NiCl2 (0.63/0/81s-1mM-1 measured with MS-IR-EPI at 3/7T), consistent with previous work reporting r=0.62s-1mM-1 at 3T8 and r=0.93±0.23s-1mM-1 at 7T9. Our measures of relaxivity of MnCl2 were similar at 3T and 7T and comparable to values of r=6.397s-1mM-1 [8] and r=7.4s-1mM-1 [10] reported for MnCl2 at 3T, and r=6.37s-1mM-1 reported at 7T11.Conclusion
MS-IR-EPI is a fast and more accurate alternative to MP2RAGE for high spatial resolution T1 mapping. Although the accuracy (with respect NIST T1 reference values) was better for the T1-spheres than the T2- NIST phantom spheres, the T2-spheres are better suited for 7T as they offer a wider range of T1-values which more closely matches values found within the human brain at 7T, due to the increased relaxivity of NiCl2 within the T1-spheres with field strength.Acknowledgements
This work was funded by a Leverhulme Trust fellowship to RSP and supported by the UK Medical Research Council [grant number MR/M022722/1].References
1. Stüber C, Morawski M, Schaeffer A et al. Myelin and iron concentration in the human brain: A quantitative study of MRI contrast. Neuroimage. 2014;93(1):95-106.
2. Turner R. Myelin and modeling: Bootstrapping cortical microcircuits. Front. Neural Circuits. 2019;13:34.
3. Marques JP, Kober T, Krueger G, et al. MP2RAGE, a self bias-field corrected sequence for improved segmentation and T1-mapping at high field. NeuroImage, 2010;49(2): 1271–81.
4. Sanchez Panchuelo RM, Turner R., Mougin OE and Francis ST. A 2D multi- shot IR EPI T1 mapping. Proc. Intl. Soc. Mag. Reson. Med., Paris, 2018; #26.
5. Ordidge RJ, Gibbs P, Chapman B, et al. (1990). High‐ speed multislice T1 mapping using inversion‐recovery echo‐planar imaging. Magn. Reson. Med. 1990;16, 238–245.
6. Keenan KE, Stupic KF, Boss MA, et al. Multi-site, multi-vendor comparison of T1 measurement using ISMRM/NIST system phantom. Proc. Intl. Soc. Mag. Reson. Med, Singapore, 2016;#3290.
7. Kato Y, Ichikawa K, Okudaira K et al. Comprehensive Evaluation of B1+-corrected FISP-based Magnetic Resonance Fingerprinting: Accuracy, Repeatability and Reproducibility of T1 and T2 Relaxation Times for ISMRM/NIST System Phantom and Volunteers. Mag. Reson. Med. Sci. 2020;19(3):168-175.
8. Thangavel K, Ulkü E, and Saritas S. Aqueous paramagnetic solutions for MRI phantoms at 3T: A detailed study on relaxivities. Turkish J. Electr. Eng. Comput. Sci. 2017;25, 2108–2121.
9. Rooney WD, Johnson G, Li X et al. Magnetic field and tissue dependencies of human brain longitudinal 1H2O relaxation in vivo. Magn. Reson. Med. 2007;57,308–318.
10. Nofiele JT and Cheng HLM. Ultrashort Echo Time for Improved Positive- Contrast Manganese-Enhanced MRI of Cancer. PLoS One, 2013; 8(3), e58617.
11. Castets CR, Ribot EJ, Lefrançois W, et al. Fast and robust 3D T 1 mapping using spiral encoding and steady RF excitation at 7 T: application to cardiac manganese enhanced MRI (MEMRI) in mice. NMR Biomed. 2015;28, 881–889.
Figures