3047
High-resolution T2 maps of the whole brain at 7 Tesla: a proof of concept study using adiabatic T2-prepared FLASH and compressed sensing1Advanced Clinical Imaging Technology, Siemens Healthcare AG, Bern, Switzerland, 2Translational Imaging Center, sitem-insel AG, Bern, Switzerland, 3Departments of Radiology and Biomedical Research, University of Bern, Bern, Switzerland, 4Siemens Healthcare GmbH, Erlangen, Switzerland, 5Advanced Clinical Imaging Technology, Siemens Healthcare AG, Lausanne, Switzerland, 6Department of Radiology, University Hospital (CHUV) and University of Lausanne (UNIL), Lausanne, Switzerland, 7LTS5, École Polytechnique Fédérale de Lausanne, Lausanne, Switzerland
Synopsis
T2 relaxometry has the potential to become an important quantitative MRI biomarker thanks to its sensitivity to pathology. However, acquiring high-resolution isotropic T2 maps is challenging due to signal-to-noise and specific absorption rate constraints. We present a T2-mapping method for ultra-high-field MRI based on an optimized T2-prepared acquisition with compressed sensing acceleration. The T2 preparation uses adiabatic pulses in conjunction with a segmented FLASH sequence to obtain uniform whole-brain T2 weighting despite B1 inhomogeneity. Preliminary tests show good signal homogeneity for images and maps obtained in a scan time compatible with volunteer studies.
INTRODUCTION
T2-weighted imaging and relaxometry play an important role in the study of gray and white matter pathologies [1,2]. However, conventional spin-echo and multi-echo spin-echo sequences are limited to 2D imaging or small-3D-slab applications with anisotropic resolution due to specific-absorption-rate (SAR) and acquisition time (TA) limitations. T2-preparation approaches [3] combined with fast, segmented sequences [4] can be used as an alternative for isotropic high-resolution 3D T2-weighted imaging and mapping of the entire brain [5]. However, large volumetric coverage also requires long TA and resolution is often traded for signal. Ultra-high-field MRI has recently become available for clinical examinations and may be used to leverage increased signal. Additionally, since T2 changes with field strength, there is a potential for seeing structures or detecting changes that are not apparent at lower field strengths. Here, we present an accelerated segmented 3D FLASH sequence with an adiabatic T2 preparation for T2 mapping of the entire brain at 7T with sub-millimetric resolution. We show preliminary tests of the proposed method in a phantom and in vivo.METHODS
IRB-approved experiments were performed at 7T (MAGNETOM Terra, Siemens Healthcare, Erlangen, Germany) using an 8-channel TX/32-channel RX head coil in circular polarized mode (Nova Medical, Wilmington, MA), first with a multi-purpose phantom (5 compartments with different concentrations of MnCl2·4H2O, Siemens) for sequence optimization and T2 characterization, and then in a healthy subject (female, 33yo) for proof of concept.Images were acquired with a segmented 3D FLASH [4] prototype sequence employing a Cartesian variable-density spiral-phyllotaxis sampling pattern [6] in the two phase-encoding directions with 5-fold acceleration. Readouts of the FLASH block followed a center-out radial-like trajectory (Figure 1A). An adiabatic T2-preparation module was obtained modifying a B1-Insensitive Rotation (BIR-4) pulse with symmetric delays between the tip-down, refocusing and tip-up segments [7], and was played out before each readout train (Figure 1B). The tip-down/tip-up inter-pulse duration (T2p-time) was changed to obtain different T2 weightings. To ensure adiabaticity, the RF-excitation angles were optimized (tip-up/down=1000°, refocusing pulse=2000°). Three volumes were acquired consecutively with T2p-times of 25, 62.5, and 100 ms. Other protocol parameters were: 7° FLASH RF-excitation angle, 128 readouts/TR, FLASH-TR/TE=7.4/1.9 ms, FOV=256x192x256 mm3, resolution=0.8x0.8x0.8 mm3, sagittal orientation. Due to SAR limitations, TR was set to 5.5 s, yielding TA=8:40 min/volume.
Image reconstruction was performed on the scanner with a prototype compressed sensing algorithm [8]. T2 maps were generated offline (MATLAB, The MathWorks Inc., Natick, MA) from the different volumes using a log-linear voxel-wise fit of $$$M_{t}=M_{0}\exp(-t/T_{2})$$$, with t denoting the T2p-time.
For the phantom study, a 2D spin-echo sequence with ten incremental TEs (TE=10 to 100 ms, TR=3 s, 1.5x1.5x4-mm3 voxel size) was used as reference. Median values were computed from manually drawn ROIs in five different T2 compartments for the spin-echo and the proposed T2-prepared FLASH sequence, and were compared in a scatter plot.
For the subject experiment, an MP2RAGE [9] sequence was acquired as anatomical reference for automated segmentation of volumes-of-interest (VOI). For offline analysis, the three T2-prepared volumes were rigidly registered [10] before T2 fitting to account for motion between volumes. Masks of nine bilateral VOIs were obtained using the prototype segmentation software MorphoBox [11] and registered [10] to the native space of the T2 map. Median T2 values were extracted from each VOI.
RESULTS AND DISCUSSION
All 3D T2-prepared FLASH scans were reconstructed directly on the scanner hardware in approximately 2 min/volume.Reference median T2 values in compartments #1 to #5 were found to be 104/52/27/14/10 ms using the spin-echo sequence (Figure 2A). Compartments #4 and #5 could not be estimated with the T2-prepared sequence since the shortest T2p-time was 25 ms. T2 values of compartments #1 to #3 were best fitted using only T2p-time=25 and 62.5 ms yielding T2 values of 87/57/23 ms (Figure 2B). Fair agreement can be observed in a scatter plot for these three compartments between the proposed and reference method (Figure 2C).
In vivo, good image quality and contrast in the different T2 weightings and throughout the brain (with a slight signal drop in the cerebellum) could be observed (Figure 3). A signal-shift-like artifact was noted at the level of the cerebrospinal fluid in all T2 weightings and remains to be investigated (arrows, Figure 3).
Orthogonal views of the T2 map show homogenous distribution of T2 values and good definition of gray and white matter structures also in the central brain (Figure 4). However, the fitting may be compromised in the inferior area of the cerebellum as shown by the abrupt increase in values.
A quantitative analysis shows VOI T2 values between 40 and 50 ms for white and gray matter, and lower values in Thalamus and Putamen (Figure 5).
CONCLUSION
High-resolution T2 mapping of the whole brain at 7T is feasible with the proposed method, where future work should aim at reducing scan times to a clinically acceptable level. In a phantom test, the proposed T2-prepared method showed agreement with the reference method for T2 values in the range of those expected in the brain. While more phantom and in vivo validation is warranted, the proposed method showed good detail of the anatomy and proves feasibility for T2-prepared relaxometry at ultra-high field.Acknowledgements
No acknowledgement found.References
- van der Kolk AG, et al. Intracranial Vessel Wall Imaging at 7.0-T MRI. Stroke 2011;42:2478–2484.
- Saranathan M, et al. Optimization of Magnetization-Prepared 3-Dimensional Fluid Attenuated Inversion Recovery Imaging for Lesion Detection at 7 T. Invest Radiol 2014;49:290–298.
- Brittain JH, Hu BS, Wright GA, Meyer CH, Macovski A, Nishimura DG. Coronary angiography with magnetization-prepared T2 contrast. Magn Reson Med 1995;33(5):689-696.
- Haase A, Frahm J, Matthaei D, Hänicke W, Merboldt K‐D. FLASH imaging: rapid NMR imaging using low flip angle pulses. J Magn Reson 1986; 67: 258–266.
- Mussard, E. P. C., Hilbert, T., Forman, C., Meuli, R., Thiran, J. P., & Kober, T. (2017). High-resolution 3D T2 mapping of the Brain Using T2-prepared Cartesian Spiral Phyllotaxis FLASH and Compressed Sensing. In Intl. Soc. Mag. Reson. Med (Vol. 25).
- Forman C, et al. High-resolution 3D whole-heart coronary MRA: a study on the combination of data acquisition in multiple breath-holds and 1D residual respiratory motion compensation. Magn Reson Mater Phy 2014;27:435-443.
- Nezafat R at al., Spectrally Selective B1-Insensitive T2 MagnetizationPreparation Sequence Magnetic Resonance in Medicine 61:1326–1335 (2009)
- Wetzl J, Forman C, Wintersperger BJ, et al. High‐resolution dynamic CE‐MRA of the thorax enabled by iterative TWIST reconstruction. Magn Reson Med. 2017;77:833–840.
- Marques J. P., Kober T., Krueger G., van der Zwaag W., Van de Moortele P. F., Gruetter R. "MP2RAGE, a self bias-field corrected sequence for improved segmentation and T1-mapping at high field." Neuroimage, 49:1271–1281, 2010.
- S. Klein, M. Staring, K. Murphy, M.A. Viergever, J.P.W. Pluim, "elastix: a toolbox for intensity based medical image registration," IEEE Transactions on Medical Imaging (2010), vol. 29, no. 1, pp. 196 - 205.
- Schmitter, Daniel, et al. "An evaluation of volume-based morphometry for prediction of mild cognitive impairment and Alzheimer's disease." NeuroImage: Clinical 7 (2015): 7-17.
Figures
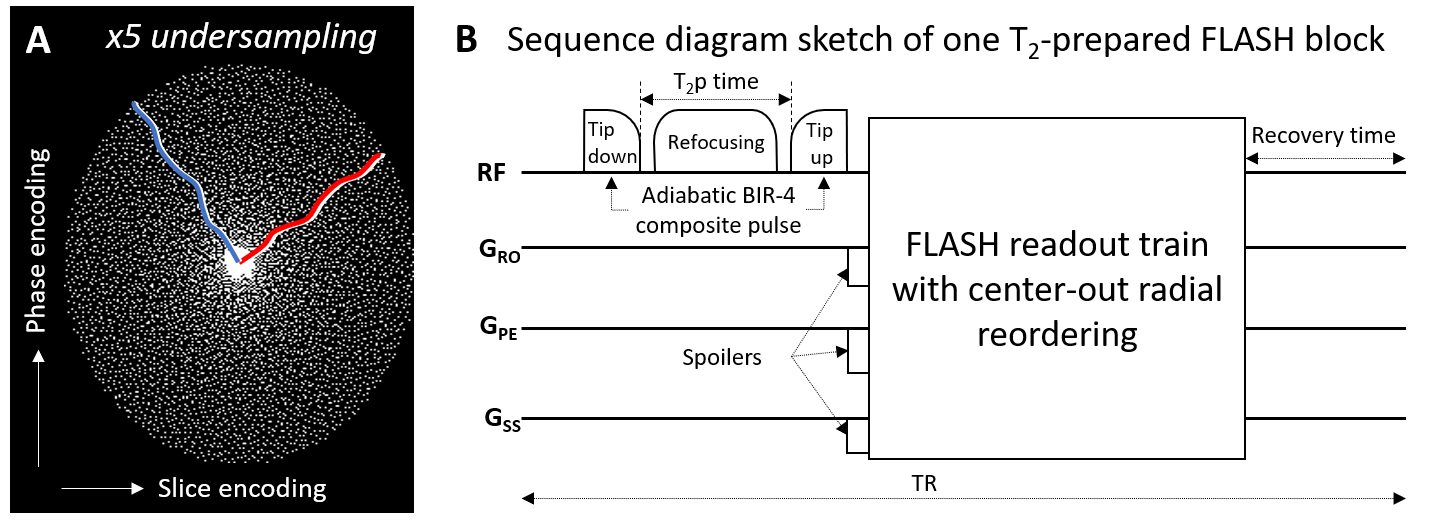
Figure 1
A) Cartesian spiral-phyllotaxis pattern in phase- and slice-encoding dimensions used for the 5-fold undersampled scan with the proposed segmented T2-prepared FLASH sequence. White dots indicate sampled readout lines. The red and blue lines show examples of the center-out radial-like reordering used in two FLASH segments. B) An adiabatic BIR-4 composite pulse was modified with delays between the pulse segments to be used as T2 preparation module with different T2p-times and is played out before the readout train.
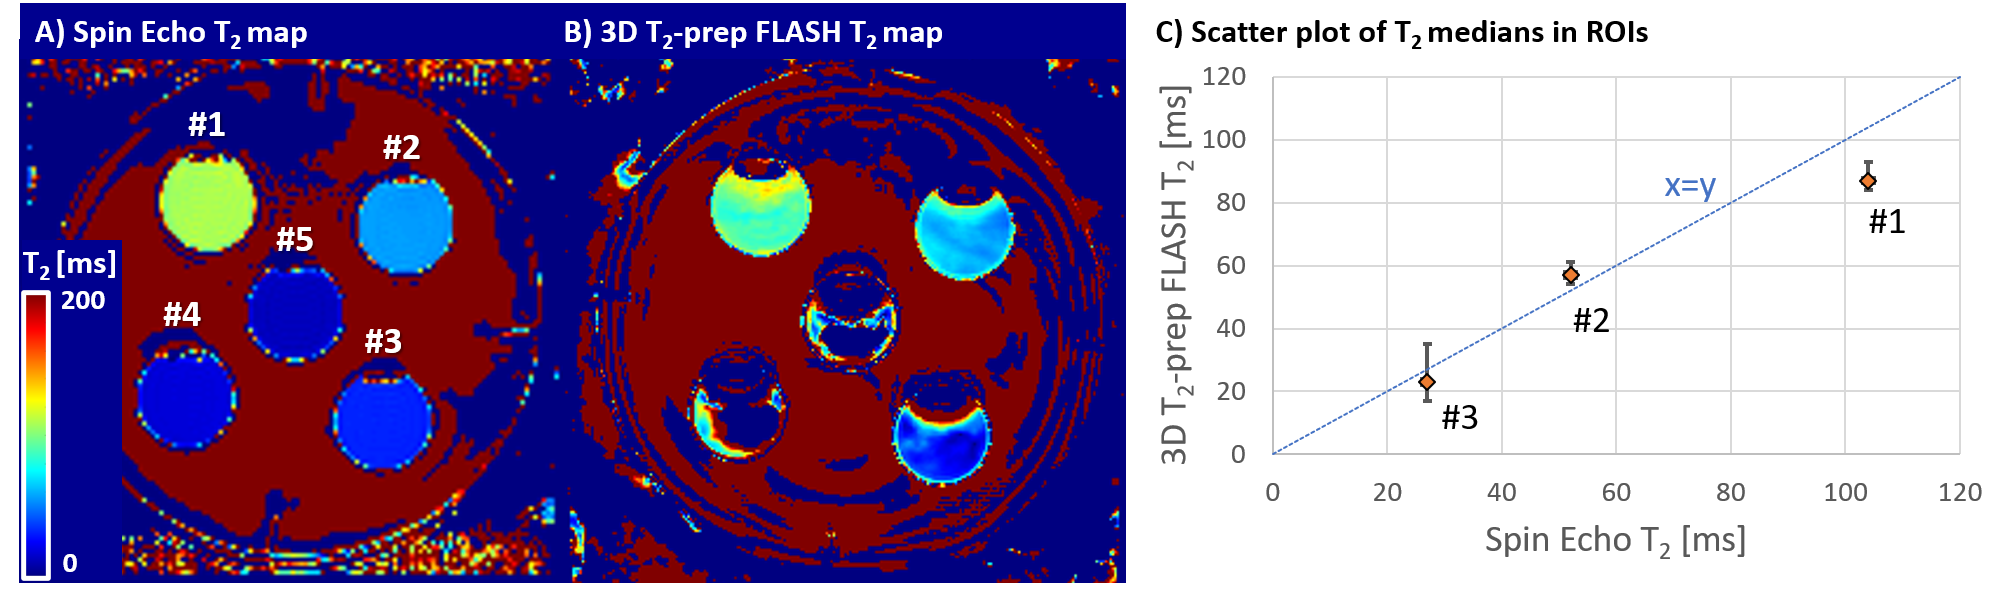
Figure 2
Phantom characterization of the T2-mapping sequence against reference spin-echo sequence. A) Using spin-echo with TE=10 to 40 ms, the T2 values of the compartments #1 to #5 could be estimated as: 104, 52, 27, 14, 10 ms. B) The 3D T2-prep using shortest T2p-time of 25 ms, limited by the refocusing pulse duration, could estimate #1 to #3 as 87, 57, 23 ms. C) Scatter plot of T2 medians shows agreement of the two sequences compared to the unity line (dashed, blue). Upper/lower (left/right) error bars indicate the 75/25 percentile.
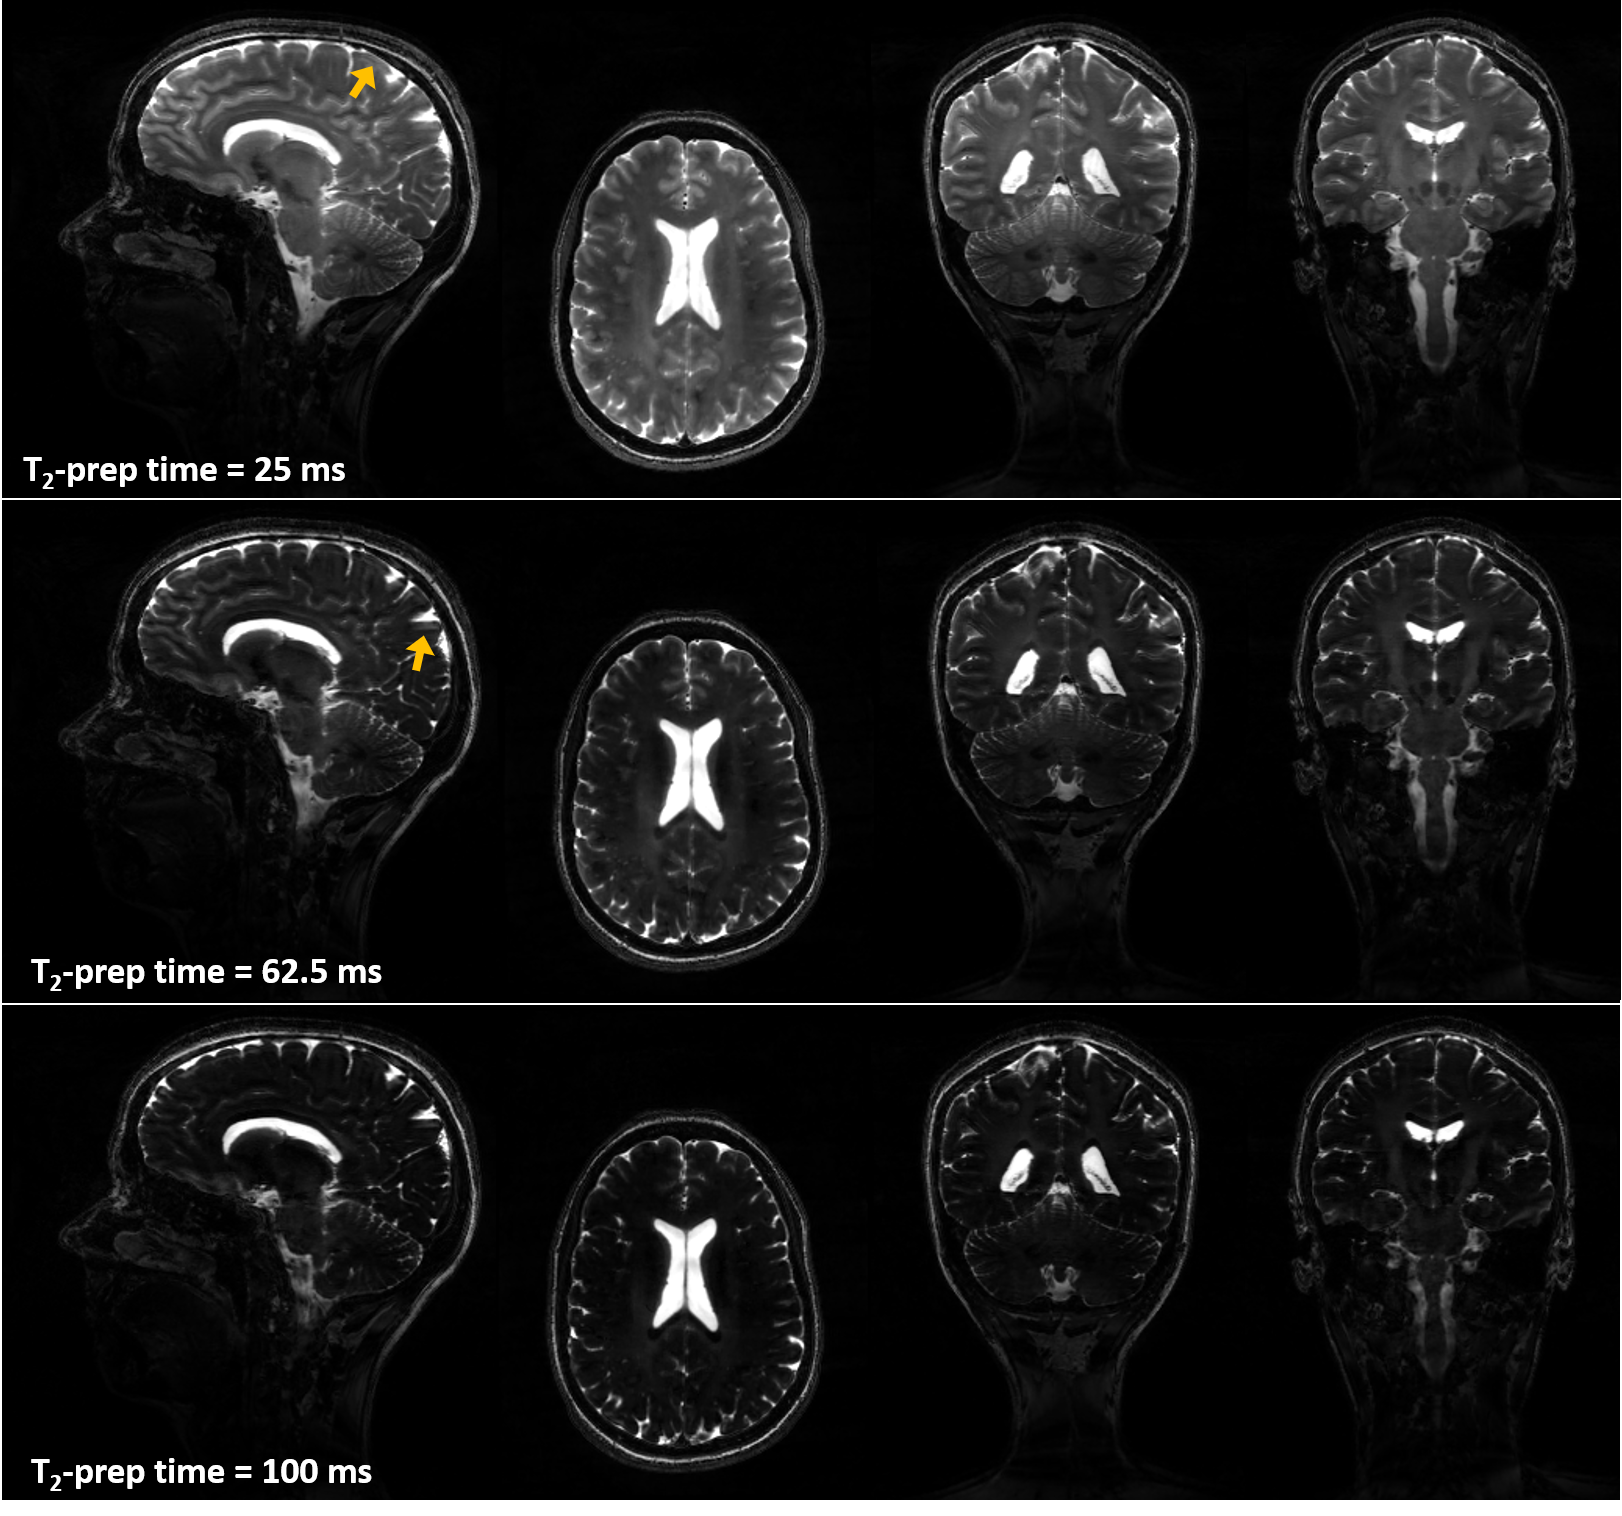
Figure 3
Orthogonal views of T2-prepared images obtained from a healthy subject show good contrast and increasing T2 weighting as a function of T2-prep time. Fair signal homogeneity can be observed till the basal area of the brain with a slight signal drop in the cerebellum. High level of detail can be observed in the cerebellum and corpus callosum in the coronal views as benefit from sub-millimetric resolution. Signal-shift artifacts originating from cerebrospinal fluid (arrows) can be observed and will be investigated.
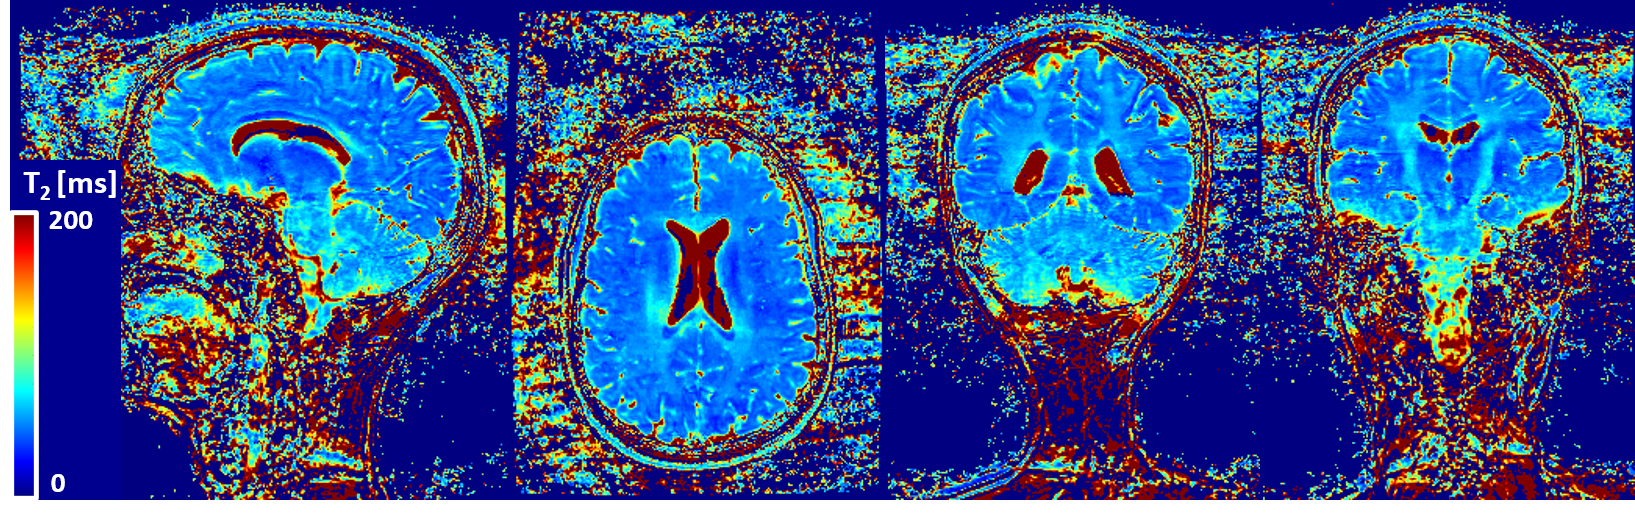
Figure 4
T2 map generated from T2-prepared volumes shown in figure 3. T2 values show good contrast between gray matter and white matter structures. T2 estimation may be compromised in the inferior portion of the cerebellum which may be due to B1 inhomogeneity.
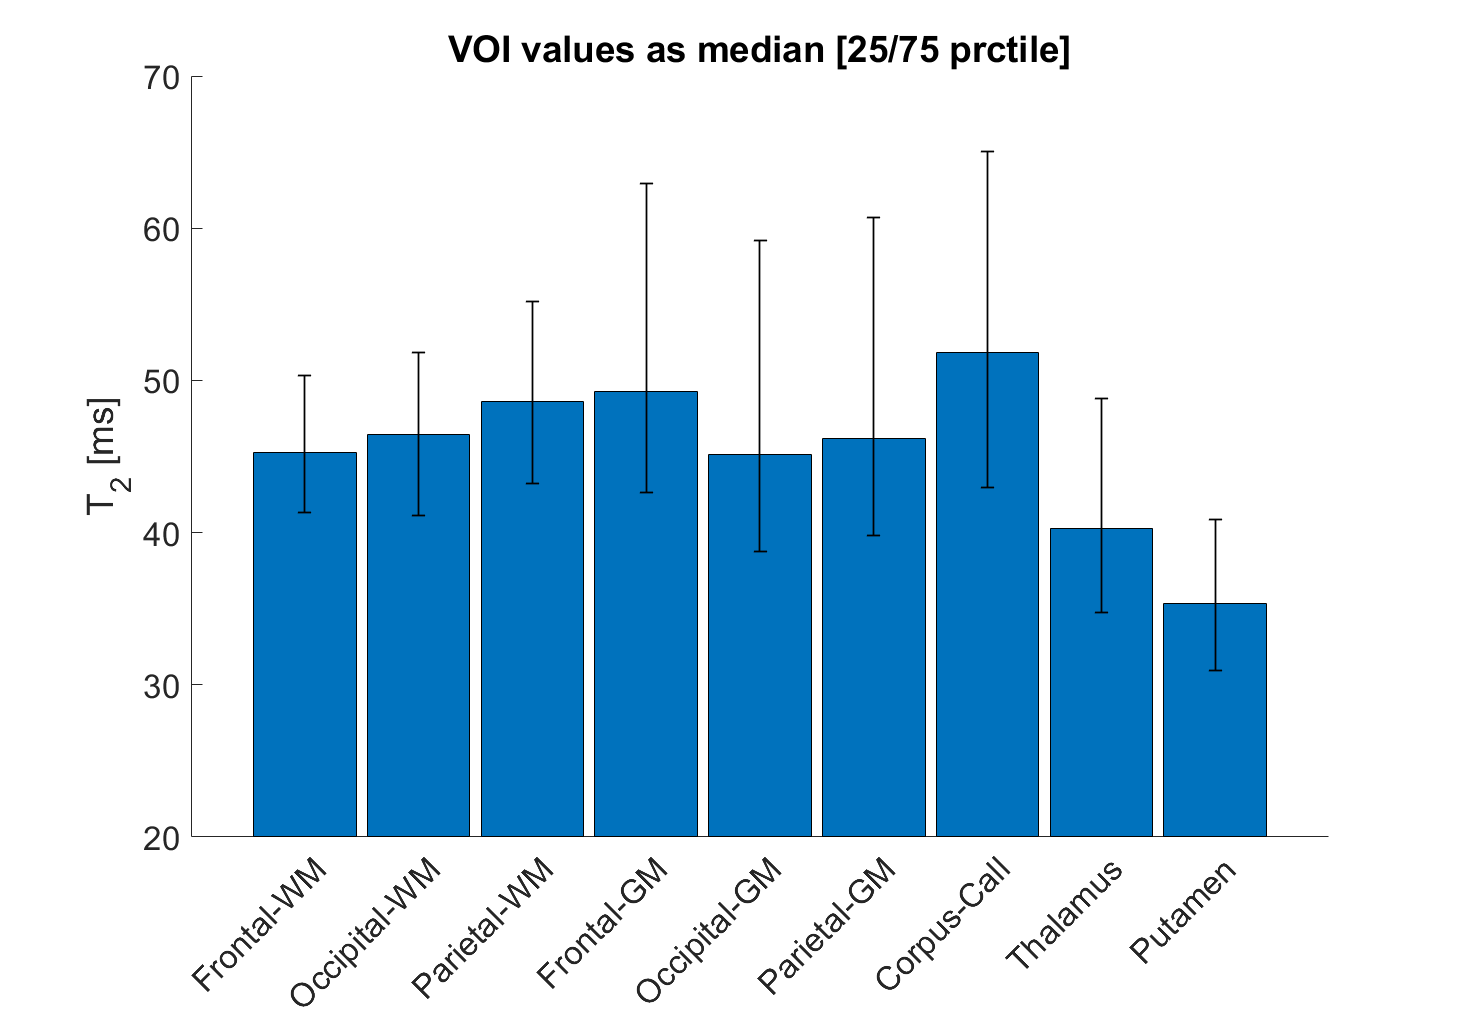
Figure 5
Quantitative results from one healthy subject shown in figures 3 and 4 extracted from 9 brain VOIs. Median T2 values ranged between 40 and 50 ms in white matter and gray matter structures, whereas a lower trend was observed for Thalamus and Putamen.