3039
Evidence on the association between executive functions and tractography-derived nodal properties in Parkinson's disease
Giacomo Tomezzoli1,2, Lisa Novello2, Francesca Saviola2, Stefano Tambalo2, Beatrice Federica Luciani2, Enrica Pierotti2, Céline Charroud 2, Alessandro Gober2, Francesca Giacomoni2, Pamela Narduzzi2, Claudia Meli2, Marika Falla2, Alessandra Dodich2, Luca Turella2, Costanza Papagno2, and Jorge Jovicich2
1DiPSCo, Department of Psychology and Cognitive Science, University of Trento, Rovereto, Italy, 2CIMeC, Center for Mind/Brain Sciences, University of Trento, Rovereto, Italy
1DiPSCo, Department of Psychology and Cognitive Science, University of Trento, Rovereto, Italy, 2CIMeC, Center for Mind/Brain Sciences, University of Trento, Rovereto, Italy
Synopsis
Executive functions (EFs) play a crucial role for intact cognitive functioning, and their decline in Parkinson’s Disease (PD) patients is associated with decreased quality of life. We investigated the relationship between tractography-derived nodal properties in 8 brain regions involved in cognitive sub-components of executive control and EFs performance. We found preliminary evidence that graph-theory-derived nodal properties reveal associations with executive scores. As part of an ongoing longitudinal project, this initial evidence suggests that nodal metrics might be useful for investigating relationships between structural-connectivity properties and cognitive profiles in Parkinson’s disease.
Introduction
Neurodegenerative symptoms of Parkinson’s Disease (PD) involve motor as well as cognitive impairments1. Cognitive domains most frequently affected are attention, Executive Functions (EFs), and memory2. EFs include skills needed for preserving cognitive control, and their deficit is potentially associated with increased risk of falling3 and decreased quality of life4. Previous findings found brain topological properties to be altered and significantly related to EFs scores in PD patients5. However, to the best of our knowledge, cognitive evaluations have not been exhaustively explored with a wide range of EFs sub-components (e.g. inhibition and retrieval strategy). As part of an ongoing longitudinal study, we aim at assessing whether graph-theoretical approaches can be helpful in relating nodes’ segregation and centrality properties of structural-connections involved in executive networks6.Methods
Nine PD patients (Fig.1) underwent neuropsychological assessments which included the UPDRS-III, and the following EFs tests: Trail Making Test7 (TMT-A, TMT-B, TMT-B-A), Stroop-task8 (time- and error-interference), Phonemic Fluency9 (PF). A 3T MAGNETOM Prisma (Siemens Healthcare, Erlangen, Germany) with a 64-channel head-neck RF receive coil was used to acquire 3D T1-weighted (T1w, multi-echo-MPRAGE, 1mm-isotropic), and diffusion-weighted (dMRI) data (2mm-isotropic, TE/TR=76/4200ms, shells: b={0,700,1000,2850} s/mm2, 32/64/64 directions. T1w images were processed in FreeSurfer v7.1 to get brain parcellations according to Destrieux atlas11. dMRI data were denoised12, Gibbs-ringing corrected13, and corrected for eddy currents, head motion, susceptibility-induced geometric distortions and their interaction with motion, slice-to-volume motion, and by replacing outlier slices in FSL’s eddy v.6.0.314. Group-average response functions were computed from subject-specific ones15 and used for estimating Fiber Orientation Distributions (FODs) from 1mm-upsampled dMRI volumes16. FODs were normalized by inter-subject intensity, and whole-brain Anatomically-constrained Tractography (ACT)17 was estimated in MRtrix v.3.0.2 tracking 3 million streamlines from Grey-Matter White-Matter Interface (GMWMI) using FSL algorithm. SIFT218 was used to compute weights representing streamlines cross-section area multipliers. Connectivity matrices were estimated with a radial-assignment mechanism from SIFT2-filtered tractograms, and scaled by SIFT2 proportionality coefficient, allowing to get a 164x164 connectivity matrix per each subject. To test for non-randomness, connectivity matrices from all subjects were compared to random-generated networks19 by means of t-tests in MatLab R2017b. The top 20% highest nodes’ degree (k) of the mean whole-brain connectome was classified as hub regions20. The following graph-metrics were estimated with Brain Connectivity Toolbox21 to describe segregation and centrality properties of regions involved in EFs: nodal (CCnode) and average Clustering Coefficient (CCaverage) and Betweenness Centrality (BC). Spearman coefficient was used to investigate correlations between EFs scores and nodal metrics in bilateral superior-frontal-gyrus, orbital-gyrus, superior-parietal-gyrus, inferior-supramarginal-parietal-gyrus, precuneus, thalamus, caudate and putamen, chosen based on previous findings6,22,23Results
Patients’ connectivity matrices resulted significantly different from the randomly generated network (Fig.2), with a characteristic-network-density of 58%. The mean k distribution revealed that all the a-priori selected nodes were connected and segregated (i.e. hubs; minimum k=84 Fig.3) Segregation properties (CCnode, Fig.4) in PD patients increase (p<0.05) in association to better EFs in: (i) frontal and subcortical areas for PF, (ii) in precuneal and subcortical areas for Stroop-interference-errors. Similarly, nodes’ centrality (BC, Fig.5) in PD patients is positively associated (p<0.05) with cognitive control skills: (i) in fronto-orbital cortex and subcortical areas for PF; (i) in parietal and subcortical areas for Stroop-interference-errors; (iii) in fronto-orbital cortex, parietal and subcortical areas for Stroop-interference-time; (iv) in parietal areas for TMT-B. Conversely, increased BC in PD is associated with lower EFs (p<0.05) in bilateral frontal regions for TMT-B and right-frontal for TMT-B-A. Lastly, at the global level, no significant correlations with CCaverage were found. All p-values (when FDR-corrected) turned out to be larger than our alpha (0.05).Discussion
We observed that segregation and centrality properties of the investigated nodes are associated with executive and attentive patients’ profiles. This work extends previous evidence showing associations between nodal properties and cognitive performance in PD patients but limited to nodal efficiency properties, and adopts a more advanced diffusion modelling approach for weighting the estimated connectivity matrices5. Our results further corroborate the previously established role of fronto-parietal network nodes, involved in attention monitoring and working memory24, as a hub network known to be affected in neurodegenerative disorders23. Moreover we highlight the role of segregation in frontal and subcortical areas in potentially supporting executive control. Additionally, the level of centrality might underlie the cognitive and executive performance of these patients. Indeed, the lack of significant associations between cognitive scores and global segregation (CCaverage) suggests that local rather than whole-connectome’s properties might explain the observed cognitive performance. Charting the temporal evolution of segregation and centrality of structural connections might help in shedding new light in the mechanisms of EFs degeneration in PD, playing a crucial role in these patients’ quality of life3,4. The planned increase in sample size will further clarify these results.Conclusion
As part of a longitudinal project, we provide novel evidence that diffusion-tractography-based nodal properties of segregation and centrality of areas involved in the executive control are associated with cognitive performance in PD.Acknowledgements
No acknowledgement found.References
- Kudlicka, A., Clare, L., & Hindle, J. V. (2011). Executive functions in Parkinson's disease: Systematic review and meta‐analysis. Movement disorders, 26(13), 2305-2315.
- Muslimović, D., Post, B., Speelman, J. D., & Schmand, B. (2005). Cognitive profile of patients with newly diagnosed Parkinson disease. Neurology, 65(8), 1239–1245.
- Yogev, G., Giladi, N., Peretz, C., Springer, S., Simon, E. S., & Hausdorff, J. M. (2005). Dual tasking, gait rhythmicity, and Parkinson's disease: which aspects of gait are attention demanding?. European journal of neuroscience, 22(5), 1248-1256.
- Vlagsma, T. T., Koerts, J., Tucha, O., Dijkstra, H. T., Duits, A. A., van Laar, T., & Spikman, J. M. (2017). Objective versus subjective measures of executive functions: predictors of participation and quality of life in Parkinson disease?. Archives of Physical Medicine and Rehabilitation, 98(11), 2181-2187.
- Wang, W., Mei, M., Gao, Y., Huang, B., Qiu, Y., Zhang, Y., … Nie, K. (2020). Changes of brain structural network connection in Parkinson’s disease patients with mild cognitive dysfunction: a study based on diffusion tensor imaging. Journal of Neurology, 267(4), 933–943.
- Leh, S. E., Petrides, M., & Strafella, A. P. (2010). The neural circuitry of executive functions in healthy subjects and Parkinson's disease. Neuropsychopharmacology, 35(1), 70–85.
- Giovagnoli, A. R., Del Pesce, M., Mascheroni, S., Simoncelli, M., Laiacona, M., & Capitani, E. (1996). Trail making test: normative values from 287 normal adult controls. The Italian journal of neurological sciences, 17(4), 305-309.
- Caffarra, P., Vezzadini, G., Dieci, F., Zonato, F., & Venneri, A. (2002). Una versione abbreviata del test di Stroop: dati normativi nella popolazione italiana. Nuova Rivista di Neurologia, 12(4), 111-115
- Robinson, G., Shallice, T., Bozzali, M., & Cipolotti, L. (2012). The differing roles of the frontal cortex in fluency tests. Brain, 135(7), 2202-2214.
- Caruyer, E., Lenglet, C., Sapiro, G., & Deriche, R. (2013). Design of multishell sampling schemes with uniform coverage in diffusion MRI. Magnetic resonance in medicine, 69(6), 1534-1540.
- Destrieux, C., Fischl, B., Dale, A., & Halgren, E. (2010). Automatic parcellation of human cortical gyri and sulci using standard anatomical nomenclature. Neuroimage, 53(1), 1-15.
- Veraart, J., Novikov, D. S., Christiaens, D., Ades-Aron, B., Sijbers, J., & Fieremans, E. (2016). Denoising of diffusion MRI using random matrix theory. Neuroimage, 142, 394-406.
- Kellner, E., Dhital, B., Kiselev, V. G., & Reisert, M. (2016). Gibbs‐ringing artifact removal based on local subvoxel‐shifts. Magnetic resonance in medicine, 76(5), 1574-1581.
- Andersson, J. L., & Sotiropoulos, S. N. (2016). An integrated approach to correction for off-resonance effects and subject movement in diffusion MR imaging. Neuroimage, 125, 1063-1078.
- Dhollander, T., Raffelt, D., & Connelly, A. (2016, September). Unsupervised 3-tissue response function estimation from single-shell or multi-shell diffusion MR data without a co-registered T1 image. In ISMRM Workshop on Breaking the Barriers of Diffusion MRI (Vol. 5, p. 5).
- Jeurissen, B., Tournier, J. D., Dhollander, T., Connelly, A., & Sijbers, J. (2014). Multi-tissue constrained spherical deconvolution for improved analysis of multi-shell diffusion MRI data. NeuroImage, 103, 411-426.
- Smith, R. E., Tournier, J. D., Calamante, F., & Connelly, A. (2012). Anatomically-constrained tractography: improved diffusion MRI streamlines tractography through effective use of anatomical information. Neuroimage, 62(3), 1924-1938.
- Smith, R. E., Tournier, J. D., Calamante, F., & Connelly, A. (2015). SIFT2: Enabling dense quantitative assessment of brain white matter connectivity using streamlines tractography. NeuroImage, 119, 338–351.
- Crossley, N. A., Mechelli, A., Scott, J., Carletti, F., Fox, P. T., McGuire, P., & Bullmore, E. T. (2014). The hubs of the human connectome are generally implicated in the anatomy of brain disorders. Brain, 137(8), 2382-2395.
- Wang, X., Lin, Q., Xia, M., & He, Y. (2018). Differentially categorized structural brain hubs are involved in different microstructural, functional, and cognitive characteristics and contribute to individual identification. Human brain mapping, 39(4), 1647-1663.
- Rubinov, M, and Sporns O.. Complex network measures of brain connectivity: uses and interpretations. Neuroimage 52.3 (2010): 1059-1069.
- Caeyenberghs, K., Leemans, A., Leunissen, I., Gooijers, J., Michiels, K., Sunaert, S., & Swinnen, S. P. (2014). Altered structural networks and executive deficits in traumatic brain injury patients. Brain Structure and Function, 219(1), 193–209.
- Llufriu, S., Martinez-Heras, E., Solana, E., Sola-Valls, N., Sepulveda, M., Blanco, Y., … Saiz, A. (2017). Structural networks involved in attention and executive functions in multiple sclerosis. NeuroImage: Clinical, 13, 288–296.
- Zanto, T. P., & Gazzaley, A. (2013). Fronto-parietal network: flexible hub of cognitive control. Trends in cognitive sciences, 17(12), 602-603
Figures
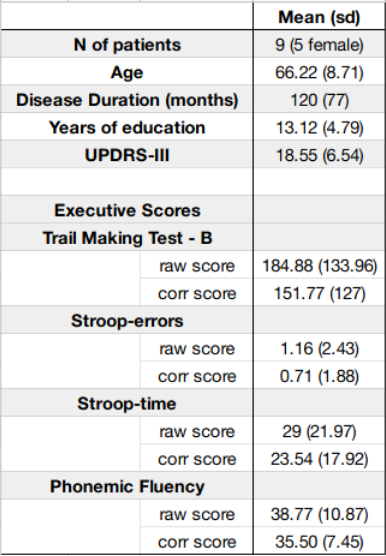
Figure 1: Patients demographic data and scores at the clinical and cognitive assessments. For the cognitive assessment, corrected (“corr”) scores were adjusted for patients’ demographic variables when relevant, and are reported along raw scores.
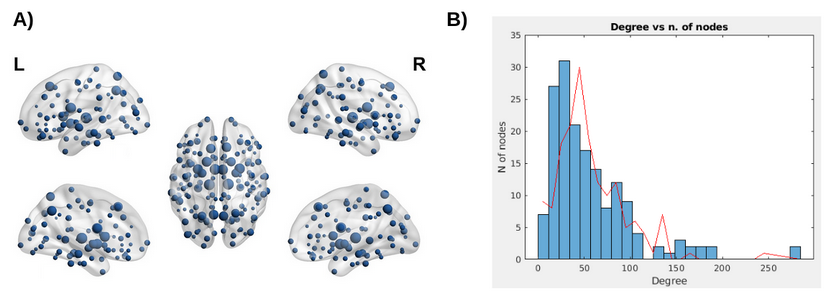
Figure 2: Panel A: Topological group distribution of node degree (k), the size of each node represents k. Panel B: Distribution of nodal degree values (k) in Parkinson’s disease patients (blue bins) showing a flatter tail relative to the nodal degree distribution for the random matrices (red line). This suggests that the probability to find hub regions in patients’ connectivity matrices is higher than for the random matrices.
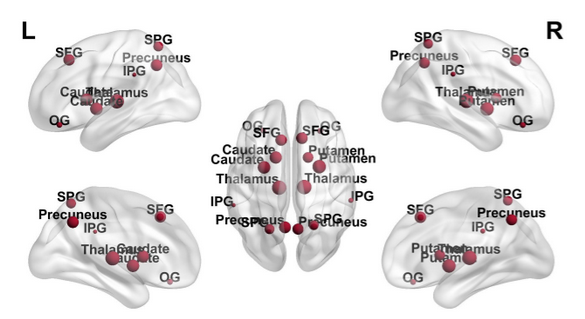
Figure 3: Topological distribution of node degree (k); the size of each node represents k. SFG: superior-frontal-gyrus; OG: orbital-gyrus; SPG: superior-parietal-gyrus; IPG: inferior-supramarginal-parietal-gyrus
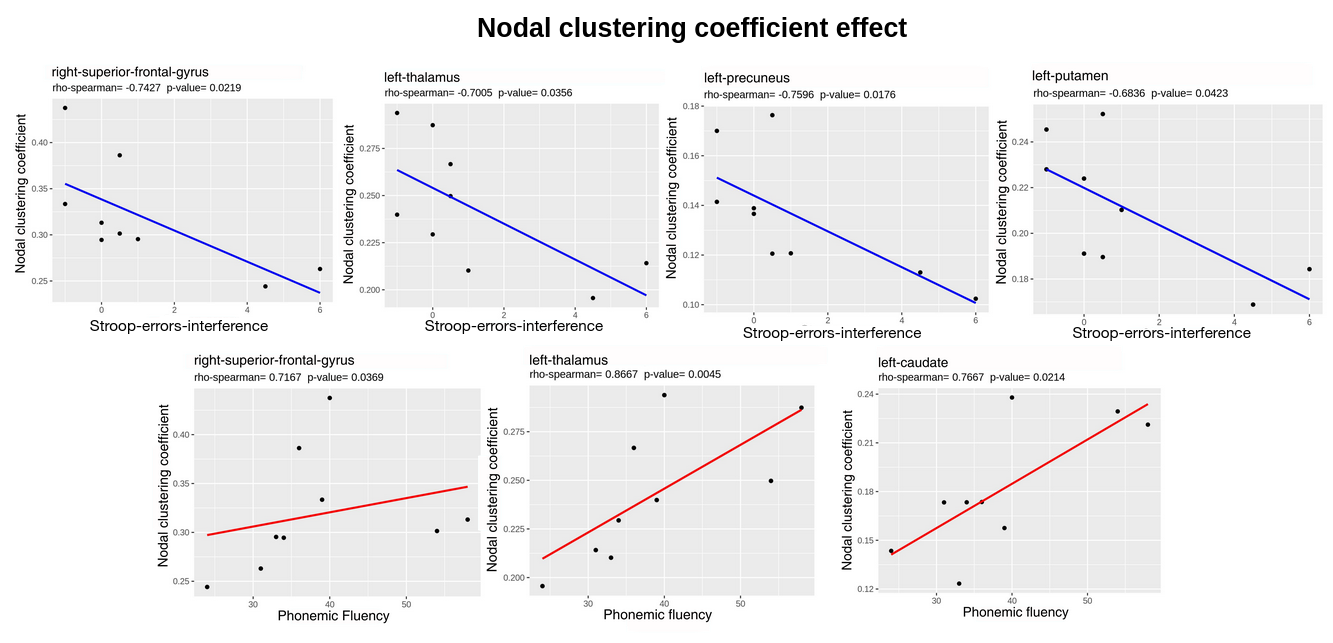
Figure 4: Nodal clustering coefficient distributions relative to Stroop-interference-errors and Phonemic Fluency scores. P-values are not FDR corrected. Red and blue lines represent positive and negative correlation trends respectively.
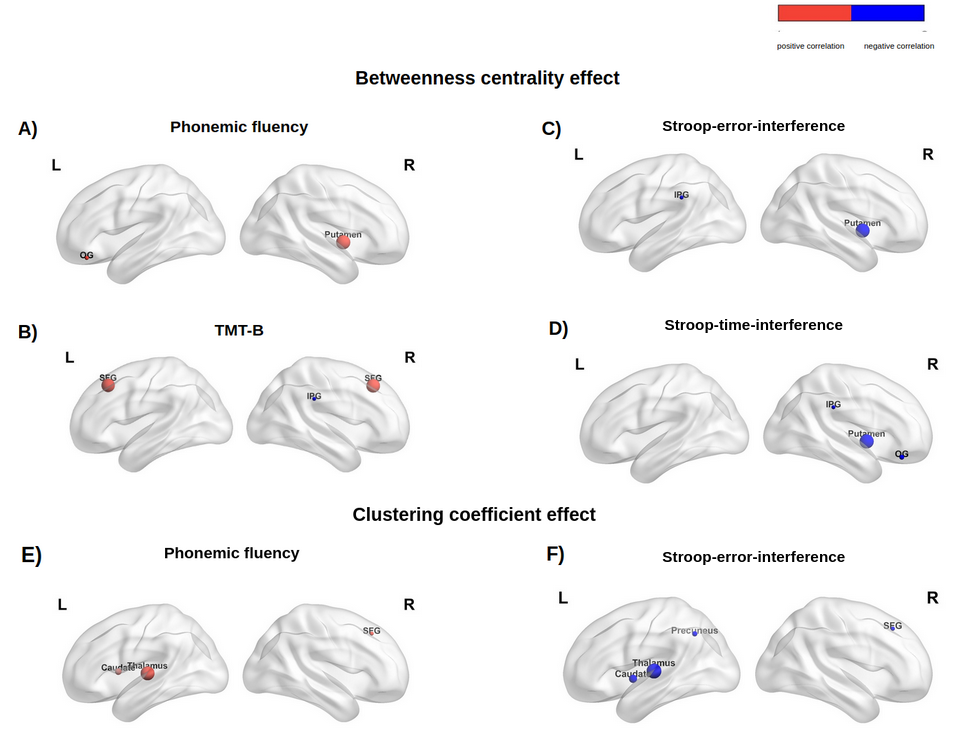
Figure 5: Betweenness Centrality and nodal Clustering Coefficient positive correlations (red nodes) and negative correlations (blue nodes) with EFs scores in nodes enrolled in the analysis. SFG: superior-frontal-gyrus; IPG: inferior-supramarginal-parietal-gyrus.