3035
Assessing the differences in diffusion measures of basal ganglia and basal ganglia circuitry between controls and Parkinson’s disease patients1Gachon University, Incheon, Korea, Republic of
Synopsis
The MNI PD25 subcortical atlas, which consists of key structures involved in Parkinson’s disease, was automatically segmented on each 3T control and Parkinson’s disease diffusion data obtained from the Parkinson’s disease Progression Marker Initiative (PPMI) database. Diffusion measures such as FA, AD, RD, MD and QA were obtained from each segmented ROI and interconnectivity for comparison between controls and Parkinson’s disease patients to observe for significant biomarkers that occur in basal ganglia due to Parkinson’s disease.
Introduction
Parkinson’s disease is a neurodegenerative disease commonly diagnosed in the elderly characterized by various motor symptoms such as resting tremor, bradykinesia, rigidity and non-motor symptoms such as depression, olfactory dysfunction and in certain cases, dementia1. However, many symptoms have estimated to take around 10 years after neurodegeneration2 of dopaminergic neurons in substantia nigra, caused by accumulation of a-synuclein aggregation3. Many studies have suggested that therapies for preventive treatment before significant neuronal damage can be effective for potentially treating Parkinson’s disease (PD) but have expressed difficulty in diagnosing subjects at an early stage of neuronal damage that could progress to Parkinson’s disease4. One particular method of monitoring potential biomarkers of early neuronal damage is diffusion tensor imaging (DTI), a non-invasive imaging technique used to describe white matter integrity by measuring water motion5. Many studies have utilized DTI to analyze significant differences in diffusion indices between PD and HC but have shown inconsistent results depending on the age each subject was diagnosed, quality of segmentations and symptoms each subject expresses6. In this study, a comprehensive analysis of basal ganglia diffusion measures, QA, FA, MD, AD, and RD was done on Parkinson’s Progression Markers Initiative7 (PPMI) controls and PDs to observe significant differences in basal ganglia and basal ganglia connectivity that could be used as biomarkers of PD.Methods
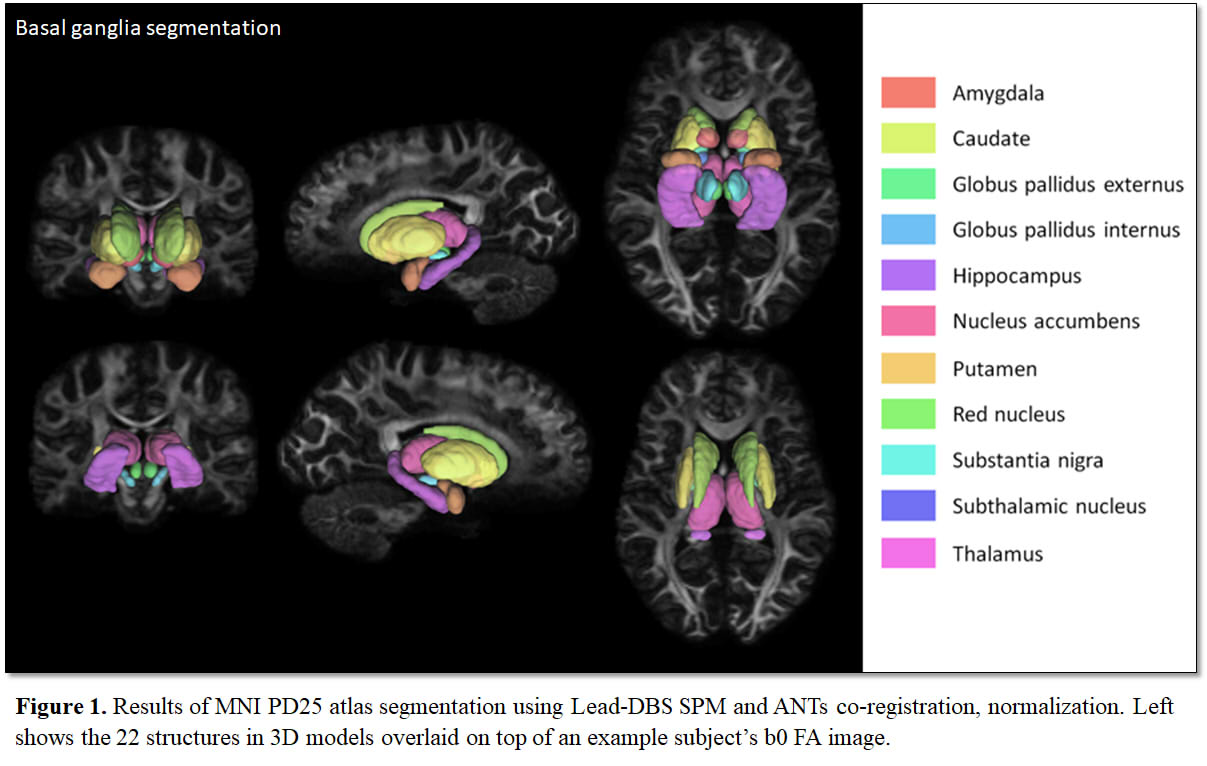
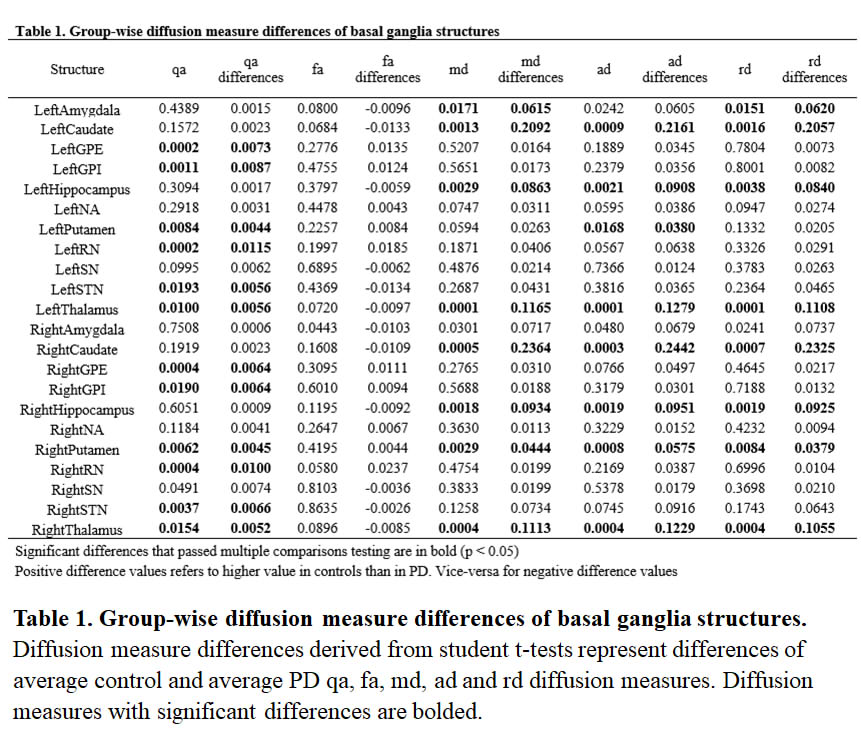
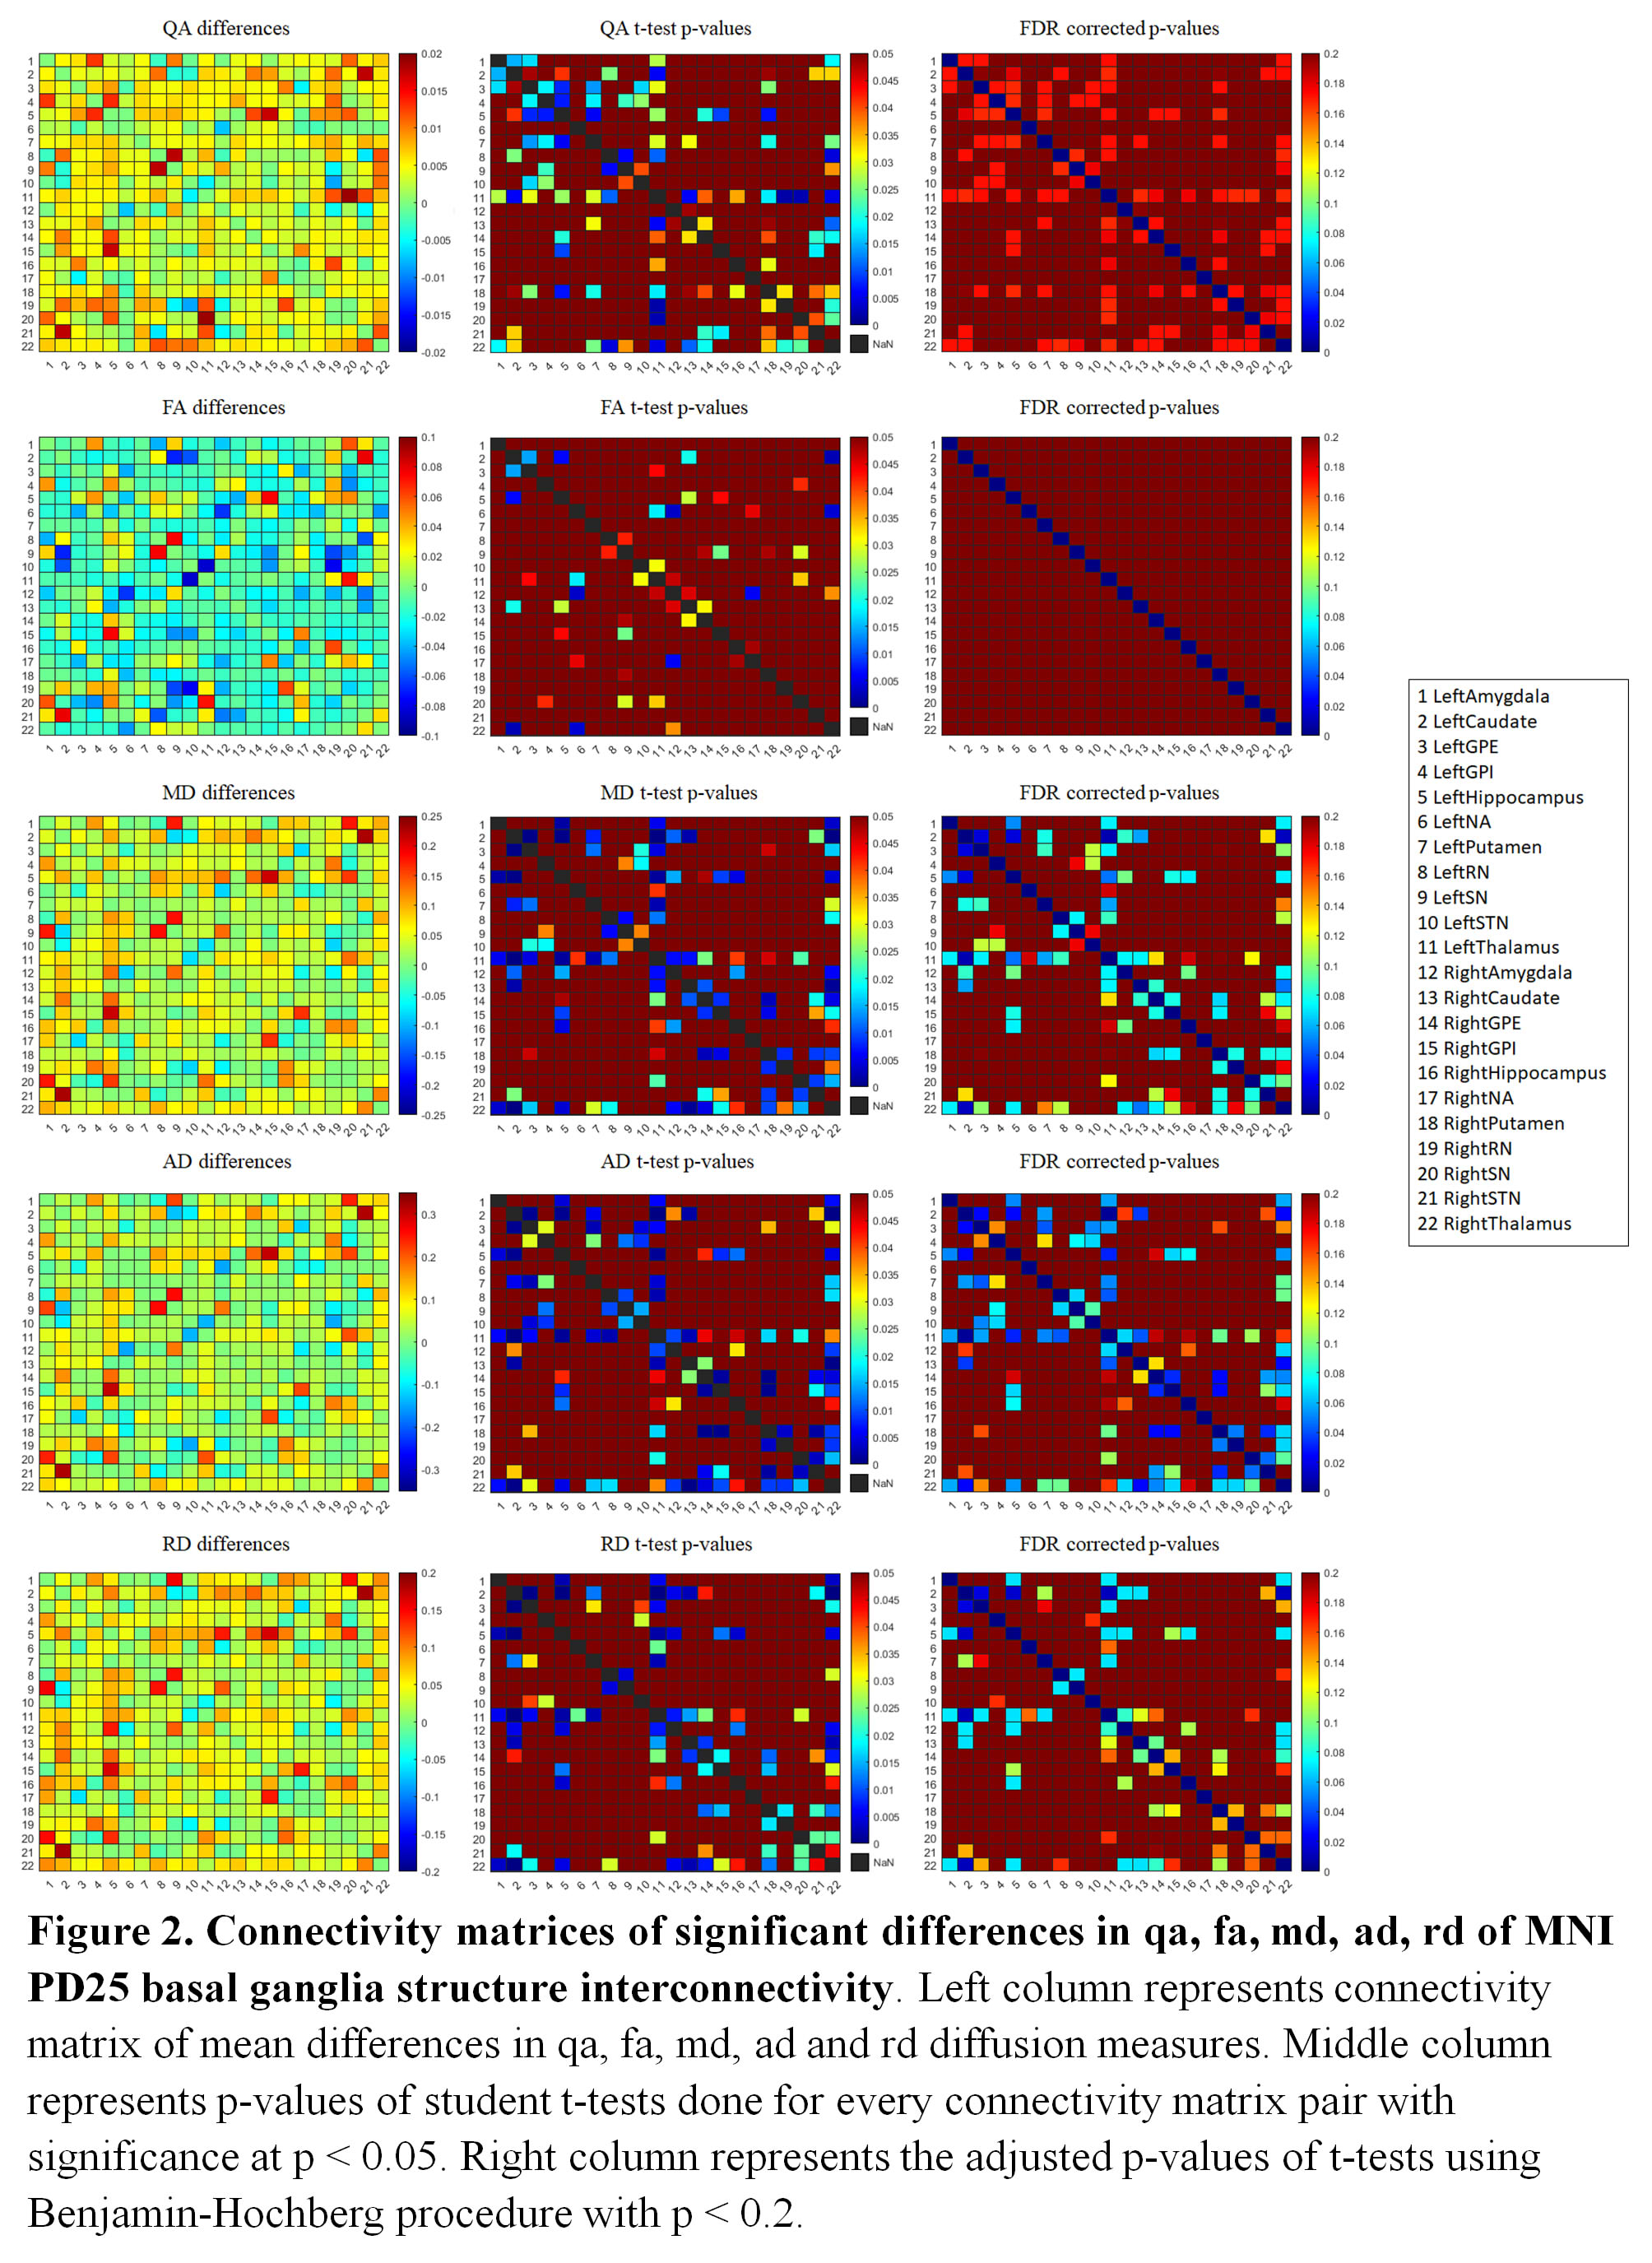
3T PPMI T1w and diffusion weighted images of 44 controls and 44 PD were used for this study. Each subject’s diffusion weighted images were preprocessed using a series of MRtrix38 commands which involved denoising, Gibbs ringing removal, motion and distortion correction, biasfield correction, and resampling. A standard Lead-DBS connectome pipeline9 was used to segment the MNI PD25 atlas10, which consists of the amygdala, caudate, globus pallidus external (GPe), globus pallidus internal (GPi), hippocampus, nucleus accumbens (NA), putamen, red nucleus (RN), substantia nigra (SN), subthalamic nucleus (STN), thalamus. The connectome pipeline involved co-registering T1w and diffusion weighted images through SPM, then using custom Advanced Normalization Tools11 (ANTs) to normalize the MNI PD25 subcortical atlas to T1w images. Fiber tracking of diffusion weighted images were done through generalized q-sampling. Diffusion measures, QA, FA, MD, AD and RD were sampled from each segmentation and segmentation connectivity with DSI Studio. Differences in each diffusion measure was tested for significance using student t-test, using Benjamini-Hochberg procedure to correct for multiple comparisons with significance at p < 0.05 for segmentation comparisons and p < 0.2 for segmentation connectivity comparisons.Results
Segmentations of the MNI PD25 atlas is displayed in Figure 1. Group-wise diffusion measure differences of control and PD segmentations are shown in Table 1. All structures but left NA, left SN, right amygdala, right NA and right SN had significant differences in at least one of the measured diffusion indices. Group-wise diffusion measure differences of control and PD segmentation connectivity are shown in Figure 2. NA in both hemispheres showed very little diffusion measure significance other than in RD, and no basal ganglia connectivity showed significant differences in FA.Discussion
Through the segmentation of MNI PD25 atlas as well as generalized q-sampling fiber tracking, diffusion measures of basal ganglia structures as well as diffusion tractography that connect each segmented structure were compared between controls and PD. Despite the loss of dopaminergic neurons in the SN being an important factor of PD, there were no significant differences in diffusion measures in both hemisphere SN. Recent meta-analysis of SN focused studies showed that 11 studies had no significant differences in FA and very little studies had significant increases in MD6. While our results were consistent with studies reporting insignificant FA differences in SN, there are studies that have reported significant FA differences in the SN pars compacta subregion, where most dopaminergic neurons are concentrated6,13. Future studies focusing on the dopaminergic connections between SN compacta and striatal structures such as the caudate nucleus and putamen should better represent significant changes in diffusion measures for PD. Other notable changes in diffusion measures include significant reduction of QA, MD, AD and RD of connectivity between GPe and STN, GPe and putamen, STN and SN/GPi, all of which are implicated in motor loop connectivity significantly altered in PD patients14. As such, it is likely that diffusion measures of basal ganglia can be used as biomarkers for diagnosing PD.Conclusion
Through segmentation and fiber tracking of controls and PD diffusion images, this study was able to observe significant differences in diffusion measures of basal ganglia structures and basal ganglia connectivity. Several results correlated with past studies regarding diffusion measures of SN, as well as diffusion measures of the connectivity involved in the motor loop. Future studies with a more focused study in SN subregions and adding additional subjects should help the evaluation of using diffusion measures as biomarkers for early PD.Acknowledgements
Data used in the preparation of this article were obtained from the Parkinson’s Progression Markers Initiative (PPMI) database (www.ppmiinfo.org/data). For up-to-date information on the study, visit www.ppmiinfo.org. PPMI – a public-private partnership – is funded by the Michael J. Fox Foundation for Parkinson’s Research and funding partners, including [list the full names of all of the PPMI funding partners found at www.ppmiinfo.org/fundingpartners].References
1. De Lau LM, Breteler MM. Epidemiology of Parkinson's disease. The Lancet Neurology. 2006 Jun 1;5(6):525-35.
2. de la Fuente-Fernández R. Imaging of dopamine in PD and implications for motor and neuropsychiatric manifestations of PD. Frontiers in neurology. 2013 Jul 9;4:90.
3. Braak H, Del Tredici K, Rüb U, De Vos RA, Steur EN, Braak E. Staging of brain pathology related to sporadic Parkinson’s disease. Neurobiology of aging. 2003 Mar 1;24(2):197-211.
4. Lang AE. Clinical trials of disease-modifying therapies for neurodegenerative diseases: the challenges and the future. Nature medicine. 2010 Nov;16(11):1223-6.
5. Basser PJ, Jones DK. Diffusion‐tensor MRI: theory, experimental design and data analysis–a technical review. NMR in Biomedicine: An International Journal Devoted to the Development and Application of Magnetic Resonance In Vivo. 2002 Nov;15(7‐8):456-67.
6. Zhang Y, Burock MA. Diffusion Tensor Imaging in Parkinson's Disease and Parkinsonian Syndrome: A Systematic Review. Frontiers in neurology. 2020 Sep 25;11:1091.
7. Marek K, Jennings D, Lasch S, Siderowf A, Tanner C, Simuni T, Coffey C, Kieburtz K, Flagg E, Chowdhury S, Poewe W. The parkinson progression marker initiative (PPMI). Progress in neurobiology. 2011 Dec 1;95(4):629-35. Marek K, Jennings D, Lasch S, Siderowf A, Tanner C, Simuni T, Coffey C, Kieburtz K, Flagg E, Chowdhury S, Poewe W. The parkinson progression marker initiative (PPMI). Progress in neurobiology. 2011 Dec 1;95(4):629-35.
8. Tournier, J.-D.; Smith, R. E.; Raffelt, D.; Tabbara, R.; Dhollander, T.; Pietsch, M.; Christiaens, D.; Jeurissen, B.; Yeh, C.-H. & Connelly, A. MRtrix3: A fast, flexible and open software framework for medical image processing and visualisation. NeuroImage, 2019, 202, 116137
9. Horn A and Kühn AA. Lead-DBS: a toolbox for deep brain stimulation electrode localizations and visualizations. Neuroimage 2015;107:27-135.
10. Xiao Y, Lau JC, Anderson T, DeKraker J, Collins DL, Peters T, Khan AR. An accurate registration of the BigBrain dataset with the MNI PD25 and ICBM152 atlases. Scientific Data. 2019 Oct 17;6(1):1-9.
11. Avants BB, Epstein CL, Grossman M, Gee JC. Symmetric diffeomorphic image registration with cross-correlation: evaluating automated labeling of elderly and neurodegenerative brain. Medical image analysis. 2008; 12:26-41.
12. Yeh FC, Wedeen VJ, Tseng WY. Generalized q-sampling imaging. IEEE transactions on medical imaging. 2010 Mar 18;29(9):1626-35.
13. Fearnley JM, Lees AJ. Ageing and Parkinson's disease: substantia nigra regional selectivity. Brain. 1991 Oct 1;114(5):2283-301.
14. DeLong M, Wichmann T. Update on models of basal ganglia function and dysfunction. Parkinsonism & related disorders. 2009 Dec 1;15:S237-40.
Figures