3032
Evaluation and Quantification of SWI MRA of Cerebral Vasculature in Parkinson’s Disease Patients1Center for Biomedical Imaging Research, Department of Biomedical Engineering, Tsinghua University, Beijing, China, 2Department of Neurosurgery, Tsinghua University Yuquan Hospital, Beijing, China
Synopsis
This study aimed to perform an evaluation of the vascular geometry in PD patients vs. healthy control group to quantify the structural changes in the cerebral vasculature by analyzing SWI MRA data. Findings show, that the PD’s vasculature network was found to have a higher tortuosity, fractality, and branching, yet lower volume and total length as well as smaller average diameter. It is also important to state that aging has a great impact on vascular impairment in PD patients.
Introduction
Accurate segmentation of cerebral vasculature and a quantitative assessment of cerebrovascular morphology is critical to various diagnostic and therapeutic purposes and is appropriate for studying brain health and disease. In Parkinson’s disease (PD) patients, cerebral perfusion disturbances that cause major vasculature transformations have been widely reported1-5, but previous studies only investigated altered arterial properties6-8.Susceptibility-weighted imaging (SWI) is exquisitely sensitive to the venous blood MRA technique, which is why it is commonly used for high-resolution brain venographies. However, this is still a challenging task to evaluate the results due to the complexity of the vascular imaging data. In this study, we aim to quantitatively evaluate SWI MRA PD patients data.
Materials and Methods
ParticipantsThis study was approved by the institutional review board from Tsinghua Yuquan Hospital. From the year 2016 to 2018, 57 PD patients (56.4 ± 9.8 years, 26 males) were recruited. As controls, 17 age-matched healthy volunteers (56.5 ± 8.7 years, 9 males) were recruited (AMC).
Data acquisition
Informed consents were obtained from all subjects (PD patients and AMC) before the study. MRI scans were performed on a Philips 3.0T Achieva MR scanner (Philips Healthcare, Best, The Netherlands) using a 32-channel SENSE head coil. An anatomical scan 3D turbo field echo (TFE) sequence was performed, with parameters of FOV = 256×160×256 mm3, resolution = 1 mm isotropic, TR/TE = 7.6/3.7 ms, and scan time = 3min 46s. Then a high-resolution multi-echo SWI sequence (230 × 230 × 160 FOV, TR 28 ms, TE 6.9/12.6/18.3/24.0 ms, voxel size of 0.6 × 0.6 × 1.2 mm) was used to visualize the cerebral venous system. With the above protocols, PD patients were scanned twice, while AMC volunteers were scanned once at baseline.
SWI Data Post-processing
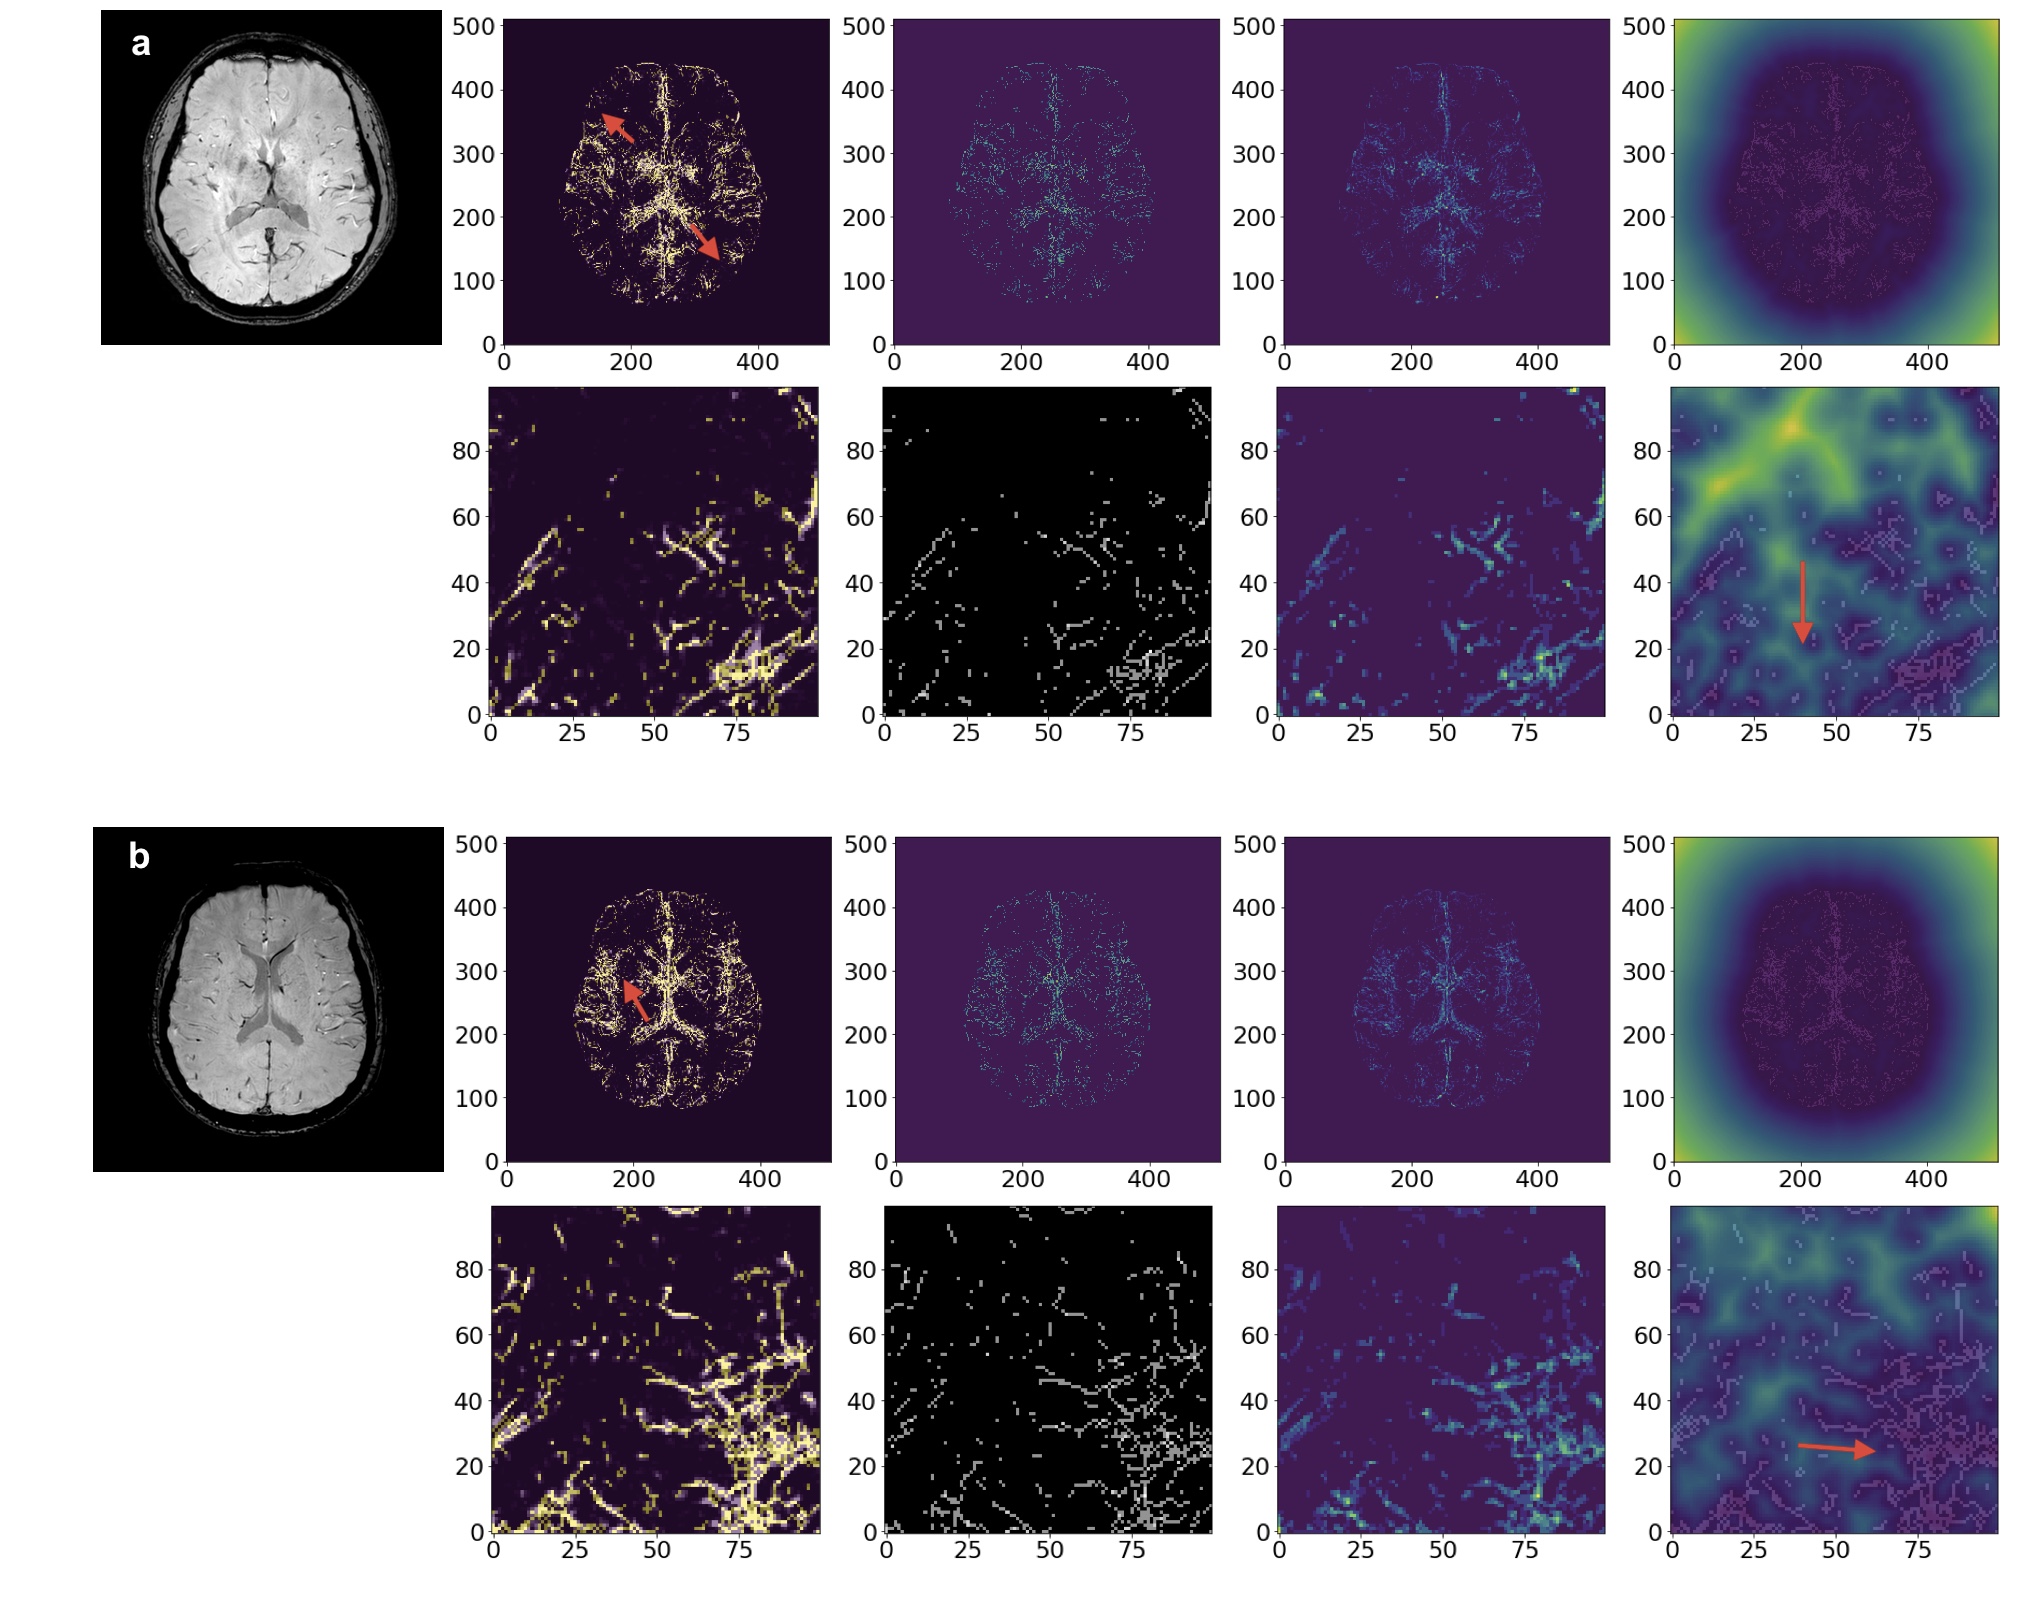
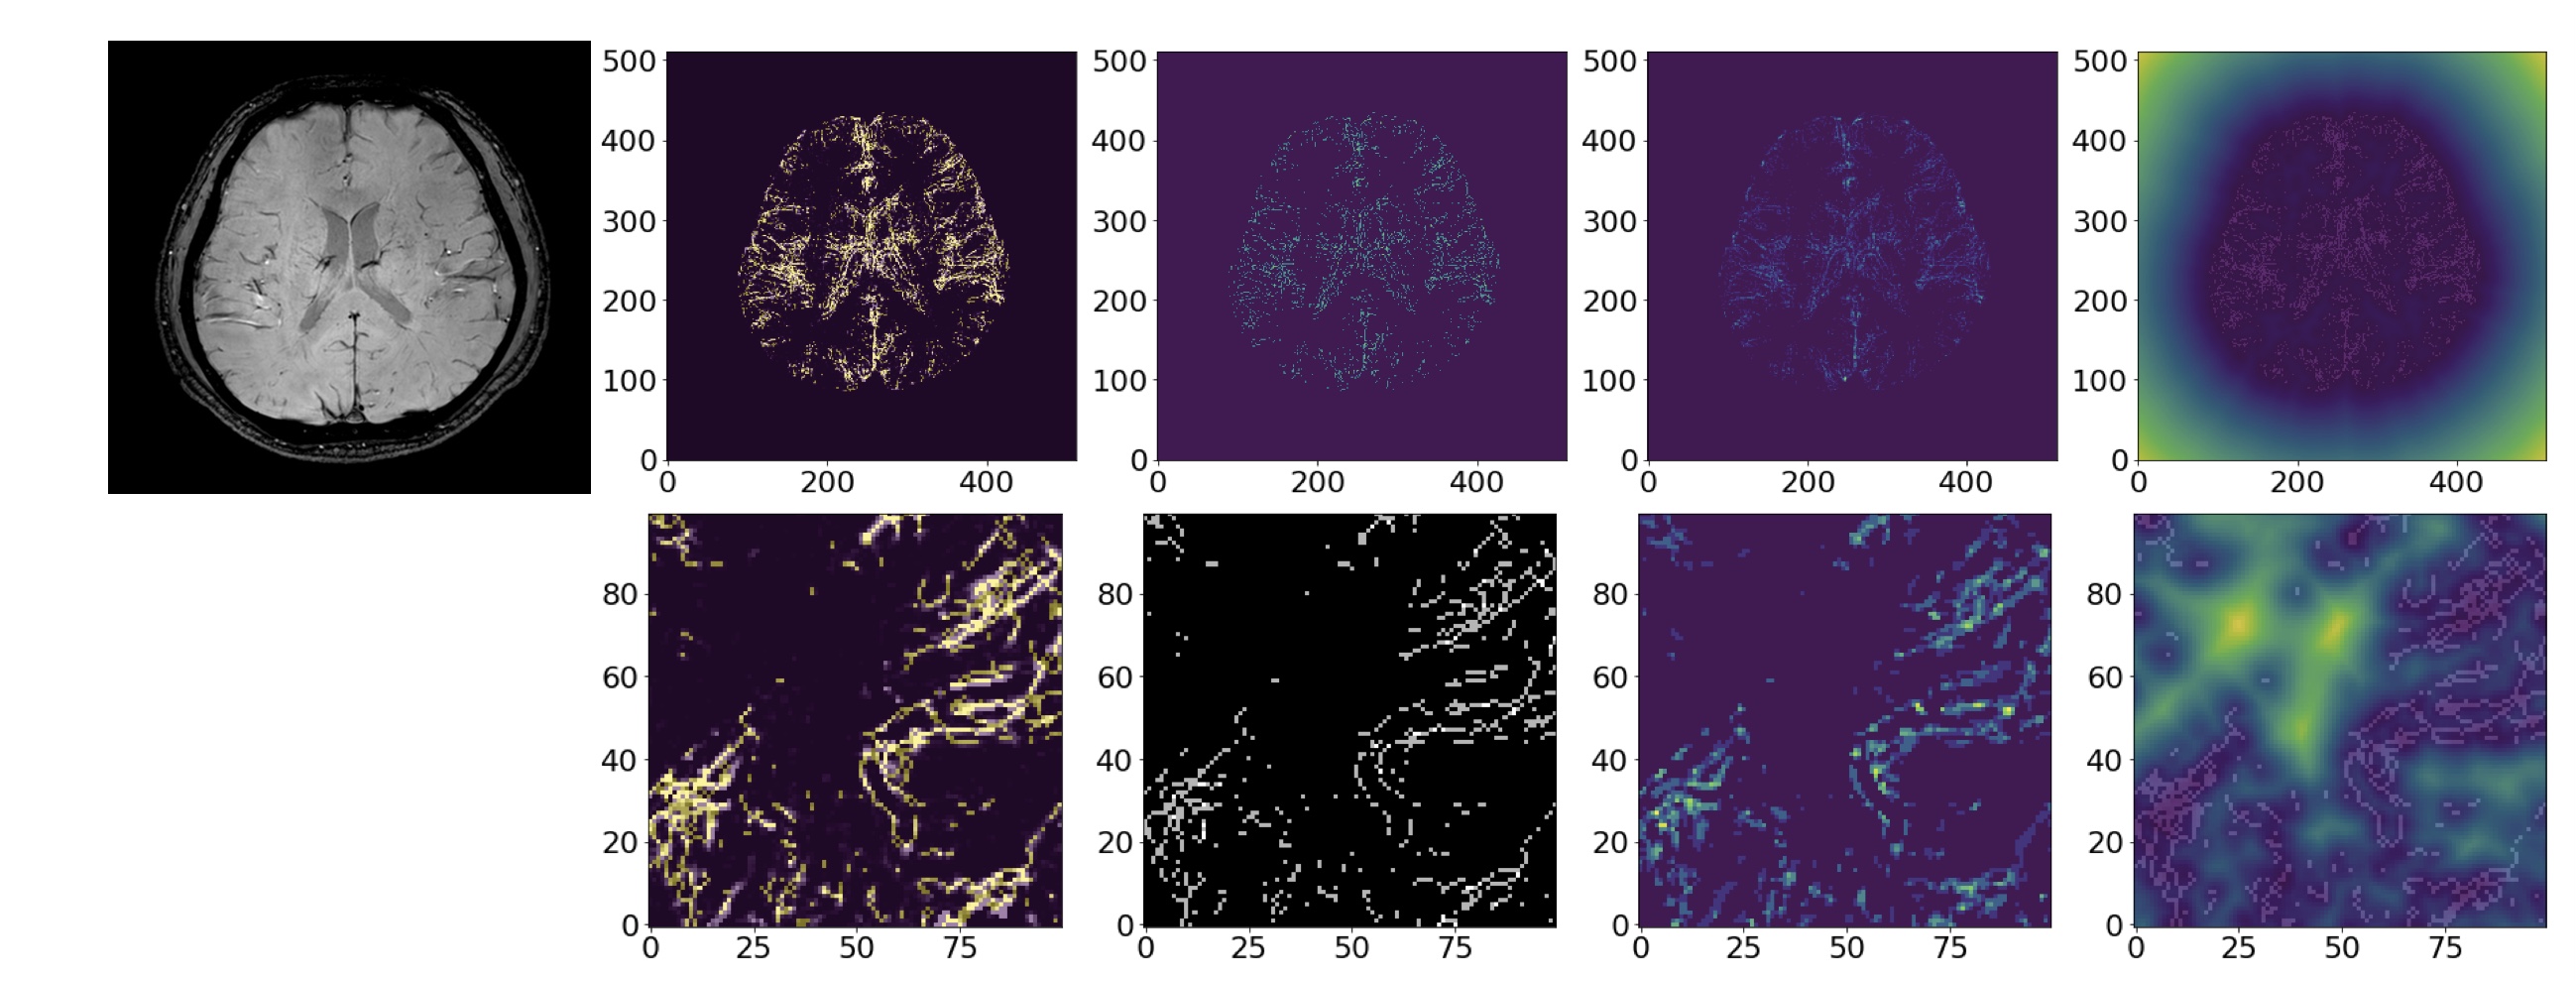
For each subject, both PD patients and AMC images were analyzed using a specialized method MSFDF9. As represented in Figures 1,2, cerebral veins in SWI MRA images were traced, segmented, and skeletonized automatically.
Then the automatically produced results for the PD patients were manually analyzed and compared to each other to identify the visual patterns and categorizes the images by the severity of the case. In this study, we implemented the severity rankings as Low, Medium, and High.
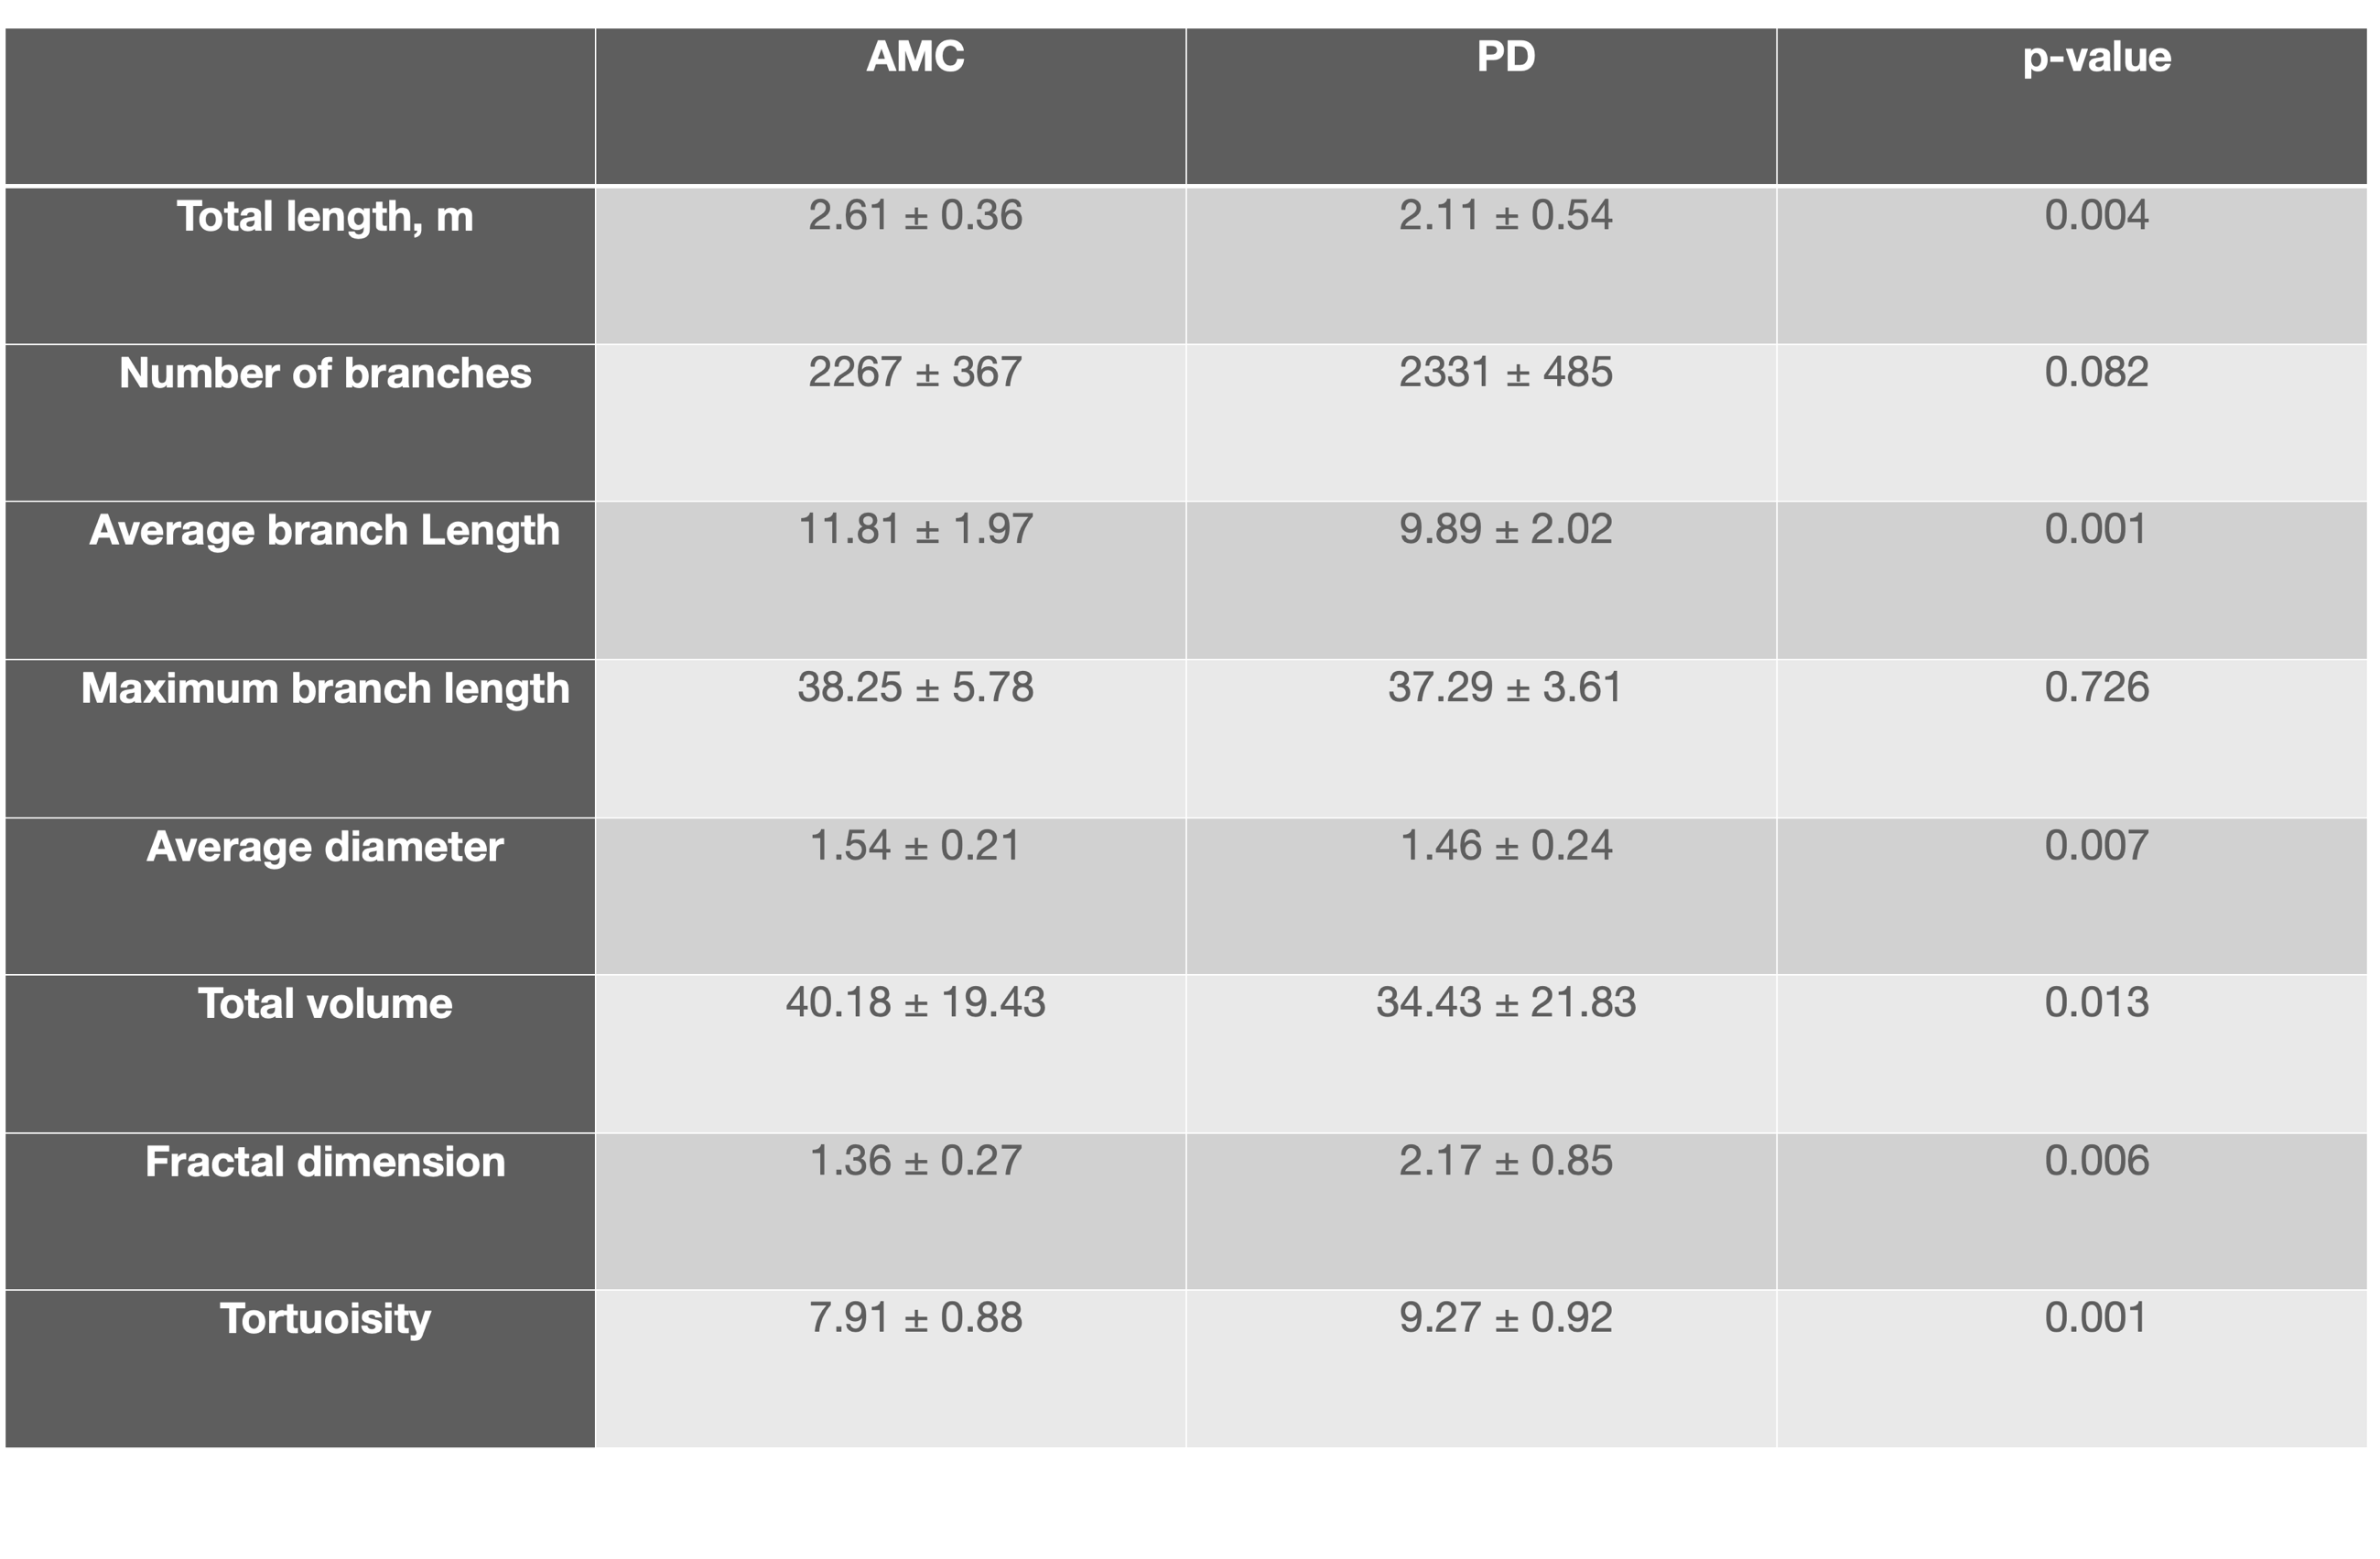
As outputs, the geometric feature extraction parameters method has been used from the previous study10. The ‘Total Length’, ‘Total number of Branches’, ‘Average Diameter’, ‘Average and maximum Branch Length’, ‘Total Volume’, ‘Fractal Dimension’ and ‘Vessel Tortuosity’ have been reported as the mean ± SD for the AMC as well as the PD patients (Table 1). Considering these specific parameters, we can conduct a comprehensive analysis of the cerebral venous tree.
Results
Figure 1 represents the final results of the segmentation and skeletonization of the PD patients. It can be seen in Figure 1a, that the venous tree is visually incomplete, the superficial cortical veins are missing (red arrowheads). On the other hand, Figure 1b shows the increased tortuosity and fractal dimension (red arrowheads) of the venous system.Figure 2 shows the results of the segmentation and skeletonization of the AMC for reference. It can be observed, that the superficial cortical veins and central veins are well delineated.
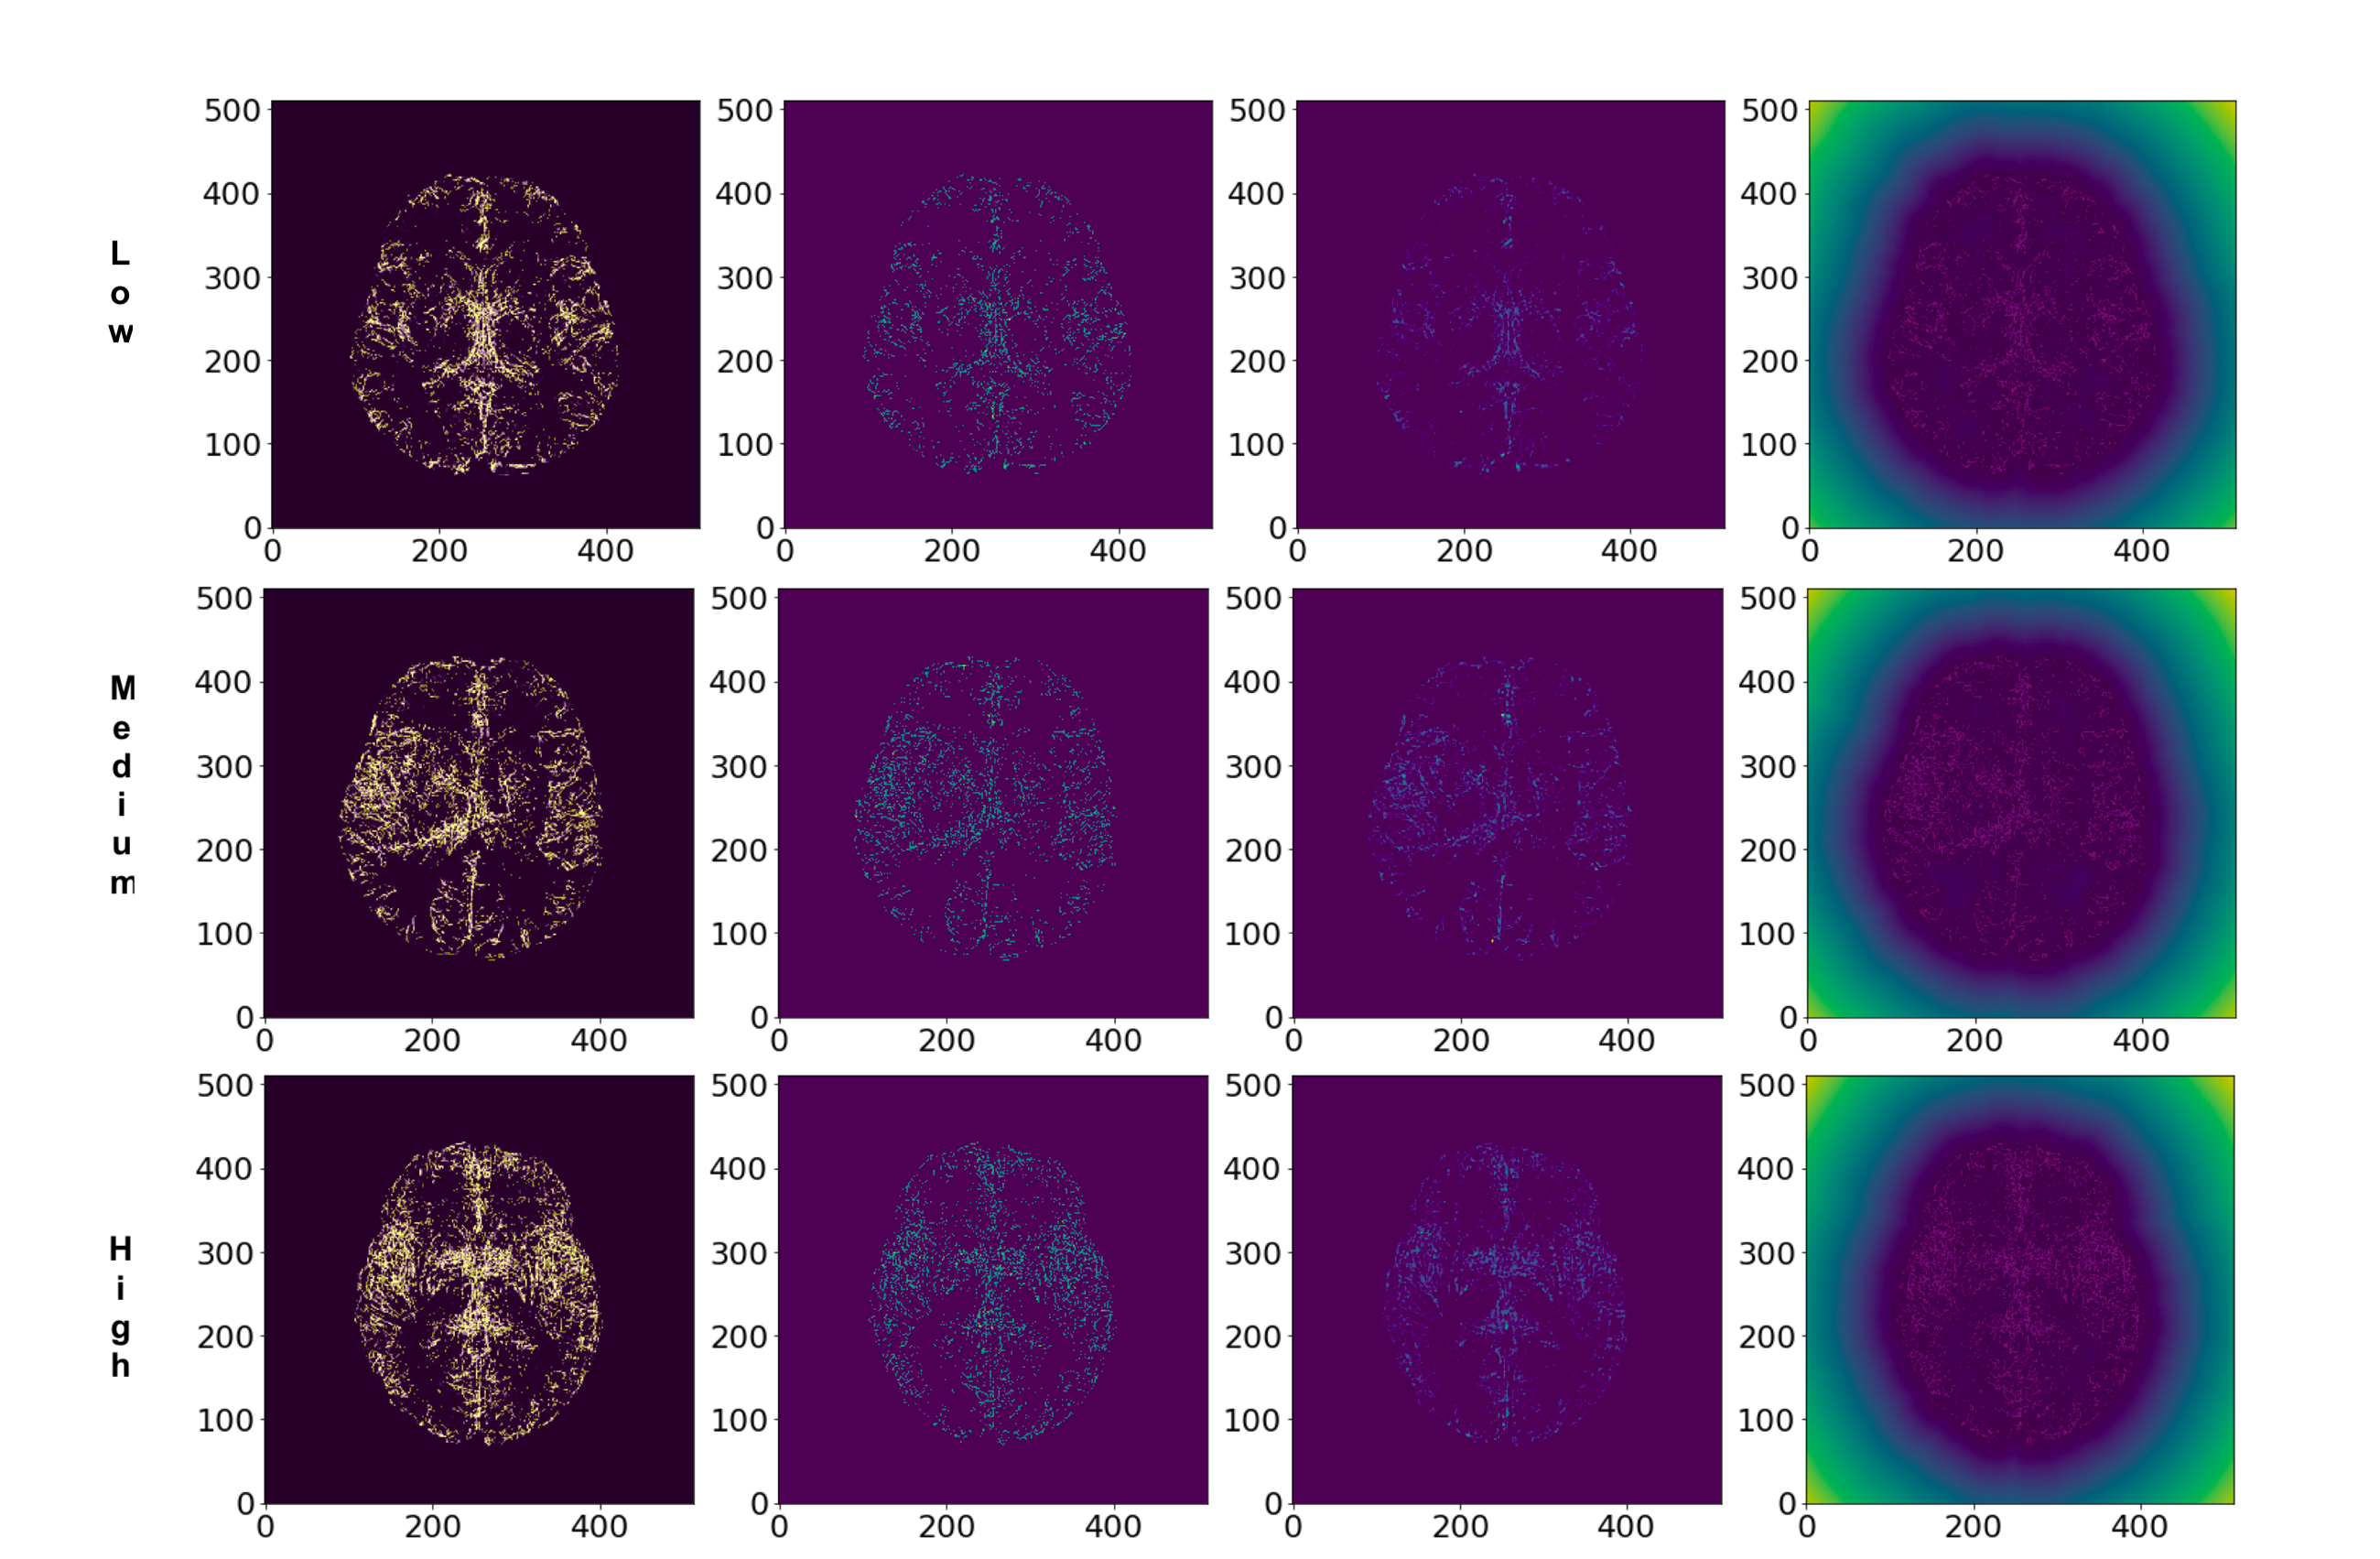
Figure 3 shows the comparison results of the PD patients according to the severity ranking (Low, Medium, and High respectively). It can be found that the patient’s age is one of the major visual factors in most of the subjects, which determines the severity ranking, regardless of some unique cases.
These intuitive figures are consistent with the results of geometric feature extraction analysis.
The data shows that the obtained values for the average diameter, length, and branching of cerebral venous trees agree with the values reported in the literature. It can be seen from Table 1 that most of the extracted geometrical features are significantly different in PD patients as compared to AMC. As hypothesized, the total length, volume, and average diameter of cerebral vessels in PD patients were lower whereas the fractal dimension, tortuosity were significantly higher. The number of branches and branch length had too high a variance to be judged as significantly different.
Discussion and conclusion
In this work, we performed a comparative study of the vascular geometry in PD patients vs. AMC to quantify the structural changes in the cerebral vasculature by analyzing SWI MRA data.Results show, that the PD’s vasculature was found to have a lower volume and total length as well as a average diameter, however, the vascular network of PD patients possessed higher tortuosity, fractality, and branching. This is consistent with findings from literature regarding vessels being more complex and tortuous in PD patients along with additional smaller branches forming for collateral flow. We conclude that the volume and total length are still lower because the newer collateral branches formed are smaller than the major vessel network missing in the segmented volume due to the occlusion. It is important to note that aging has a significant impact on vascular impairment in PD patients. Multiple studies have noted that aging results in an increase in venous stiffness, venous tortuosity, and endothelial molecular dysfunction, potentially leading to hypo-perfusion.
Acknowledgements
No acknowledgement found.References
1. Ma Y, Huang C, Dyke JP, et al. Parkinson's Disease Spatial Covariance Pattern: Noninvasive Quantification with Perfusion MRI. Journal of Cerebral Blood Flow & Metabolism 2010; 30: 505-509. DOI: 10.1038/jcbfm.2009.256.
2. Teune LK, Renken RJ, de Jong BM, et al. Parkinson's disease-related perfusion and glucose metabolic brain patterns identified with PCASL-MRI and FDG-PET imaging. NeuroImage: Clinical 2014; 5: 240-244. DOI: https://doi.org/10.1016/j.nicl.2014.06.007.
3. Matsui H, Udaka F, Miyoshi T, et al. Three-dimensional stereotactic surface projection study of freezing of gait and brain perfusion image in Parkinson's disease. Movement Disorders 2005; 20: 1272-1277. DOI: 10.1002/mds.20520.
4. Graham C, Livingston L, MacAskill MR, et al. Arterial spin labelling reveals an abnormal cerebral perfusion pattern in Parkinson’s disease. Brain 2011; 134: 845-855. DOI: 10.1093/brain/awq377.
5. Fernández-Seara MA, Mengual E, Vidorreta M, et al. Cortical hypoperfusion in Parkinson's disease assessed using arterial spin labeled perfusion MRI. NeuroImage 2012; 59: 2743-2750. DOI: https://doi.org/10.1016/j.neuroimage.2011.10.033.
6. Ceravolo R, Volterrani D, Frosini D, et al. Brain perfusion effects of cholinesterase inhibitors in Parkinson’s disease with dementia. Journal of Neural Transmission 2006; 113: 1787-1790. journal article. DOI: 10.1007/s00702-006-0478-6.
7. Heron CJL, Wright SL, Melzer TR, et al. Comparing Cerebral Perfusion in Alzheimer's Disease and Parkinson's Disease Dementia: An ASL-MRI Study. Journal of Cerebral Blood Flow & Metabolism 2014; 34: 964-970. DOI: 10.1038/jcbfm.2014.40.
8. Firbank MJ, Colloby SJ, Burn DJ, et al. Regional cerebral blood flow in Parkinson's disease with and without dementia. NeuroImage 2003; 20: 1309-1319. DOI: https://doi.org/10.1016/S1053-8119(03)00364-1.
9. Bernier, M., Cunnane, S. C., & Whittingstall, K. (2018). The morphology of the human cerebrovascular system. Human brain mapping, 39(12), 4962-4975.
10. Deshpande, A., Jamilpour, N., Jiang, B., Kidwell, C., Wintermark, M., & Laksari, K. (2020). Automatic Segmentation, Feature Extraction and Comparison of Healthy and Stroke Cerebral Vasculature. arXiv preprint arXiv:2002.11208.
Figures