3029
Magnetic resonance characteristics of iron and neuromelanin in early Parkinson’s disease: correlation with vesicular monoamine transporter 21Department of Radiology, Huashan hospital affiliated to Fudan University, Shanghai, China, 2GE Healthcare, Beijing, China, Shang Hai, China
Synopsis
In this study, we investigated alterations of iron and NM in EPD, and correlations between them and VMAT2 binding in nigrostriatal system. Our results suggested that changes of neuromelanin and susceptibility on QSM images could quantitatively reflect the pathology of EPD and could be used as imaging biomarkers for diagnosing of EPD. The SUR measured by 18F-DTBZ images could reflect the lateralization in EPD patients. NM volume could reflect the striatal dopaminergic function, and both CR value and SUR could reflect the severity of motor impairment in EPD, which are expected to be used for monitoring the progression of EPD.
Materials and Methods Data from 29 PD patients at early stage of disease (H&Y stage ≤ 2) and 46 age- and gender-matched healthy controls (HCs) were prospectively collected in Huashan Hospital affiliated to Fudan University from September 2017 to December 2019. All participants underwent MRI examinations including quantitative susceptibility mapping (QSM) and 3D T1WI on a 3T scanner (DiscoveryTM MR750, GE Healthcare, Milwaukee, WI). EPD patients also underwent 18F-DTBZ scan. Short-echo-time magnitude (setMag) and susceptibility images were reconstructed from QSM. After co-registration of setMag, susceptibility and 18F-DTBZ images to T1WI images using FMRIB Software Library (FSL; http://fsl.fmrib.ox.ac.uk/fsl/fslwiki/FSL), we manually segmented ROIs of bilateral SNc on setMag images. The ROIs of bilateral putamen and caudate were auto-segmented using FSL on T1WI images and ROI in occipital lobe was manually delineated on 18F-DTBZ images. On setMag images, the NM volume was measured and contrast ratio (CR) was calculated with cerebral peduncle as the reference. The susceptibility value was measured on susceptibility images. The specific uptake ratio (SUR) was calculated according to the formula (specific uptake / occipital lobe uptake) - 1. The EPD patients were divided into contralateral and ipsilateral part according to the difference > |1| in left and right side of UPDRSIII score. The UPDRSIII score was subdivided into tremor, posture and gait, and bradykinesia. One-way ANOVA was used to compare the differences of NM volume, CR and susceptibility values among HC, contralateral and ipsilateral EPD patients, and post-hoc analysis was used to assess the difference between contralateral and ipsilateral part of EPD. Paired t-test was used to compare the SUR difference between contralateral and ipsilateral part of EPD. Associations of NM volume, CR, susceptibility values, SURs and clinical symptoms were investigated by partial correlation analysis while controlling for age and gender.
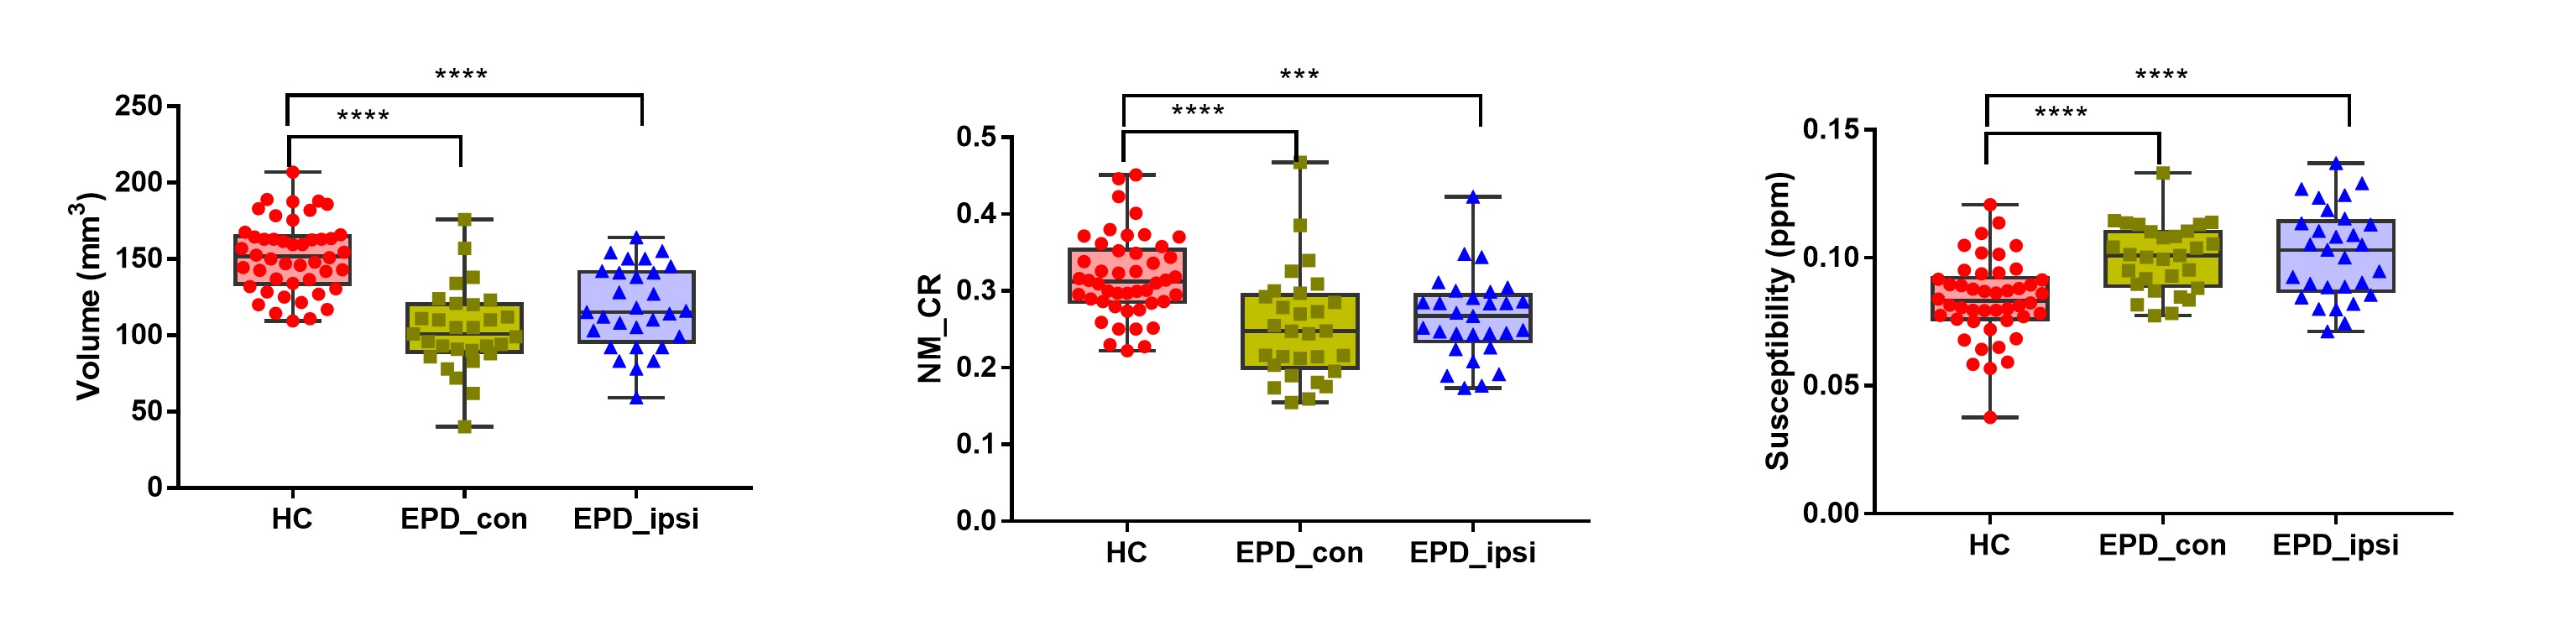
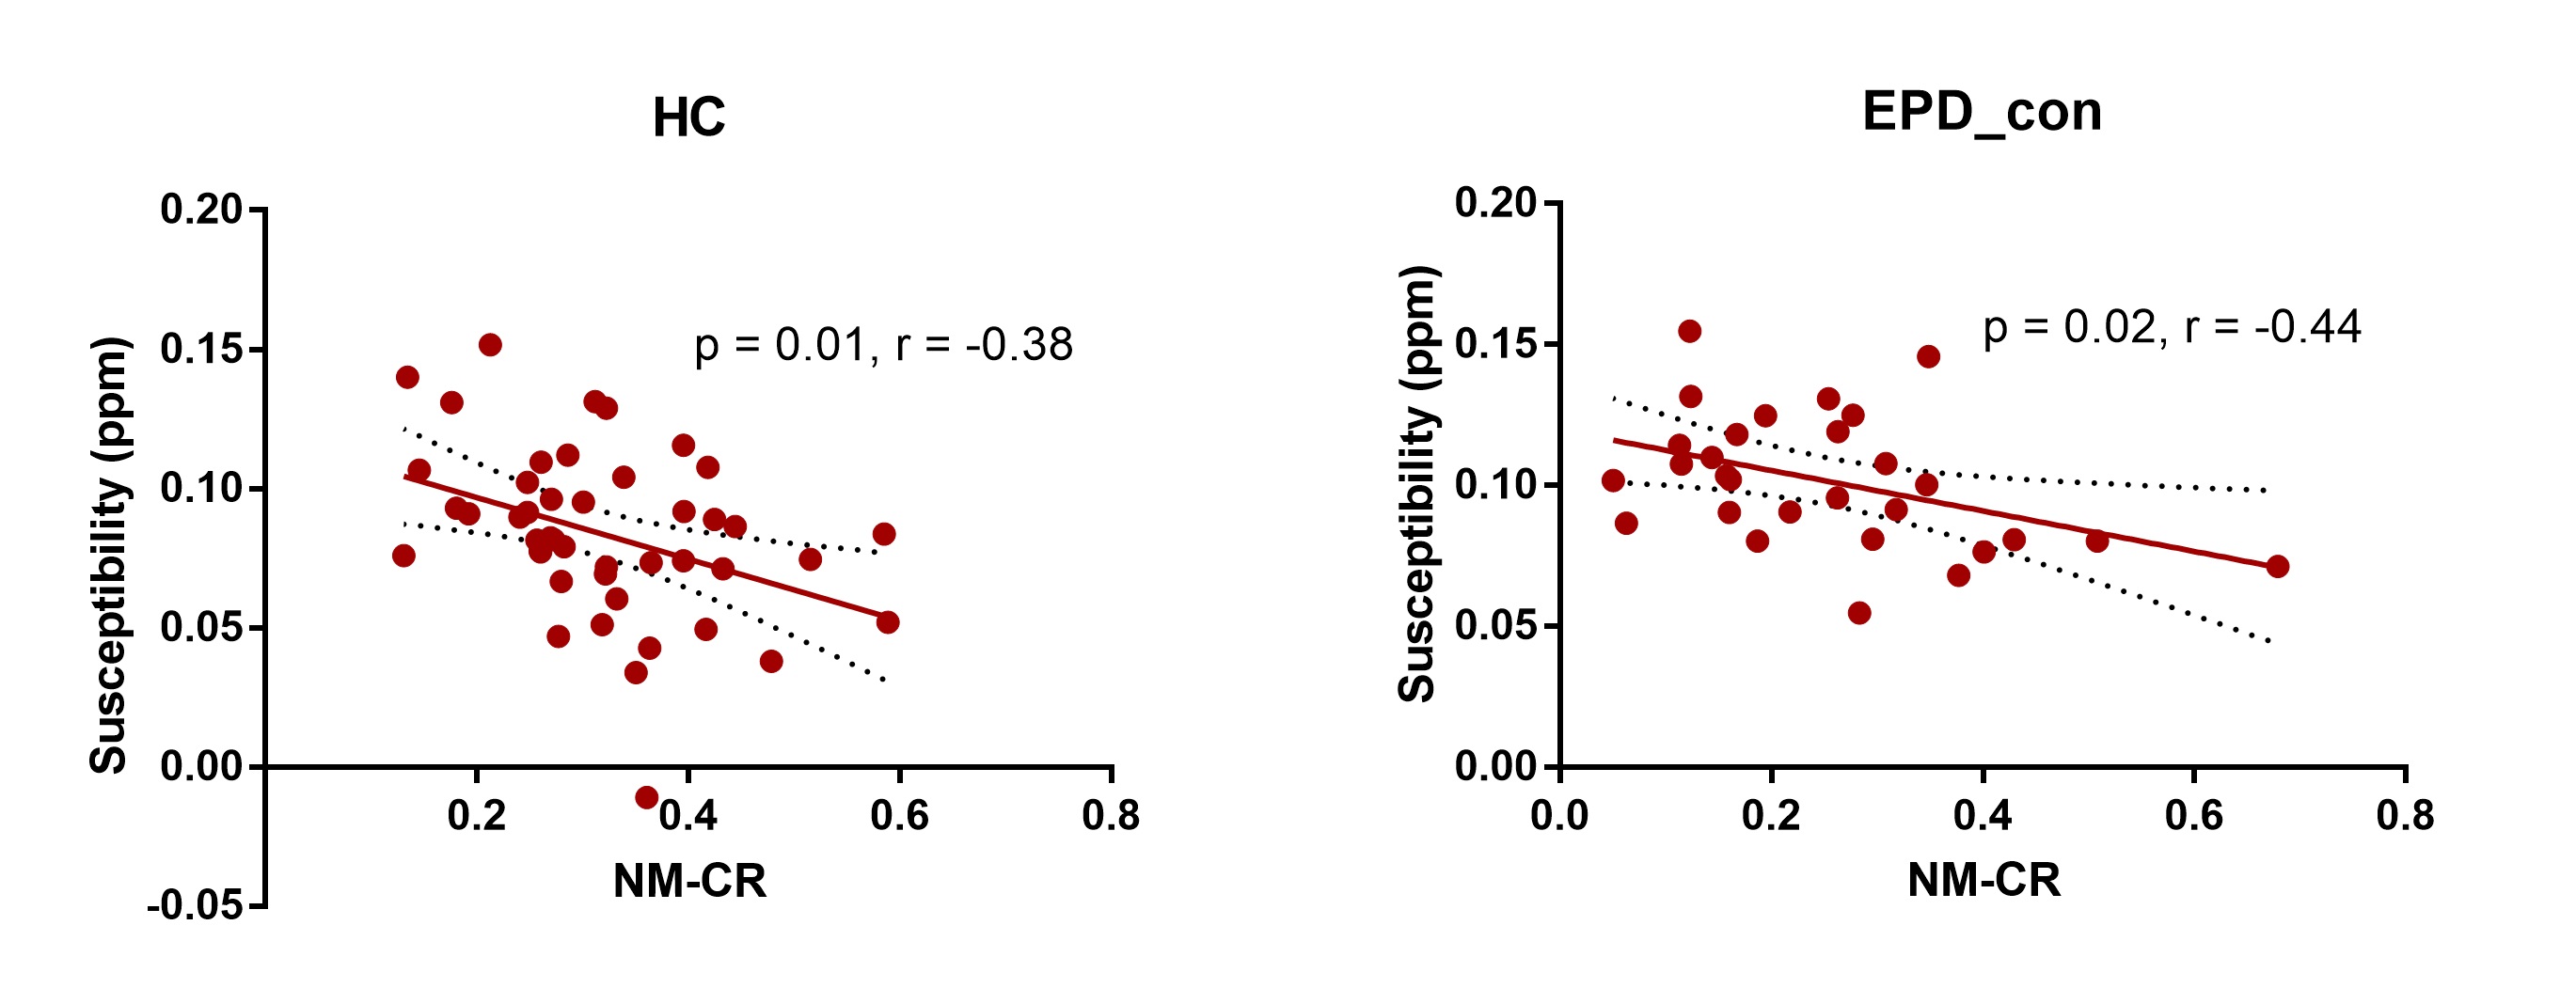
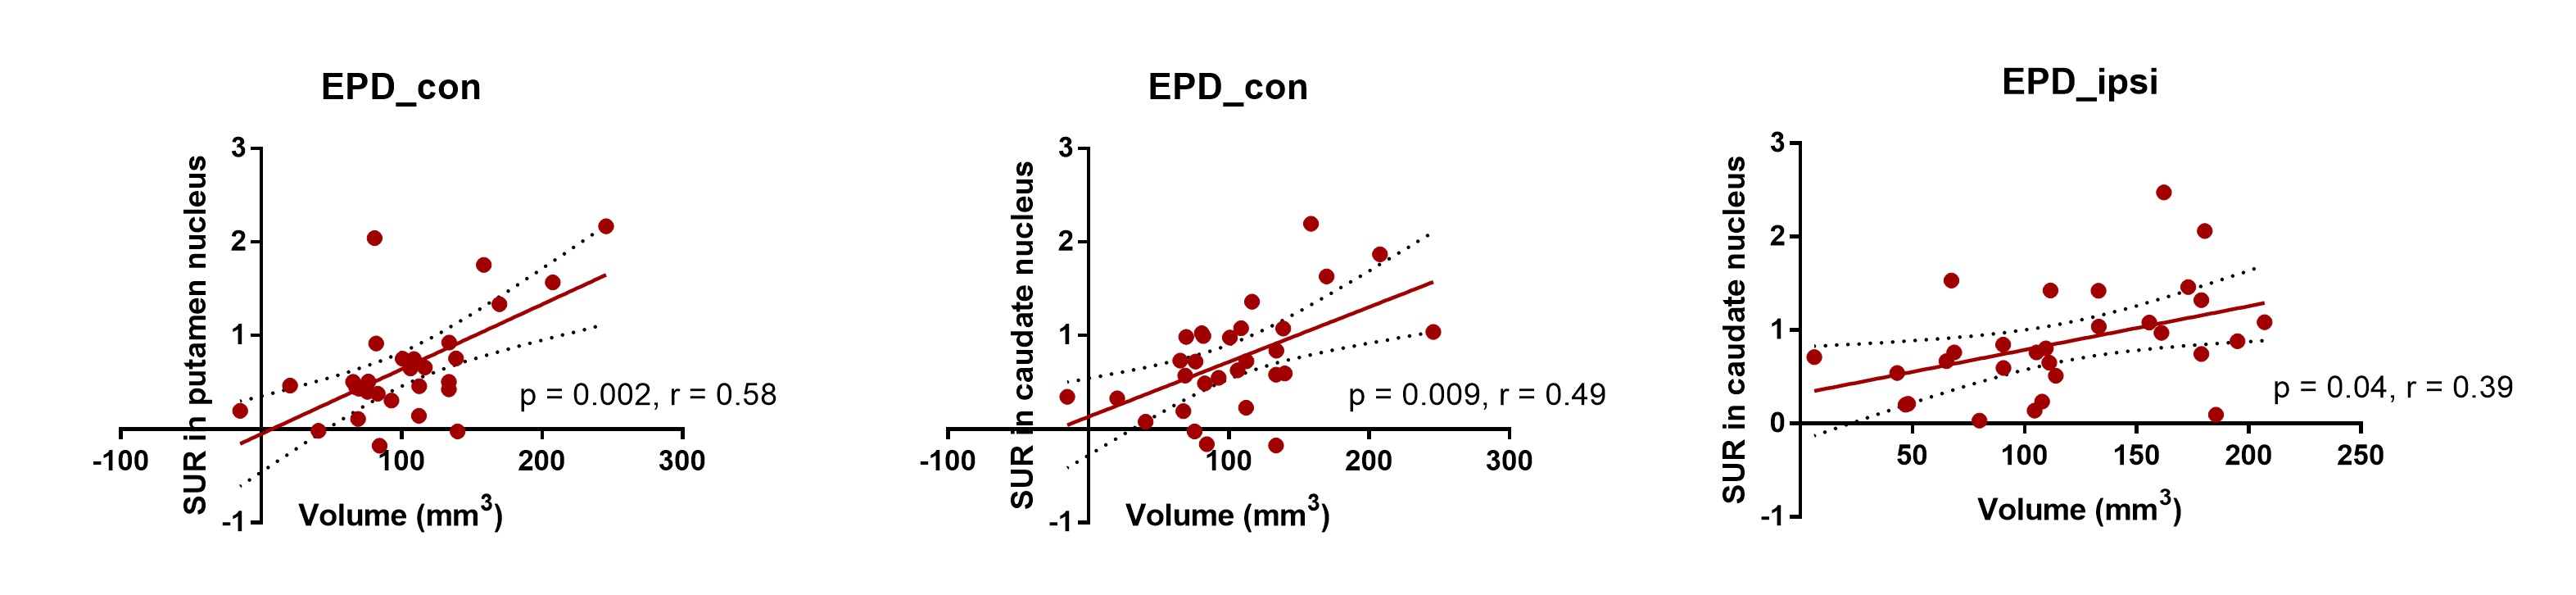
Results Compared with the HC group, the NM volumes in SNc of the contralateral and ipsilateral part of EPD patients were both decreased (152 ± 23.43 vs 103.9 ± 27.34 and 117.7 ± 26.93 mm3, p < 0.0001), CR values were both lower (0.32 ± 0.05 vs 0.26 ± 0.08 and 0.27 ± 0.06, p < 0.0001) and the susceptibility values were both higher (0.08 ± 0.02 vs 0.10 ± 0.01 and 0.10 ± 0.02 ppm, p < 0.0001) (Figure 1). There was no significant difference in NM volume, CR or susceptibility value in SNc between the contralateral and ipsilateral part of EPD patients. The SURs of contralateral SNc (0.25 ± 0.14 vs 0.29 ± 0.13, p = 0.044), putamen (0.67 ± 0.32 vs 0.84 ± 0.33, p < 0.0001) and caudate (0.74 ± 0.31 vs 0.87 ± 0.31, p < 0.0001) were all significantly lower than the ipsilateral side in EPD. There were negative correlations between susceptibility and CR value in HC (r = -0.38, p = 0.01), and in contralateral part of EPD (r = -0.44, p = 0.02) (Figure 2). In the contralateral part of EPD, there were positive correlations between NM volume and SUR in putamen (r = 0.58, p = 0.002) and in caudate (r = 0.49, p = 0.009), while in the ipsilateral part of EPD, the positive correlation was only found between NM volume and SUR in caudate (r = 0.39, p = 0.04) (Figure 3). The mean SUR of bilateral SNc was negatively correlated with the UPDRSIII score (r = -0.56, p = 0.003). The mean SUR of bilateral SNc, putamen and caudate were all negatively correlated with the score of posture and gait (SNc: r = -0.44, p = 0.02; putamen: r = -0.47, p = 0.01; caudate: r = -0.44, p = 0.02), and bradykinesia (SNc: r = -0.55, p = 0.003; putamen: r = -0.39, p = 0.04; caudate: r = -0.46, p = 0.02). The mean CR value was also negatively correlated with the score of posture and gait (r = -0.44, p = 0.02).
Conclusion Changes of neuromelanin and susceptibility on QSM images could quantitatively reflect the pathology of EPD and could be used as imaging biomarkers for diagnosing of EPD. The SUR measured by 18F-DTBZ images could reflect the lateralization in EPD patients. NM volume could reflect the striatal dopaminergic function, and both CR value and SUR could reflect the severity of motor impairment in EPD, which are expected to be used for monitoring the progression of EPD.
Acknowledgements
No acknowledgement found.References
1. Ward RJ, Zucca FA, Duyn JH, et al. The role of iron in brain ageing and neurodegenerative disorders[J]. The Lancet Neurology, 2014, 13(10): 1045-1060.
2. Damier P, Hirsch EC, Agid Y, et al. The substantia nigra of the human brain. II. Patterns of loss of dopamine-containing neurons in Parkinson's disease[J]. Brain : a journal of neurology, 1999, 122 ( Pt 8): 1437-1448.
3. Zucca FA, Segura-Aguilar J, Ferrari E, et al. Interactions of iron, dopamine and neuromelanin pathways in brain aging and Parkinson's disease[J]. Prog Neurobiol, 2017, 155: 96-119.
4. Ito H, Kawaguchi H, Kodaka F, et al. Normative data of dopaminergic neurotransmission functions in substantia nigra measured with MRI and PET: Neuromelanin, dopamine synthesis, dopamine transporters, and dopamine D2 receptors[J]. Neuroimage, 2017, 158: 12-17.
5. Martin-Bastida A, Lao-Kaim NP, Roussakis AA, et al. Relationship between neuromelanin and dopamine terminals within the Parkinson's nigrostriatal system[J]. Brain : a journal of neurology, 2019, 142(7): 2023-2036.
6. Kuya K, Ogawa T, Shinohara Y, et al. Evaluation of Parkinson's disease by neuromelanin-sensitive magnetic resonance imaging and (123)I-FP-CIT SPECT[J]. Acta Radiol, 2018, 59(5): 593-598.
Figures