3028
Automated Magnetic Resonance Parkinsonism Index: Test-Retest Reliability and 10 Year Changes in Aging and Parkinson’s Disease1Department of Diagnostic Radiology, Singapore General Hospital, Singapore, Singapore, 2Duke-NUS Medical School, Singapore, Singapore, 3Advanced Clinical Imaging Technology, Siemens Healthcare AG, Lausanne, Switzerland, 4Department of Radiology, Lausanne University Hospital and University of Lausanne, Lausanne, Switzerland, 5LTS5, École Polytechnique Fédérale de Lausanne, Lausanne, Switzerland, 6Department of Neurology, National Neuroscience Institute (Outram-campus), Singapore, Singapore, 7Health Services Research Unit, Singapore General Hospital, Singapore, Singapore
Synopsis
Progressive supranuclear palsy phenotypes are increasingly recognized and the Magnetic Resonance Parkinsonism Index (MRPI) useful in supporting clinical diagnosis. We examined the test-retest reliability of a landmark-based automated algorithm to derive MRPI from >2000 brain scans across different cohorts with neurodegeneration and MRI systems. We also investigated temporal changes in the MRPI derived from longitudinal scans 6–10 years apart in 53 subjects from case-control Parkinson’s disease cohorts. We found the automated MRPI fast (averaging 25s ± 2s per case) and reliable (average coefficient of variance <20%), without significant change in MRPI over time in aging and Parkinson’s disease.
Introduction
The Magnetic Resonance Parkinsonism Index (MRPI) accentuates midbrain relative to pons atrophy1, and is computed from $$MRPI = \frac{P}{M} \times \frac{MCP}{SCP} $$,where P and M are midsagittal pons and midbrain areas, and MCP and SCP averaged right and left middle and superior cerebellar peduncular widths respectively. MRPI is a useful clinical measure to differentiate patients with variant forms of progressive supranuclear palsy (PSP) from patients with idiopathic Parkinson’s disease (PD) and other atypical parkinsonian disorders such as multisystem atrophy–cerebellar subtype. However, the manual MRPI measure is time-consuming and subjective. Recently, a faster landmark-based approach2 to obtain automated MRPI compared to previous methodology3 (processing time averaging 25s±2s versus 2 min per subject) was developed. Although this method was promising and yielded high intraclass-correlation coefficient (ICC) with manual MRPI, larger scale validation is required before its use as a first-level diagnostic imaging tool for screening PSP phenotypes from other neurodegenerative disorders. We systematically examined the test-retest reliability and variability of automated MRPI values derived from patients with neurodegenerative diseases and age-matched healthy controls, acquired on MRI systems of differing field strengths. We further investigated changes in automated MRPI values in aging and PD cohorts from longitudinal scans 6–10 years apart.
Methods and Materials
Data acquisition: Two data sources were used (Table 1). The first comprised of longitudinal datasets of case-control PD cohorts (SGH-PD) with 3D high-resolution structural T1-weighted images acquired on different scanners: (a) 1.5T unit: TR/TE/TI/FA 1300/4.7/600ms/15deg; 224x256mm2 FOV; 224×256 matrix; 1mm slice thickness; 192 slices; with follow-up scan 6 years after baseline; (b) 3T unit: TR/TE/TI/FA 2200/3.0/900ms/9deg; 240×240mm2 FOV; 256×256 matrix; 0.9mm slice thickness; 192 slices; follow-up scan 10 years after baseline. These were used to evaluate agreement between automated and manual MRPI (measured by two raters) values before using automated MRPI to investigate temporal changes in aging and PD. The second data source from two Alzheimer's Disease Neuroimaging Initiative datasets (ADNI 1 and ADNI 2/GO) was used to evaluate test-retest reliability of automated MRPI values using the back-to-back repeat T1-weighted scans performed in the same imaging session with(out) iPAT.Automated MRPI: The landmark-based algorithm relies on spatial normalization of an input T1-weighted image to a homebuilt single-subject T1 template (64-year-old female) with coded landmarks (Fig. 1) via a fast, multiresolution iterative scheme4. All T1-weighted images were processed to yield automated MRPI and related measures on the MorphoBox automated segmentation prototype2.
Statistical analyses: Intraclass-correlation analysis was performed to assess the agreement between automated and manual MRPI values in the SGH-PD dataset and the test-retest reliability of automated MRPI values from within-session repeat scans in the ADNI datasets. Coefficient of variance (CV) analysis was employed to quantify the changes in automated MRPI values across MRI field strengths, study cohorts, and time-points.
Results
Intraclass-correlation analyses revealed moderate reliability between automated and manual MRPI for both 1.5T (ICC = 0.6210) and 3T (ICC = 0.7280) SGH-PD datasets regardless of subject status and time points, and moderate test-retest reliability between automated MRPI values from within-session repeat scans in both ADNI datasets (Fig. 2). CV values of the automated MRPI and its subcomponents in the datasets were lower than 0.18 (18%, Fig. 3), indicating acceptable variability for all measurements. Both manual and automated pons and midbrain area, and MCP width were highly reliable on 3T scans (CV < 0.1). Automated MRPI values were mildly higher (not significant, p > 0.05) at second time-point scans and in PD than controls of the SGH-PD cohorts (Table 2).Discussion
Our findings showed that the automated MRPI algorithm was robust and reliable on longitudinal scans, and across study cohorts and MRI systems. Although the CV of our automated MRPI values in both patients and controls were higher than that reported by Nigro et al.3 for repeat scans in controls only (CV = 0.04), our automated approach remains helpful in improving the efficiency of clinical assessments by rapidly screening out borderline cases for further manual scrutiny. Review of cases with relatively higher variability showed the findings to be related to non-perfect (even by merely 1-2mm) registration to the midsagittal plane in the template, as our algorithm is purely based on predefined landmarks2 (Fig. 1), which nevertheless afforded a much shorter computation time compared to tedious manual MRPI measurements. Several studies reported no significant difference in MRPI values derived from scans acquired on 1.5T and 3T systems2,3,5. However, except for the baseline scans in the SGH-PD cohorts, we found the CV of the MRPI, pons area, midbrain area and MCP generally lower in the 3T than 1.5T datasets, suggesting benefits from higher signal-to-noise ratio related to field strength with our landmark-based algorithm. As expected, manual SCP width was less variable, given human advantage for intrinsically fine measurements. The inability of MRPI to differentiate PD from healthy controls is unsurprising6, and relative stability of MRPI over ten years further confirmed expected lack of significant midbrain atrophy in PD patients, congruent with clinical diagnosis.Conclusion
A landmark-based algorithm was efficient and robust in producing reliable automated MRPI values, with clinical utility in expeditious rapid screening out of borderline PSP cases from common neurodegenerative disorders for further manual scrutiny.Acknowledgements
No acknowledgement found.References
1. Quattrone A, Nicoletti G, Messina D, Fera F, Condino F, Pugliese P, et al. MR imaging index for differentiation of progressive supranuclear palsy from Parkinson disease and the Parkinson variant of multiple system atrophy. Radiology 2008;246(1):214-221.
2. Scheffler M, Maréchal B, Boto J, Lövblad KO, Vargas MI. A method for fast automated assessment of the magnetic resonance parkinsonism index. Neuroradiology 2020;62(6):747-751.
3. Nigro S, Arabia G, Antonini A, Weis L, Marcante A, Tessitore A, et al. Magnetic Resonance Parkinsonism Index: diagnostic accuracy of a fully automated algorithm in comparison with the manual measurement in a large Italian multicentre study in patients with progressive supranuclear palsy. Eur Radiol 2017;27(6):2665-2675.
4. Chefd'hotel C, Hermosillo G, Faugeras O. Flows of diffeomorphisms for multimodal image registration. Proceedings IEEE International Symposium on Biomedical Imaging2002. p. 753-756.
5. Mangesius S, Krismer F, Gizewski ER, Müller C, Hussl A, Schocke M, et al. 1.5 Versus 3 tesla magnetic resonance planimetry in neurodegenerative parkinsonism. Mov Disord 2016;31(12):1925-1927.
6. Sankhla CS, Patil KB, Sawant N, Gupta S. Diagnostic accuracy of Magnetic Resonance Parkinsonism Index in differentiating progressive supranuclear palsy from Parkinson's disease and controls in Indian patients. Neurol India 2016;64(2):239-245.
Figures
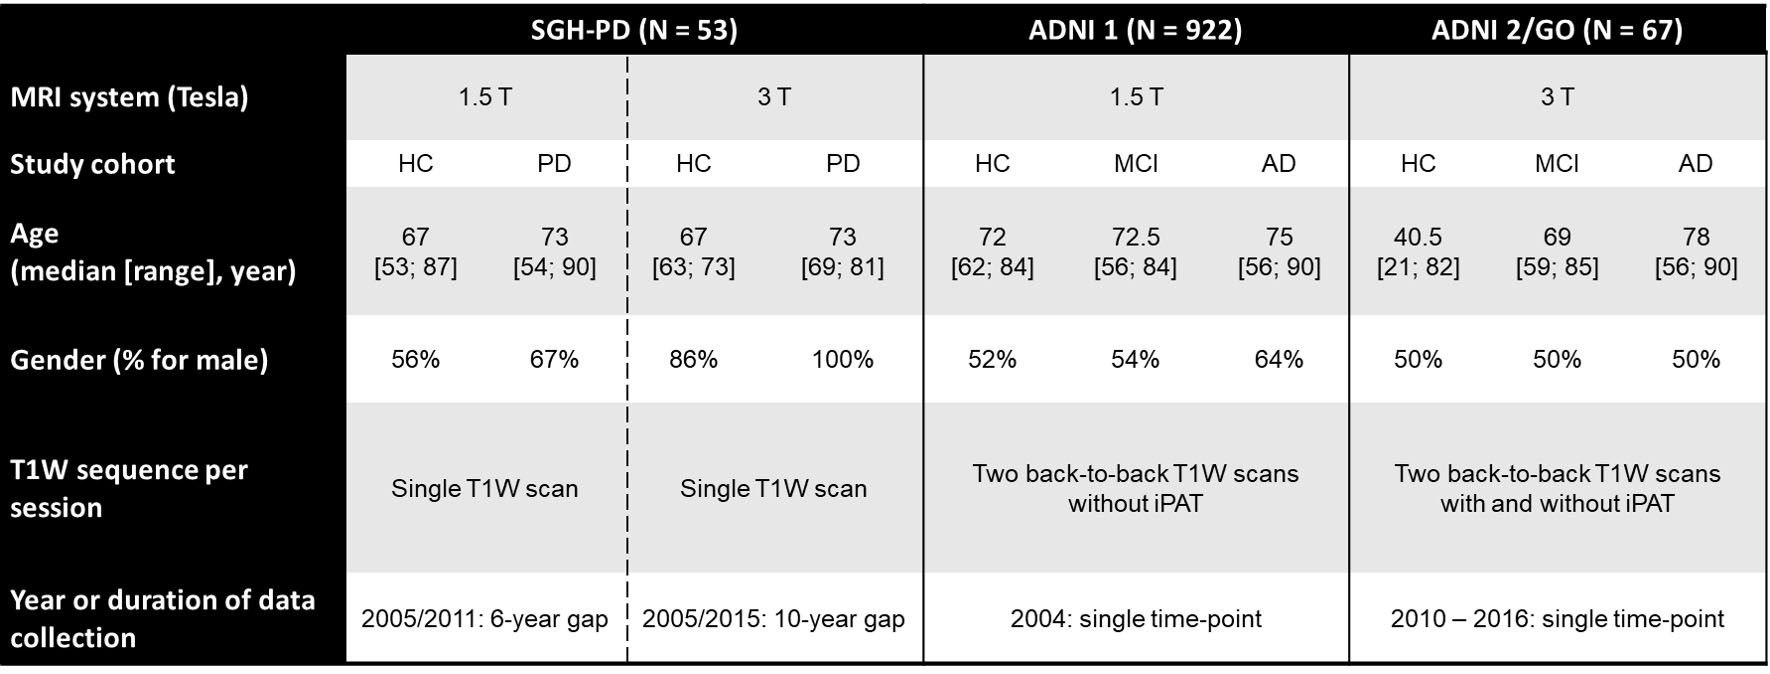
TABLE 1. Subject Demographics and Structural MRI Protocols of the Two Data Sources Used in this Study.
Abbreviations: AD = Alzheimer's Disease, ADNI = Alzheimer's Disease Neuroimaging Initiative, EMCI = Early Mild Cognitive Impairment, HC = Healthy Control, LMCI = Late Mild Cognitive Impairment, MPRAGE = Magnetization-Prepared Rapid Acquisition with Gradient Echo, PD = Parkinson’s Disease, TP = Time Point.
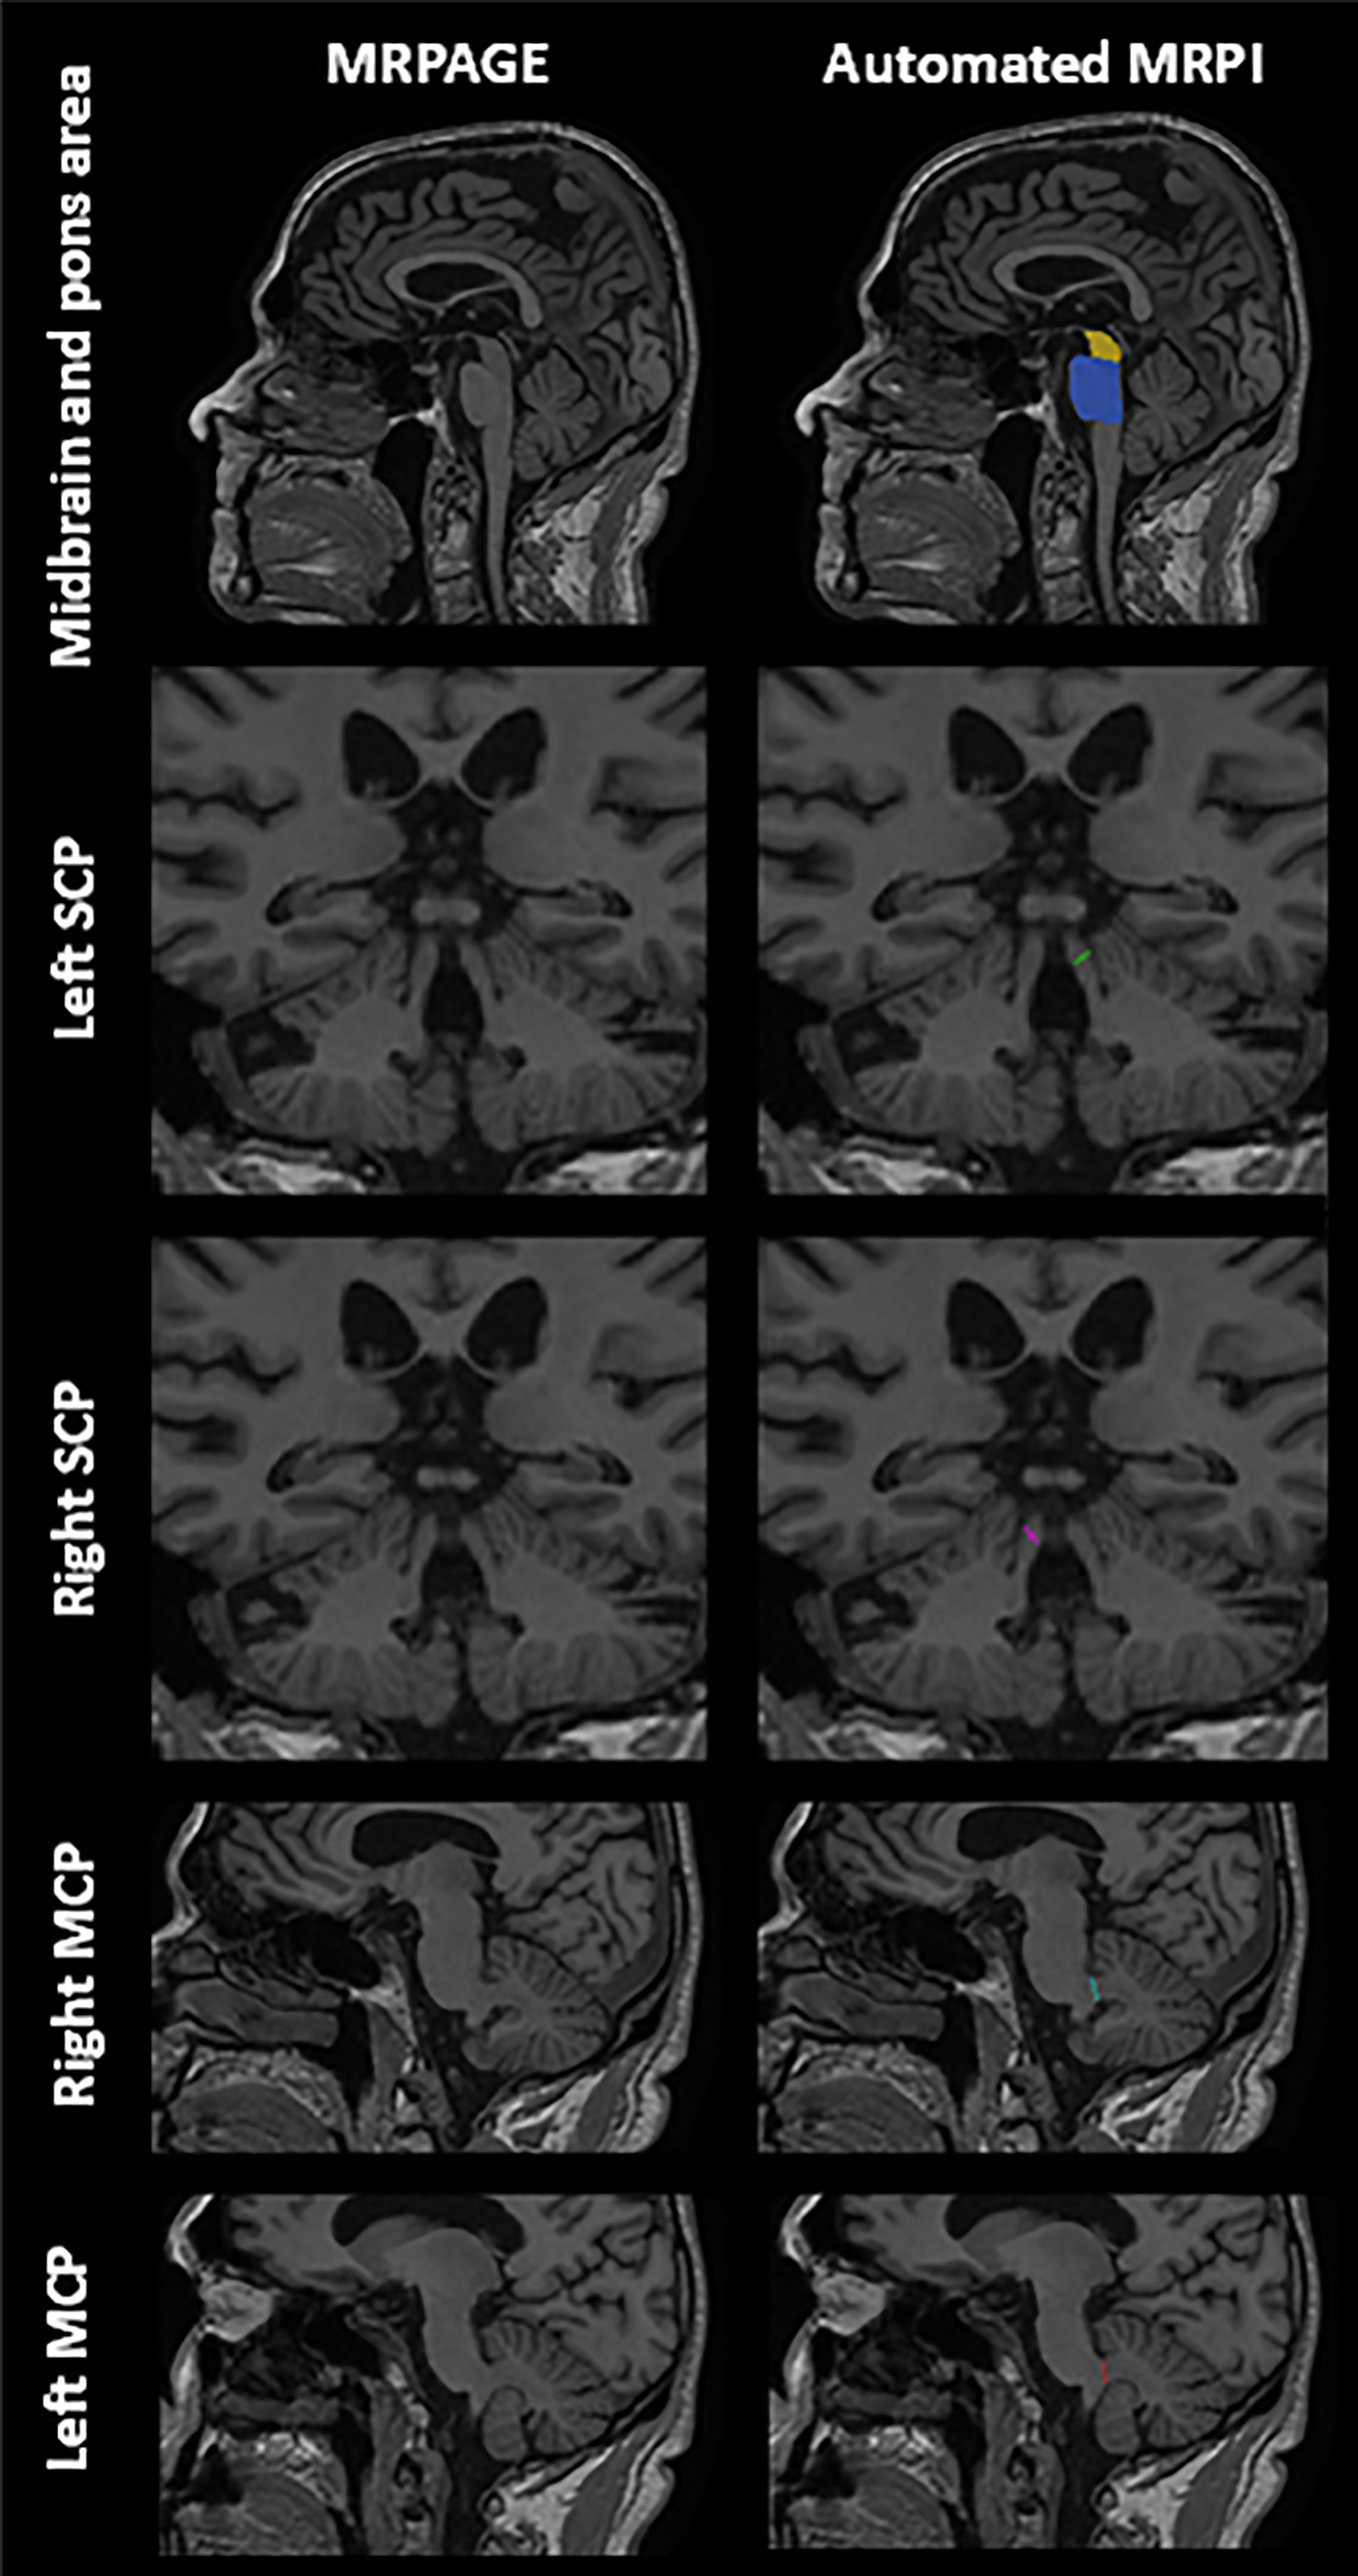
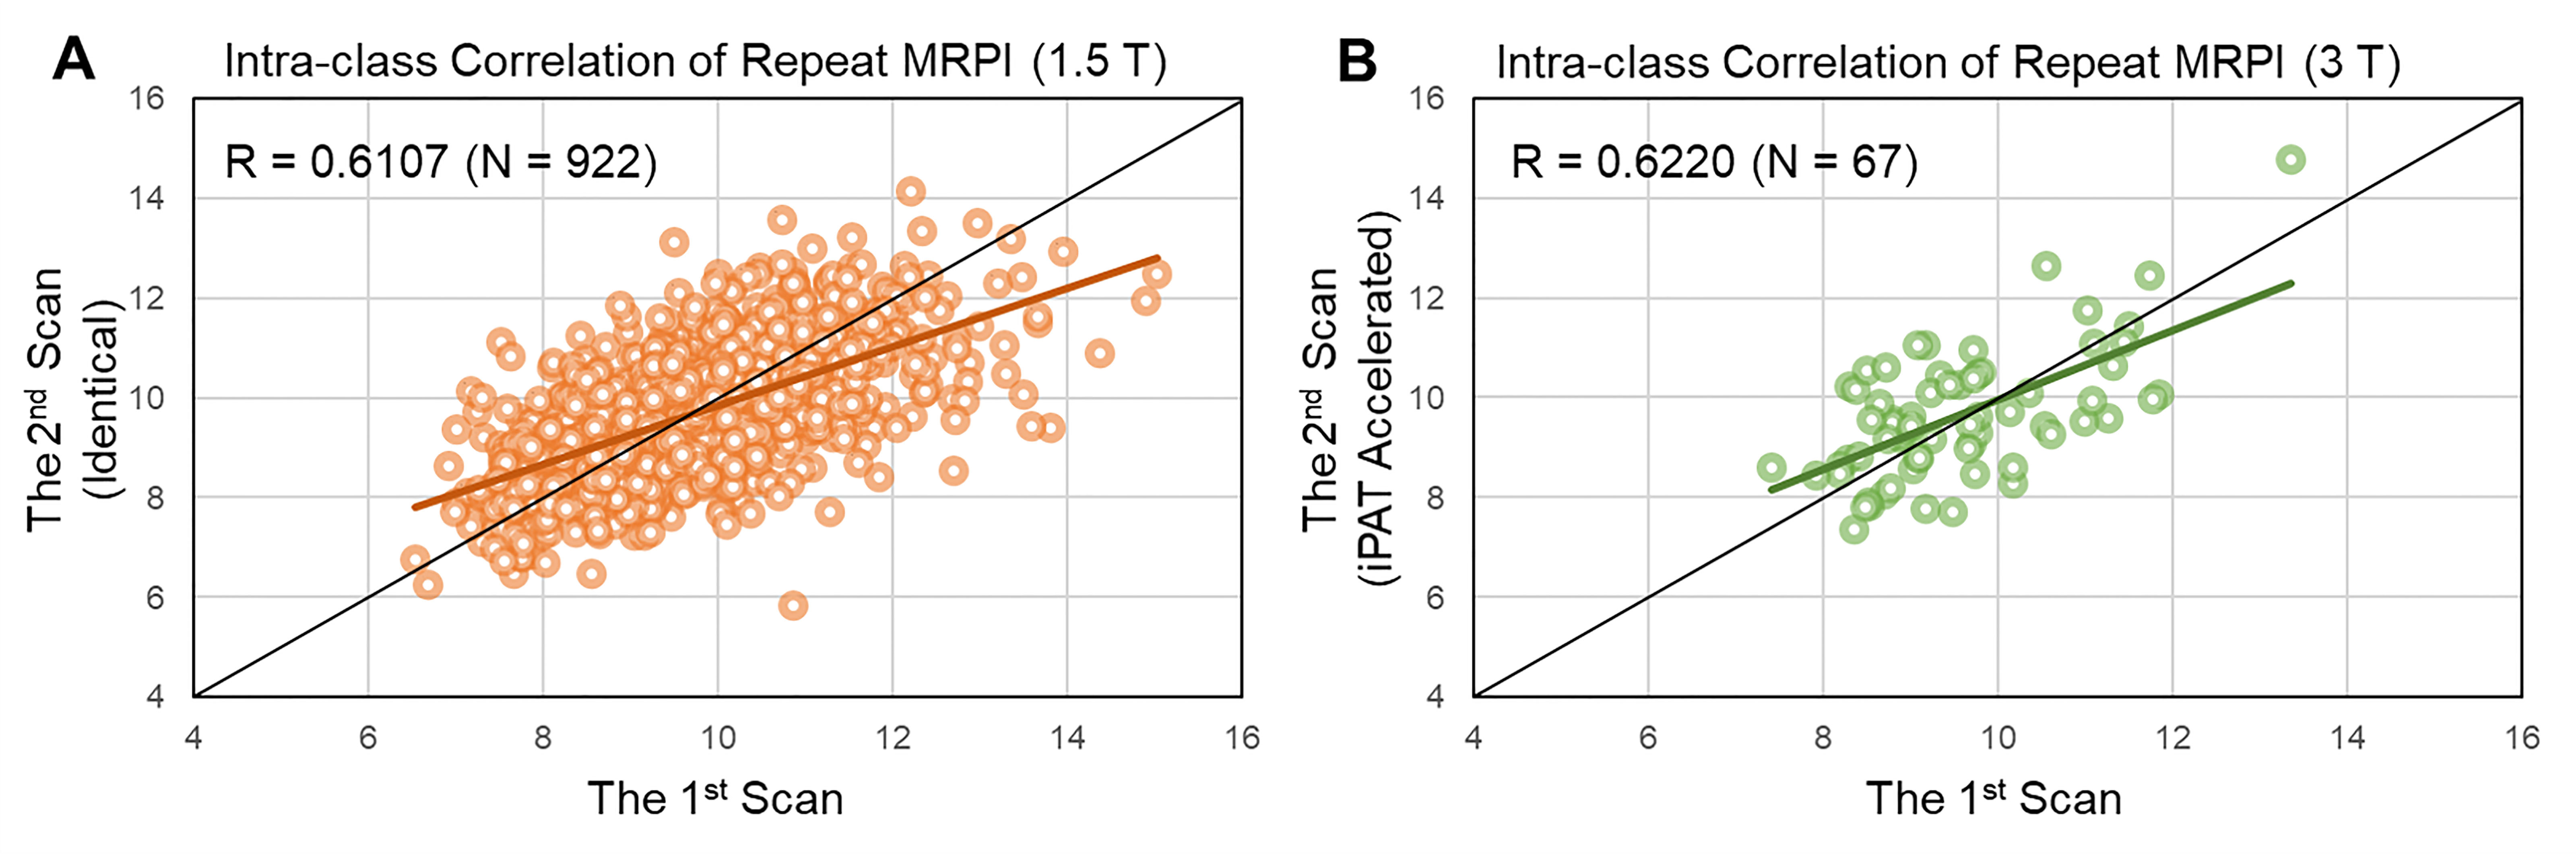
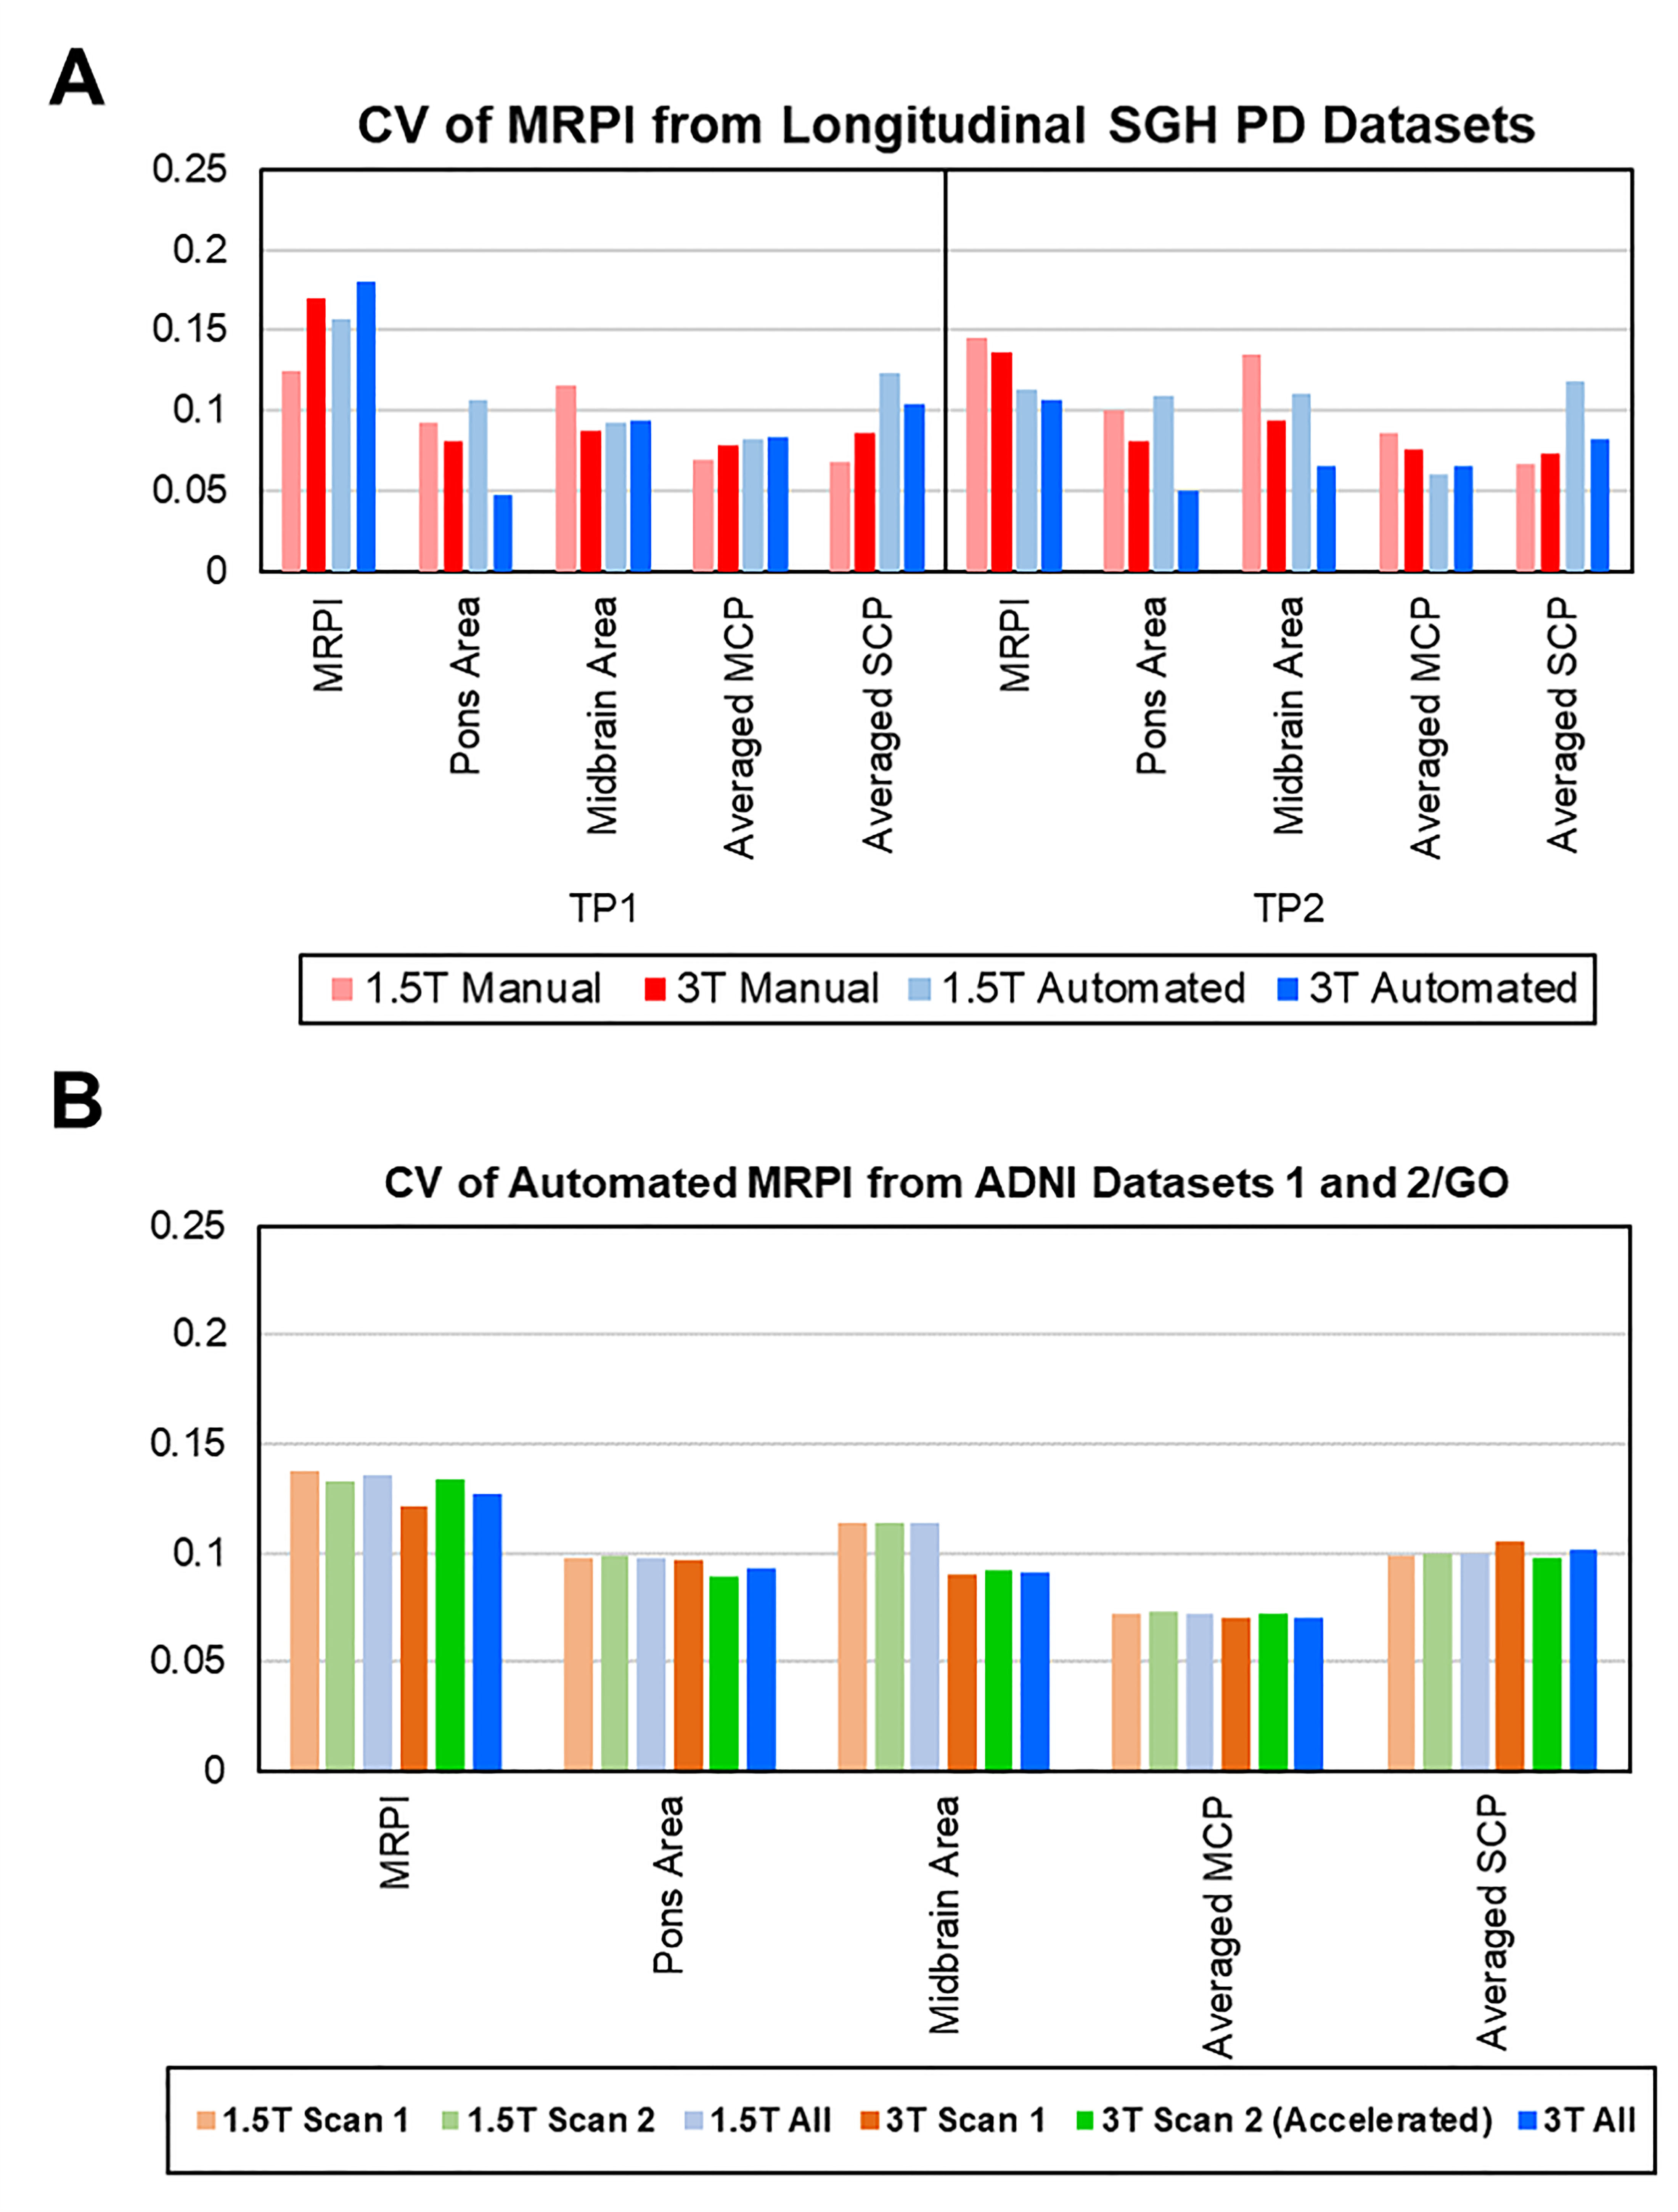
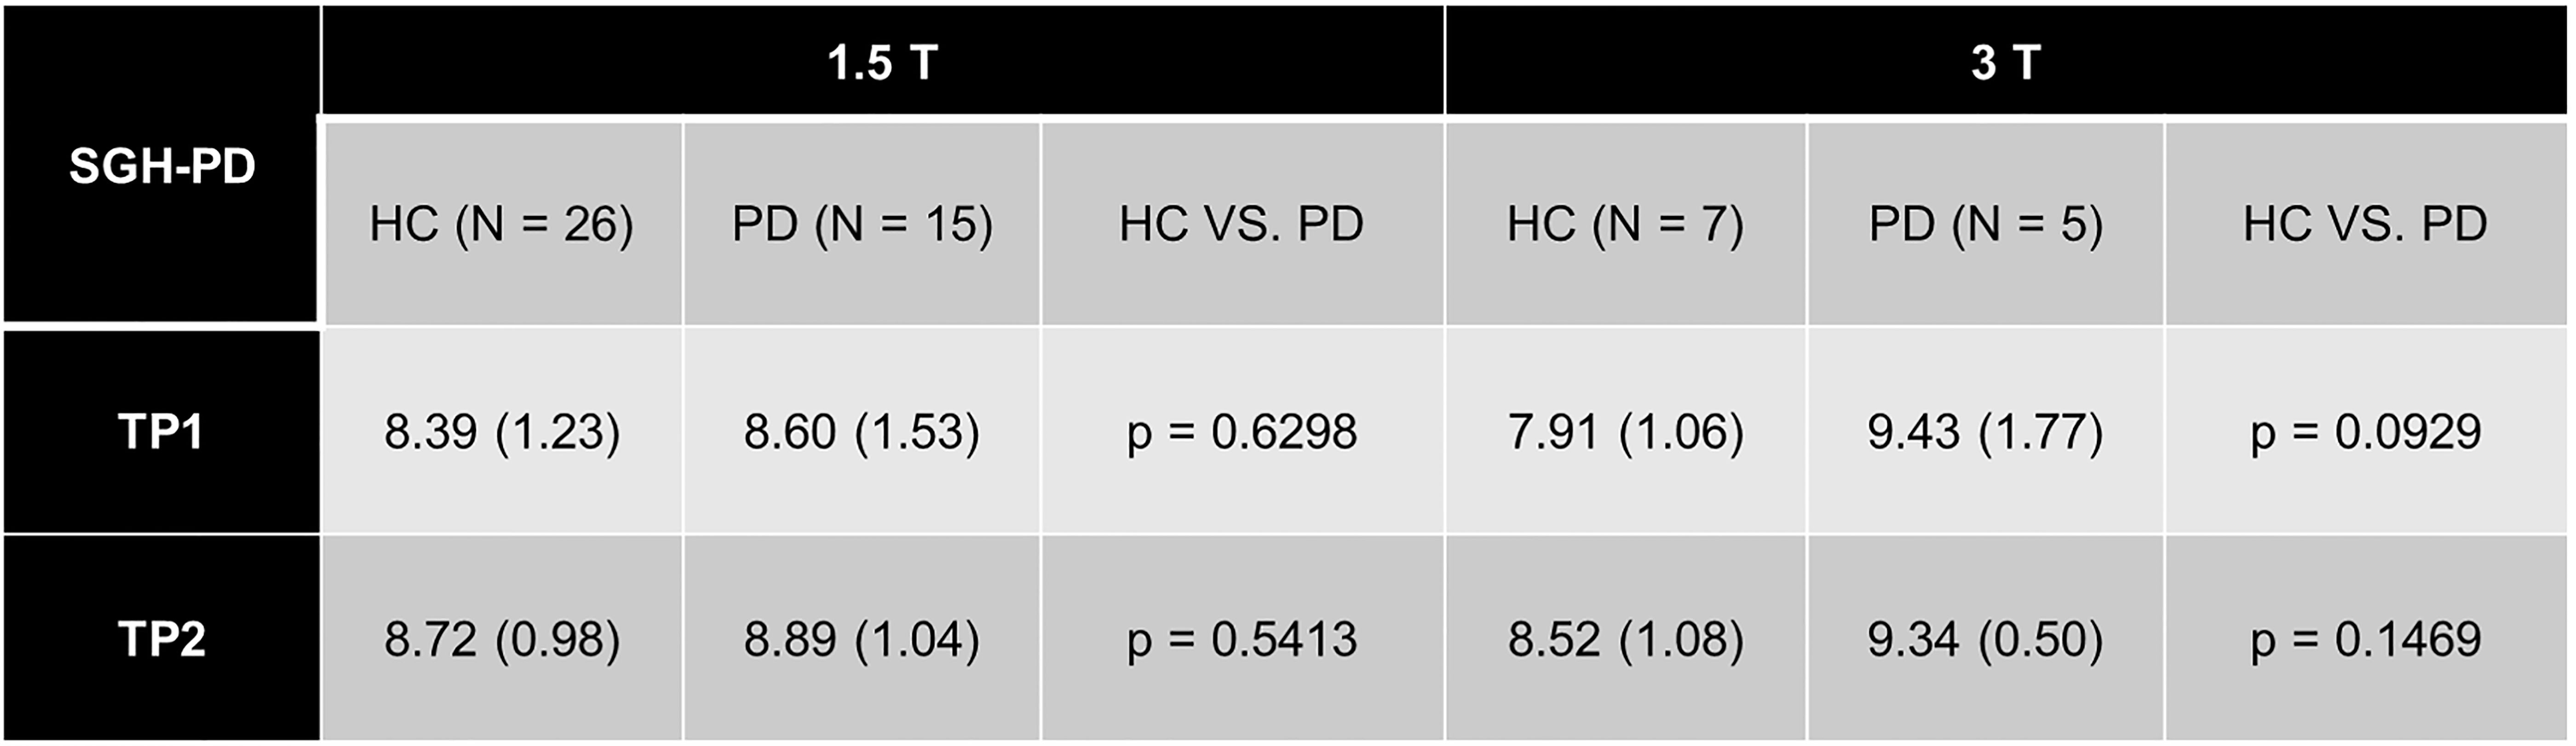
TABLE 2 Mean automated MRPI value from healthy aging controls and PD patients in the longitudinal SGH-PD datasets six (1.5T) and ten (3T) years apart.
Abbreviations: HC = Healthy Control, PD = Parkinson’s Disease, TP = Time Point.