3026
The perfusion deficits in general cognitive, executive, and visual dysfunction in Parkinson's disease measured by arterial spin labeling MRI1Biomedical Engineering, Biomedical Engineering Institution, Bogazici University, Istanbul, Turkey, 2Behavioral Neurology and Movement Disorders Unit, Department of Neurology, Istanbul Faculty of Medicine, Istanbul University, Istanbul, Turkey, 3Department of Physiology, Faculty of Medicine, Demiroglu Bilim University, Istanbul, Turkey, 4Neuroimaging Unit, Hulusi Behcet Life Sciences Research Center, Istanbul University, Istanbul, Turkey, 5Department of Neuroscience, Aziz Sancar Institute of Experimental Medicine, Istanbul University, Istanbul, Turkey, 6Department of Psychology, Faculty of Arts and Sciences, Isik University, Istanbul, Turkey, 7CorTechs Labs, San Diego, CA, United States, 8Department of Physiology, Istanbul Faculty of Medicine, Istanbul University, Istanbul, Turkey
Synopsis
The main aim of this study was to detect perfusion deficits at general executive, cognitive and visual domains of Parkinson's disease (PD) patients with mild cognitive impairment and normal cognition compared to healthy controls based on cerebral blood flow (CBF) maps obtained with arterial spin labeling MRI (ASL-MRI). CBF maps were calculated by fitting a general kinetic curve model for each pixel of ASL-MR images. A hypoperfusion pattern was observed in PD in line with general cognitive and executive dysfunction.
INTRODUCTION
The current diagnosis of mild cognitive impairment in Parkinson's disease (PD) is based on the neuropsychological test (NPT) scores, which are not entirely objective.1 Therefore, there is a need for more objective biomarkers to identify the cognitive impairment in PD. Arterial spin labeling MRI (ASL-MRI) noninvasively measures the cerebral blood flow (CBF).2 The main aim of this study was to assess perfusion deficits specific to the general executive, cognitive, and visual domains in PD patients with mild cognitive impairment (PD-MCI) and normal cognition (PD-CN) and compare the results to the healthy controls (HC).METHODS
27 PD-MCI patients, 26 PD-CN patients, and 15 HC were included in this study. All subjects were previously diagnosed based on an extensive neuropsychological test battery and provided written informed consent. ASL-MR images of the subjects were acquired using STAR labeling with Look-Locker sequence. A program was written in MATLAB R2018a (MathWorks Inc., Natick, MA) to calculate CBF maps3,4. Then, CBF maps were registered into MNI152 brain atlas using FMRIB Software Library (FSL) (http://fsl.fmrib.ox.ac.uk/fsl/fslwiki/). Two PD groups (PD-CN and PD-MCI) were first collapsed as a single patient group of 53 individuals and then divided into two groups of low performers (LP) and high performers (HP) in general cognitive, executive, and visual domains. For the general cognition, composite z-scores of Addenbrookes Cognitive Examination-Revised (ACE-R)5, Mini-Mental State Examination (MMSE)6 and Montreal Cognitive Assessment (MOCA)7 were calculated as the average of their respective z-scores for each patient, and the lowest and highest tertile z-scores were taken as LP and HP, respectively. Similarly, for the visual domain, the lowest and highest tertile z-scores of Line Orientation Test (JLO)8 were used to determine LP and HP, respectively. For the executive domain, composite z-scores of Wisconsin Card Sorting Test (WCST)9 percentage of perseverative response and Stroop10 interference duration measures were used, and highest and lowest tertile z-scores were taken as LP and HP, respectively. Furthermore, the same procedure was applied to the scores of all of the participants, including the HC group. Then, CBF maps of LP and HP in these cognitive domains were compared using two-sample t-tests for both the PD and all participants in the SPM12 software package (http://www.fil.ion.ucl.ac.uk/spm/). For all of the performed two-sample t-tests, the statistical significance level was set to an uncorrected cluster forming threshold of P < 0.005 and cluster level FWE threshold of P < 0.05, with a minimum cluster size of 50 voxels. The Montreal Neurological Institute (MNI) coordinates were used to locate areas of statistically significant differences using xjview V 8.14 (http://www.alivelearn.net/xjview8/). Moreover, these MNI coordinates were matched to 100 different parcellations of the cerebral cortex, corresponding to 7 resting state functional MRI (rsfMRI) networks that were proposed by Schaefer et al.11, and also Talairach atlas12 using FSLeyes to label the anatomical regions.RESULTS
When all three groups of participants were collapsed together and divided into tertiles according to z-scores in general cognition, the comparison of the lowest tertile group with the highest tertile group revealed significantly lower CBF changes in LP in two areas, which were a right superior parietal area, centered in angular gyrus and extending into superior parietal lobe (SPL) (P<0.001); and a left superior parietal area, covering SPL, centered in Broadman area (BA) 7 (P=0.037) (Table 1). These regions had symmetric hypoperfusion in the posterior parietal cortex (PPC) corresponding to the border zone of posterior hubs of the bilateral frontoparietal network (FPN) and dorsal attention network (DAN). When only two PD groups were combined, the same analysis did not show any significant differences between HP and LP. The same analysis was also repeated with the executive domain z-scores. Again, the differences observed were in the combined three groups, but not in the combined two patient groups. Executive domain LP showed significantly lower CBF values as compared to HP in three areas, which were right middle frontal gyrus (MFG), centered in BA9 (P=0.042); left inferior parietal lobule (IPL), centered in BA39-angular gyrus (AG) and extending into supramarginal gyrus (BA40-SMG) (P=0.008); and left SPL, centered in BA7 (P=0.049) (Table 1). Figure 1 shows the statistically significantly different brain regions between HP and LP groups in general cognitive and executive domains. The comparison in the executive domain revealed two posterior areas in the left hemisphere. The first one was with the peak coordinates in the border zone of DAN and FPN, and the second one was with peak coordinates in the border zone of FPN and default mode network (DMN). There were no statistically significant CBF differences between HP (4 HC, 7 PD-CN, 12 PD-MCI) and LP (6 HC, 10 PD-CN, 7 PD-MCI) z-score subgroups of the visual domain either in all subjects or in PD patients.DISCUSSION AND CONCLUSION
The CBF values of patients having LP were lower than that of patients having HP in posterior parts of the brain in PD patients. Posterior hypoperfusion could be associated with worse performance on NPT regarding general cognitive and executive functions. In future studies, partial volume correction will be included. In conclusion, the perfusion deficits detected by the ASL-MRI technique could be useful to identify cognitive and executive dysfunction.Acknowledgements
This study was supported by TUBITAK project #115S219 and Istanbul University Scientific Research Projects Unit project #1567/42362.References
1. Hughes AJ, Daniel SE, Kilford L, Lees AJ. Accuracy of clinical diagnosis of idiopathic Parkinson's disease: a clinico-pathological study of 100 cases. J Neurol Neurosurg Psychiatry 1992;55(3):181-184.
2. Petcharunpaisan S, Ramalho J and Castillo M. Arterial spin labeling in neuroimaging. World J Radiol. 2010; 2: 384-98.
3. Gunther M, Bock M and Schad LR. Arterial spin labeling in combination with a look-locker sampling strategy: inflow turbo-sampling EPI-FAIR (ITS- FAIR). Magn Reson Med. 2001; 46: 974-84.
4. Chappell MA, MacIntosh BJ, Donahue MJ, Gunther M, Jezzard P and Woolrich MW. Separation of macrovascular signal in multi-inversion time arterial spin labelling MRI. Magn Reson Med. 2010; 63: 1357-65.
5. Mioshi E, Dawson K, Mitchell J, Arnold R and Hodges JR. The Addenbrooke's Cognitive Examination Revised (ACE-R): a brief cognitive test battery for dementia screening. Int J Geriatr Psychiatry. 2006; 21: 1078-85.
6. Folstein MF, Folstein SE and McHugh PR. "Mini-mental state". A practical method for grading the cognitive state of patients for the clinician. J Psychiatr Res. 1975; 12: 189-98.
7. Nasreddine ZS, Phillips NA, Bedirian V, et al. The Montreal Cognitive Assessment, MoCA: a brief screening tool for mild cognitive impairment. J Am Geriatr Soc. 2005; 53: 695-9.
8. Benton AL, Hamsher KD, Varney NR and Spreen O. Judgment of line orientation. New York: Oxford University Press. 1983.
9. Robinson AL, Heaton RK, Lehman RA and Stilson DW. The utility of the Wisconsin Card Sorting Test in detecting and localizing frontal lobe lesions. J Consult Clin Psychol. 1980; 48: 605-14.
10. Stroop JR. Studies of Interference in Serial Verbal Reactions (Reprinted from Journal Experimental-Psychology, Vol 18, Pg 643-662, 1935). J Exp Psychol Gen. 1992; 121: 15-23.
11. Schaefer A, Kong R, Gordon EM, et al. Local-Global Parcellation of the Human Cerebral Cortex from Intrinsic Functional Connectivity MRI. Cereb Cortex. 2018; 28: 3095-114.
12. J; T and P T. Co-planar stereotaxic atlas of the human brain. Thieme, New York.1988.
Figures
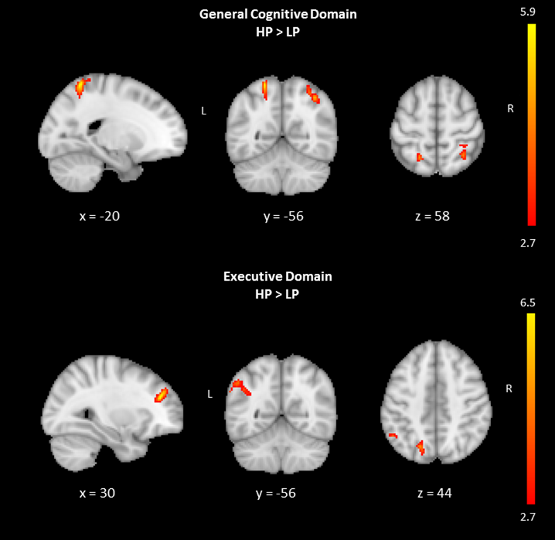
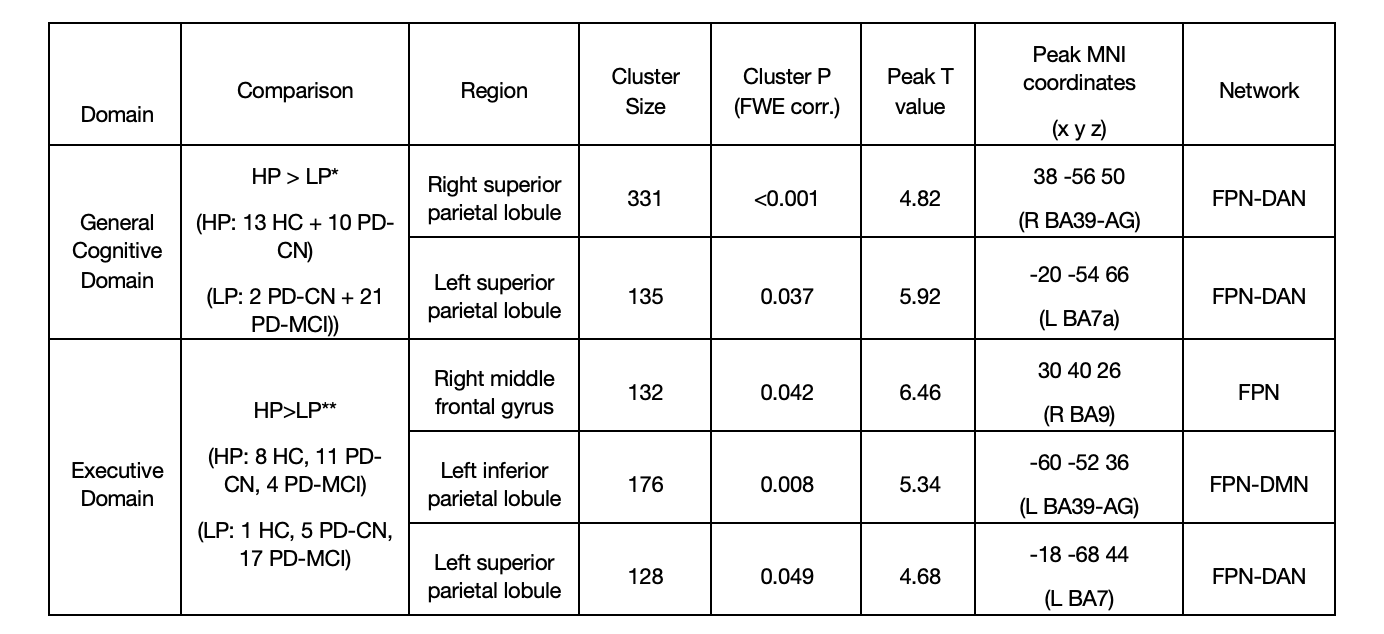
Table 1. Regions of CBF differences between two groups defined based on composite z-scores in general cognitive domain and executive domain within the entire subject group.
* The composite z-scores are the average of the z-converted raw scores of ACE-R, MMSE and MOCA. Median of the composite z-scores: - 1.22.
** The composite z-scores are the average of the z-converted raw scores of WCST percentage of perseverative responses score and Stroop interference duration score. Median of the composite z-scores: 0.56.