3025
Subcortical grey matter changes associated with motor skills in Parkinson Disease: a longitudinal study1Center for Mind/Brain Sciences - CIMeC, Mattarello, Italy
Synopsis
This study investigated the subcortical structural modifications associated with motor symptoms of Parkinson Disease (PD) over time.
Fifty subjects with PD performed two MRI sessions (baseline/48months). Motor symptoms were assessed using the Unified Parkinson’s Disease Rating Scale III.
Our results showed an atrophy over time in all subcortical regions linked to the progression of PD. Furthermore, a reduced volume in thalamus and an increased volume in pallidum were associated with a decline in motor skills, consistent with the model of thalamo-cortical functional loops. Finally, we confirm that VBM and volumetry are complementary tools to assess brain degeneration in PD.
Introduction
In Parkinson Disease1–17 (PD), it is widely known that structural subcortical modifications are related to motor deficits. Still, little is known about the association between grey matter alterations and motor symptoms, which is of essential importance to improve the diagnosis of PD and to identify novel and efficient targets for therapy. Therefore, the aim of our study was to investigate the subcortical modifications associated with motor symptoms of PD over time using voxel-based morphometry (VBM) and automated volumetric methods. Furthermore, we compared results from VBM and ROI-based volumetry to gather additional knowledge on brain alterations in PD which is still a largely debated topic16,18–20.Methods
Fifty subjects with PD were selected from the Parkinson's Progression Markers Initiative (PPMI) database. All subjects performed an MRI session at two time points: at baseline (i.e. at maximum 2 years after clinical diagnosis of PD) and after 48 months. Motor symptoms were assessed using the part III of the Unified Parkinson’s Disease Rating Scale at the two time points.MRI images (3DT1-MPRAGE) were acquired on a 3T scanner (TrioTim, Siemens, Germany) with a 32-channel head coil.
Data pre-processing was carried out using the CAT12 toolbox within SPM12. Fourteen regions of interest (ROI) were selected in each hemisphere from the “neuromorphometric” atlas (MNI space): nucleus accumbens, amygdala, caudate, hippocampus, pallidum, putamen and thalamus. For each ROI, we assessed: (i) local grey matter differences between baseline and 48 months with a paired t-test using VBM and volumetric data and (ii) local grey matter modifications associated with UPDRS-III scores separately at baseline and at 48 months, adopting regression analyses for VBM and Pearson’s correlation analyses for volumetry.
Statistical analyses of VBM analyses were performed using FSL software with 5,000 permutations adopting the Randomize toolbox. VBM results were reported with a statistical p-value threshold corresponding to p<0.05 using Threshold-Free Cluster Enhancement (TFCE) method corrected for multiple comparisons with family-wise error rate (FWE). Results were corrected by age, sex and total intracranial volume.
Statistical analyses of volumetric data were performed using R software in each ROI. Skewed variables (subcortical grey matter volumes) were log-transformed to normalize their distribution before statistical analyses21–24. Paired t-tests were performed using Bonferonni correction for multiple comparisons. Then, correlation analyses (Pearson’s correlation coefficient) were performed.
Results
1. VBMCompared to baseline, PD subjects at 48 months showed a significant decrease in grey matter volume in all ROIs (nucleus accumbens, amygdala, caudate, hippocampus, pallidum, putamen and thalamus). Results are illustrated in Figure 1.
At 48 months, grey matter volume was associated negatively with UPDRS-III scores in the bilateral thalamus and positively in the right pallidum. At baseline, no significant association was identified. These findings were reported in Figure 2.
2. Volumetry
Compared to baseline, PD subjects at 48 months showed significantly decreased grey matter volume in accumbens (left: <10−3 ; right: 0.002), amygdala (left: <10−3 ; right: <10−3), caudate (left: <10−3 ; right: <10−3), hippocampus (left: <10−3 ; right: <10−3) and thalamus (left: <10−3 ; right: <10−3). These results were summarized in Figure 3.
At baseline, grey matter volume was associated positively with UPDRS-III scores in the right pallidum (r=0.19, p=0.02). At 48 months, grey matter volume was associated negatively with UPDRS-III scores in the bilateral thalamus (left: r=-0.30, p=0.03; right: r=-0.35, p=0.01) and positively in the bilateral pallidum (left: r=0.39, p=0.004; right: r=0.35, p=0.01). These correlations are presented in Figure 4 and 5.
Discussion
When comparing baseline with 48 months, we showed a general atrophy in almost all subcortical regions using VBM and volumetry. This finding supports the accepted subcortical alteration associated with PD progression6,9,13,16. We provided also new evidence of a reduced volume in the thalamus and an increased volume in pallidum which may be related to the general decline in motor skills. These results are in accordance with the model of thalamo-cortical functional loops25–31 and support the hypothesis of a structure–function relationships between specific regions of these loops and behavioral performance. Finally, this study also helps to determine which is the best classical method (VBM or volumetry) to characterize the structural changes of the brain that is still widely debated16,18–20. Our results confirm that these methods should be used jointly as complementary tools to assess brain modifications, as already suggested previously18,19,29,32–34.Conclusion
To conclude, our study confirmed the existence of a general atrophic process within subcortical structures following the progression of PD. We described a decreased grey matter volume in all subcortical regions over time (48 months) using both VBM and volumetry. We described, for the first time, that a decreased grey matter volume in thalamus and an increased grey matter volume in pallidum were correlated with increased motor symptoms severity. These structural changes are consistent with the proposed role of basal ganglia-thalamocortical circuits in controlling movement in Parkinson's disease. Our results showed that VBM and volumetry are complementary approaches to investigate brain alterations in PD. All in all, our finding helped in better clarifying parkinsonism-related changes and their association with motor deficits, highlighting the thalamus and pallidum as possible targets for effective therapeutic intervention.Acknowledgements
The study was supported by Comune di Rovereto, with the project: “Study of the neural bases underlying the beneficial effects of physical activity Parkinson's disease”. Data used in the preparation of this article were obtained from the Parkinson’s Progression Markers Initiative (PPMI) database (www.ppmi-info.org/data). For up-to-date information on the study, visit www.ppmi-info.org. PPMI is sponsored and partially funded by the Michael J Fox Foundation for Parkinson’s Research and funding partners, including Abbvie, Avid Radiopharmaceuticals, Biogen, Britsol-Myers Squibb, Covance, GE Healthcare, Genetech, GlaxoSmithKline, Lilly, Lundbeck, Merck, Meso Scale Discovery, Pfizer, Piramal, Roche, Servier, and UCB. Neither the funding agency nor any of the sponsors of the PPMI were involved in the design and conduct of the study; collection, management, analysis, and interpretation of the data; preparation, review, or approval of the manuscript; and decision to submit the manuscript for publication.References
1. Lisanby, S. H. et al. Diminished subcortical nuclei volumes in Parkinson’s disease by MR imaging. J. Neural Transm. Suppl. 40, 13–21 (1993).
2. Ghaemi, M., Hilker, R., Rudolf, J., Sobesky, J. & Heiss, W. Differentiating multiple system atrophy from Parkinson’s disease: contribution of striatal and midbrain MRI volumetry and multi-tracer PET imaging. J. Neurol. Neurosurg. Psychiatry 73, 517–523 (2002).
3. O’Neill, J. et al. Quantitative 1H magnetic resonance spectroscopy and MRI of Parkinson’s disease. Mov. Disord. Off. J. Mov. Disord. Soc. 17, 917–927 (2002).
4. Burton E.J., McKeith I.G., Burn D.J., Williams E.D. & O'Brien J.T. Cerebral atrophy in Parkinson’s disease with and without dementia: a comparison with Alzheimer’s disease, dementia with Lewy bodies and controls. Brain J. Neurol. 127, (2004).
5. Krabbe, K. et al. Increased intracranial volume in Parkinson’s disease. J. Neurol. Sci. 239, 45–52 (2005).
6. Summerfield, C. et al. Structural Brain Changes in Parkinson Disease With Dementia: A Voxel-Based Morphometry Study. Arch. Neurol. 62, 281–285 (2005).
7. Geng, D.-Y., Li, Y.-X. & Zee, C.-S. Magnetic resonance imaging-based volumetric analysis of basal ganglia nuclei and substantia nigra in patients with Parkinson’s disease. Neurosurgery 58, 256–262; discussion 256-262 (2006).
8. Lee, S. H. et al. Regional volume analysis of the Parkinson disease brain in early disease stage: gray matter, white matter, striatum, and thalamus. AJNR Am. J. Neuroradiol. 32, 682–687 (2011).
9. Pitcher, T. L. et al. Reduced striatal volumes in Parkinson’s disease: a magnetic resonance imaging study. Transl. Neurodegener. 1,17 (2012).
10. Zarei, M. et al. Cortical thinning is associated with disease stages and dementia in Parkinson’s disease. J. Neurol. Neurosurg. Psychiatry 84, 875–881 (2013).
11. Rektorova, I. et al. Grey Matter Changes in Cognitively Impaired Parkinson’s Disease Patients. PLOS ONE 9, e85595 (2014).
12. Jia, X. et al. Longitudinal Study of Gray Matter Changes in Parkinson Disease. AJNR Am. J. Neuroradiol. 36, 2219–2226 (2015).
13. Mak, E. et al. Baseline and longitudinal grey matter changes in newly diagnosed Parkinson’s disease: ICICLE-PD study. Brain J. Neurol. 138, 2974–2986 (2015).
14. Lewis, C., Annett, L. E., Davenport, S., Hall, A. A. & Lovatt, P. Mood changes following social dance sessions in people with Parkinson’s disease. J. Health Psychol. 21, 483–492 (2016).
15. Li, X., Xing, Y., Schwarz, S. T. & Auer, D. P. Limbic grey matter changes in early Parkinson’s disease. Hum. Brain Mapp. 38, 3566–3578 (2017).
16. Cui, X. et al. Gray Matter Atrophy in Parkinson’s Disease and the Parkinsonian Variant of Multiple System Atrophy: A Combined ROI- and Voxel-Based Morphometric Study. Clinics 75, (2020).
17. Fang, E. et al. Differentiating Parkinson’s disease motor subtypes using automated volume-based morphometry incorporating white matter and deep gray nuclear lesion load. J. Magn. Reson. Imaging 51, 748–756 (2020).
18. Emerton, B. C. et al. A Comparison of Voxel-Based Morphometry and Volumetry Methods in the Context of the Neural Basis of Aggression. Brain Imaging Behav. 3, 332 (2009).
19. Voormolen, E. H. J. et al. Voxel-based morphometry and automated lobar volumetry: The trade-off between spatial scale and statistical correction. NeuroImage 49, 587–596 (2010).
20. Xia, J. et al. Changes of brain gray matter structure in Parkinson’s disease patients with dementia. Neural Regen. Res. 8, 1276 (2013).
21. Nakama, H. et al. Methamphetamine users show greater than normal age-related cortical gray matter loss. Addict. Abingdon Engl. 106, 1474–1483 (2011).
22. Deverdun, J. et al. Mean arterial pressure change associated with cerebral blood flow in healthy older adults. Neurobiol. Aging 46, 49–57 (2016).
23. Gerrits, N. J. H. M. et al. Cortical Thickness, Surface Area and Subcortical Volume Differentially Contribute to Cognitive Heterogeneity in Parkinson’s Disease. PLoS ONE 11, (2016).
24. Ritchie, S. J. et al. Risk and protective factors for structural brain ageing in the eighth decade of life. Brain Struct. Funct. 222, 3477–3490 (2017).
25. Albin, R. L., Young, A. B. & Penney, J. B. The functional anatomy of basal ganglia disorders. Trends Neurosci. 12, 366–375 (1989).
26. DeLong, M. R. & Wichmann, T. Circuits and Circuit Disorders of the Basal Ganglia. Arch. Neurol. 64, 20–24 (2007).
27. Rubin, J. E., McIntyre, C. C., Turner, R. S. & Wichmann, T. Basal ganglia activity patterns in parkinsonism and computational modeling of their downstream effects. Eur. J. Neurosci. 36, 2213–2228 (2012).
28. Marreiros, A. C., Cagnan, H., Moran, R. J., Friston, K. J. & Brown, P. Basal ganglia–cortical interactions in Parkinsonian patients. NeuroImage 66, 301–310 (2013).
29. Galvan, A., Devergnas, A. & Wichmann, T. Alterations in neuronal activity in basal ganglia-thalamocortical circuits in the parkinsonian state. Front. Neuroanat. 9, (2015).
30. Caligiore, D. et al. Parkinson’s disease as a system-level disorder. Npj Park. Dis. 2, 1–9 (2016).
31. McGregor, M. M. & Nelson, A. B. Circuit Mechanisms of Parkinson’s Disease. Neuron 101, 1042–1056 (2019).
32. Testa, C. et al. A comparison between the accuracy of voxel-based morphometry and hippocampal volumetry in Alzheimer’s disease. J. Magn. Reson. Imaging 19, 274–282 (2004).
33. Giuliani, N. R., Calhoun, V. D., Pearlson, G. D., Francis, A. & Buchanan, R. W. Voxel-based morphometry versus region of interest: a comparison of two methods for analyzing gray matter differences in schizophrenia. Schizophr. Res. 74, 135–147 (2005).
34. Juh, R., Su, M., Lee, C., Suh, T. & Nalcioglu, O. SU-FF-I-100: Investigate Between the Voxel Based Morphometry and Region of Interest Study in Alzheimer’s Disease. Med. Phys. 33, 2020–2020 (2006).
Figures
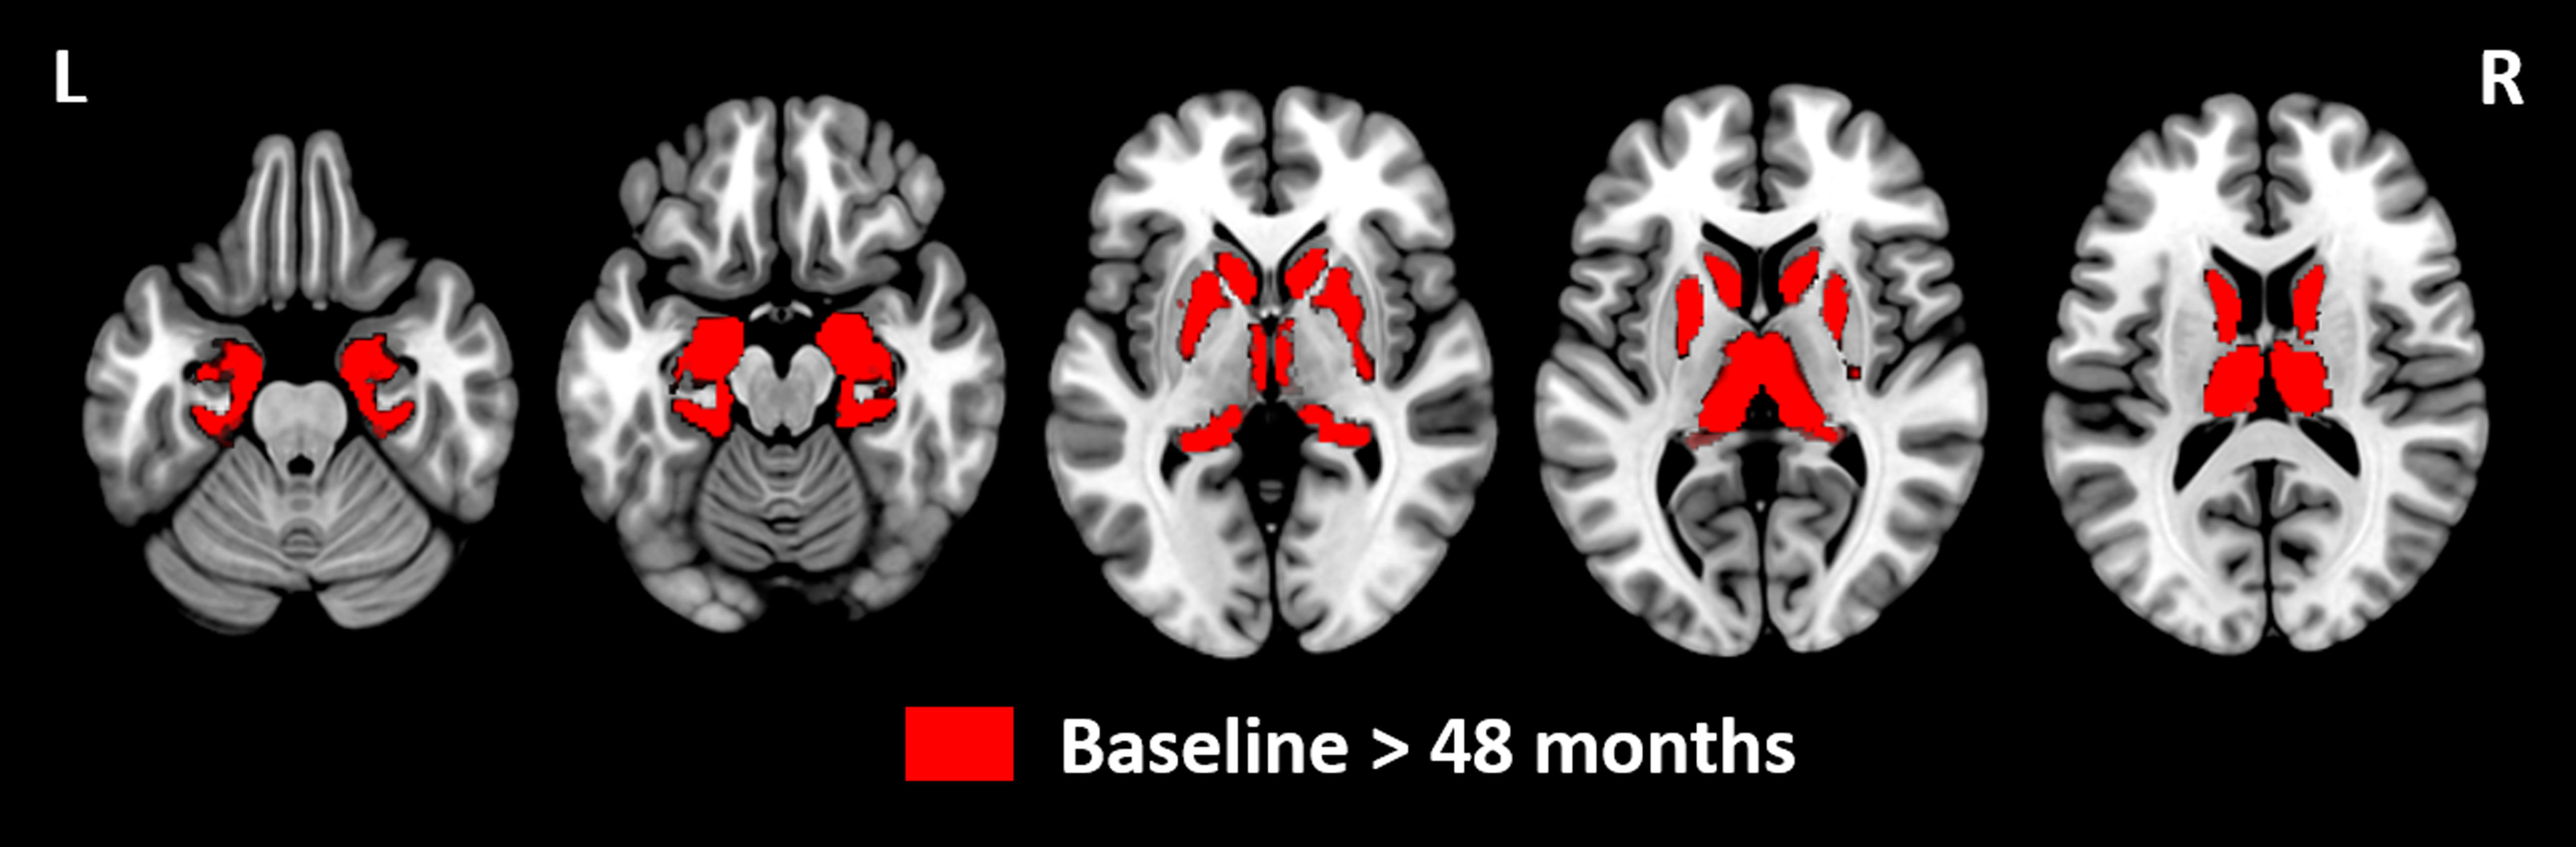
Figure 1: Statistical parametric maps showing differences between baseline and 48 months of follow-up using voxel-based morphometry analyses.
Grey matter volume was decreased in all subcortical regions (nucleus accumbens, amygdala, caudate, hippocampus, pallidum, putamen and thalamus) at 48 months relative to baseline (p<0.05 TFCE, FWE corrected, age, sex and total intracranial volume adjusted). No significant differences were identified at baseline relative to 48 months.
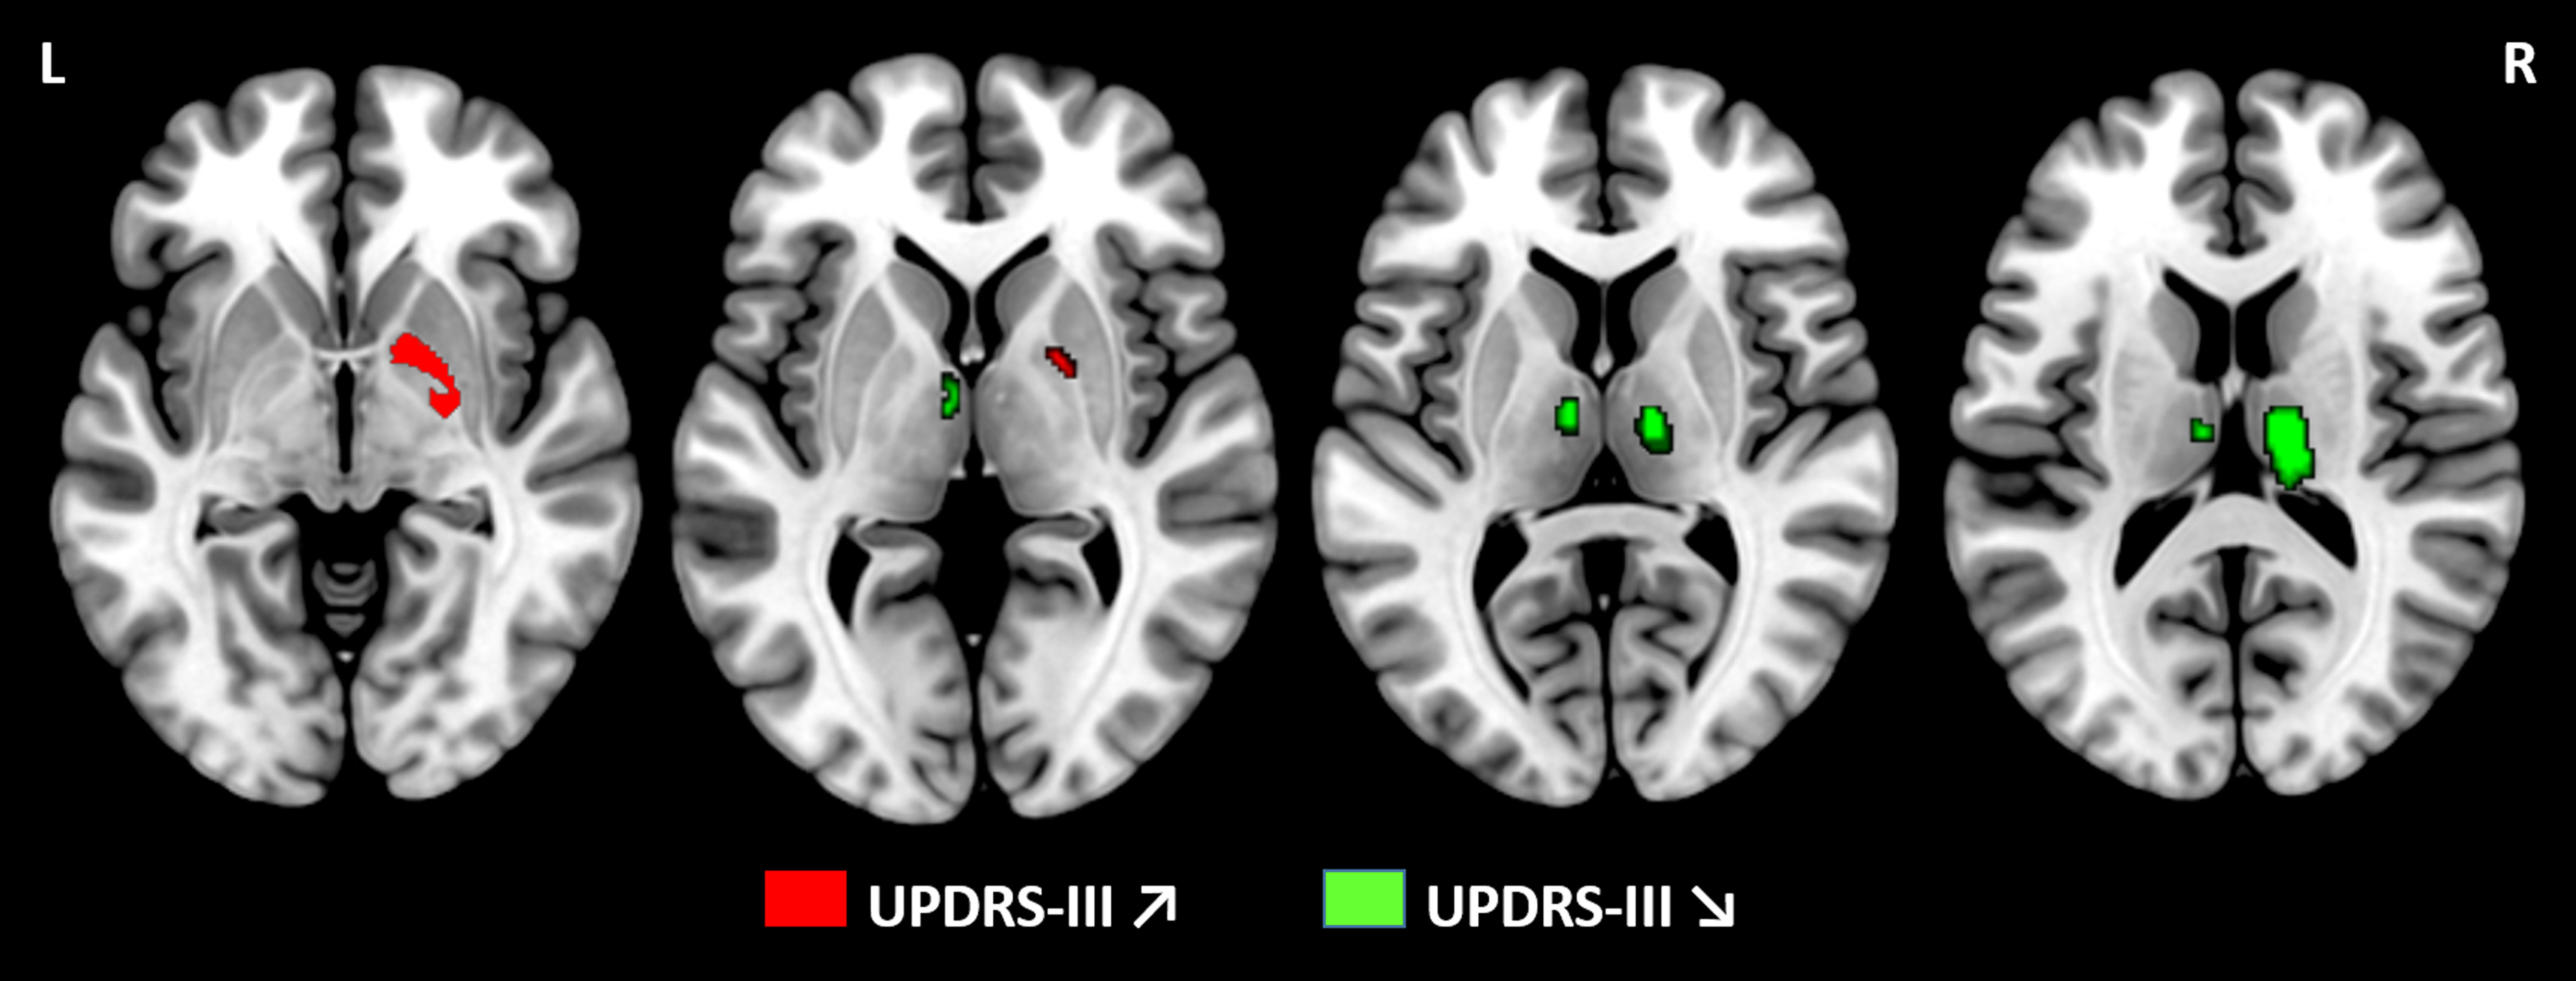
Figure 2: Statistical parametric maps showing positive and negative correlation between grey matter volume and UPDRS-III scores at 48 months using voxel-based morphometry analyses.
Results showed a positive association between grey matter volume and UPDRS-III in right pallidum at 48 months (p<0.05 TFCE, FWE corrected, age, sex and total intracranial volume adjusted). Conversely, a negative association was identified in bilateral thalamus at 48 months. No findings were significant at baseline.
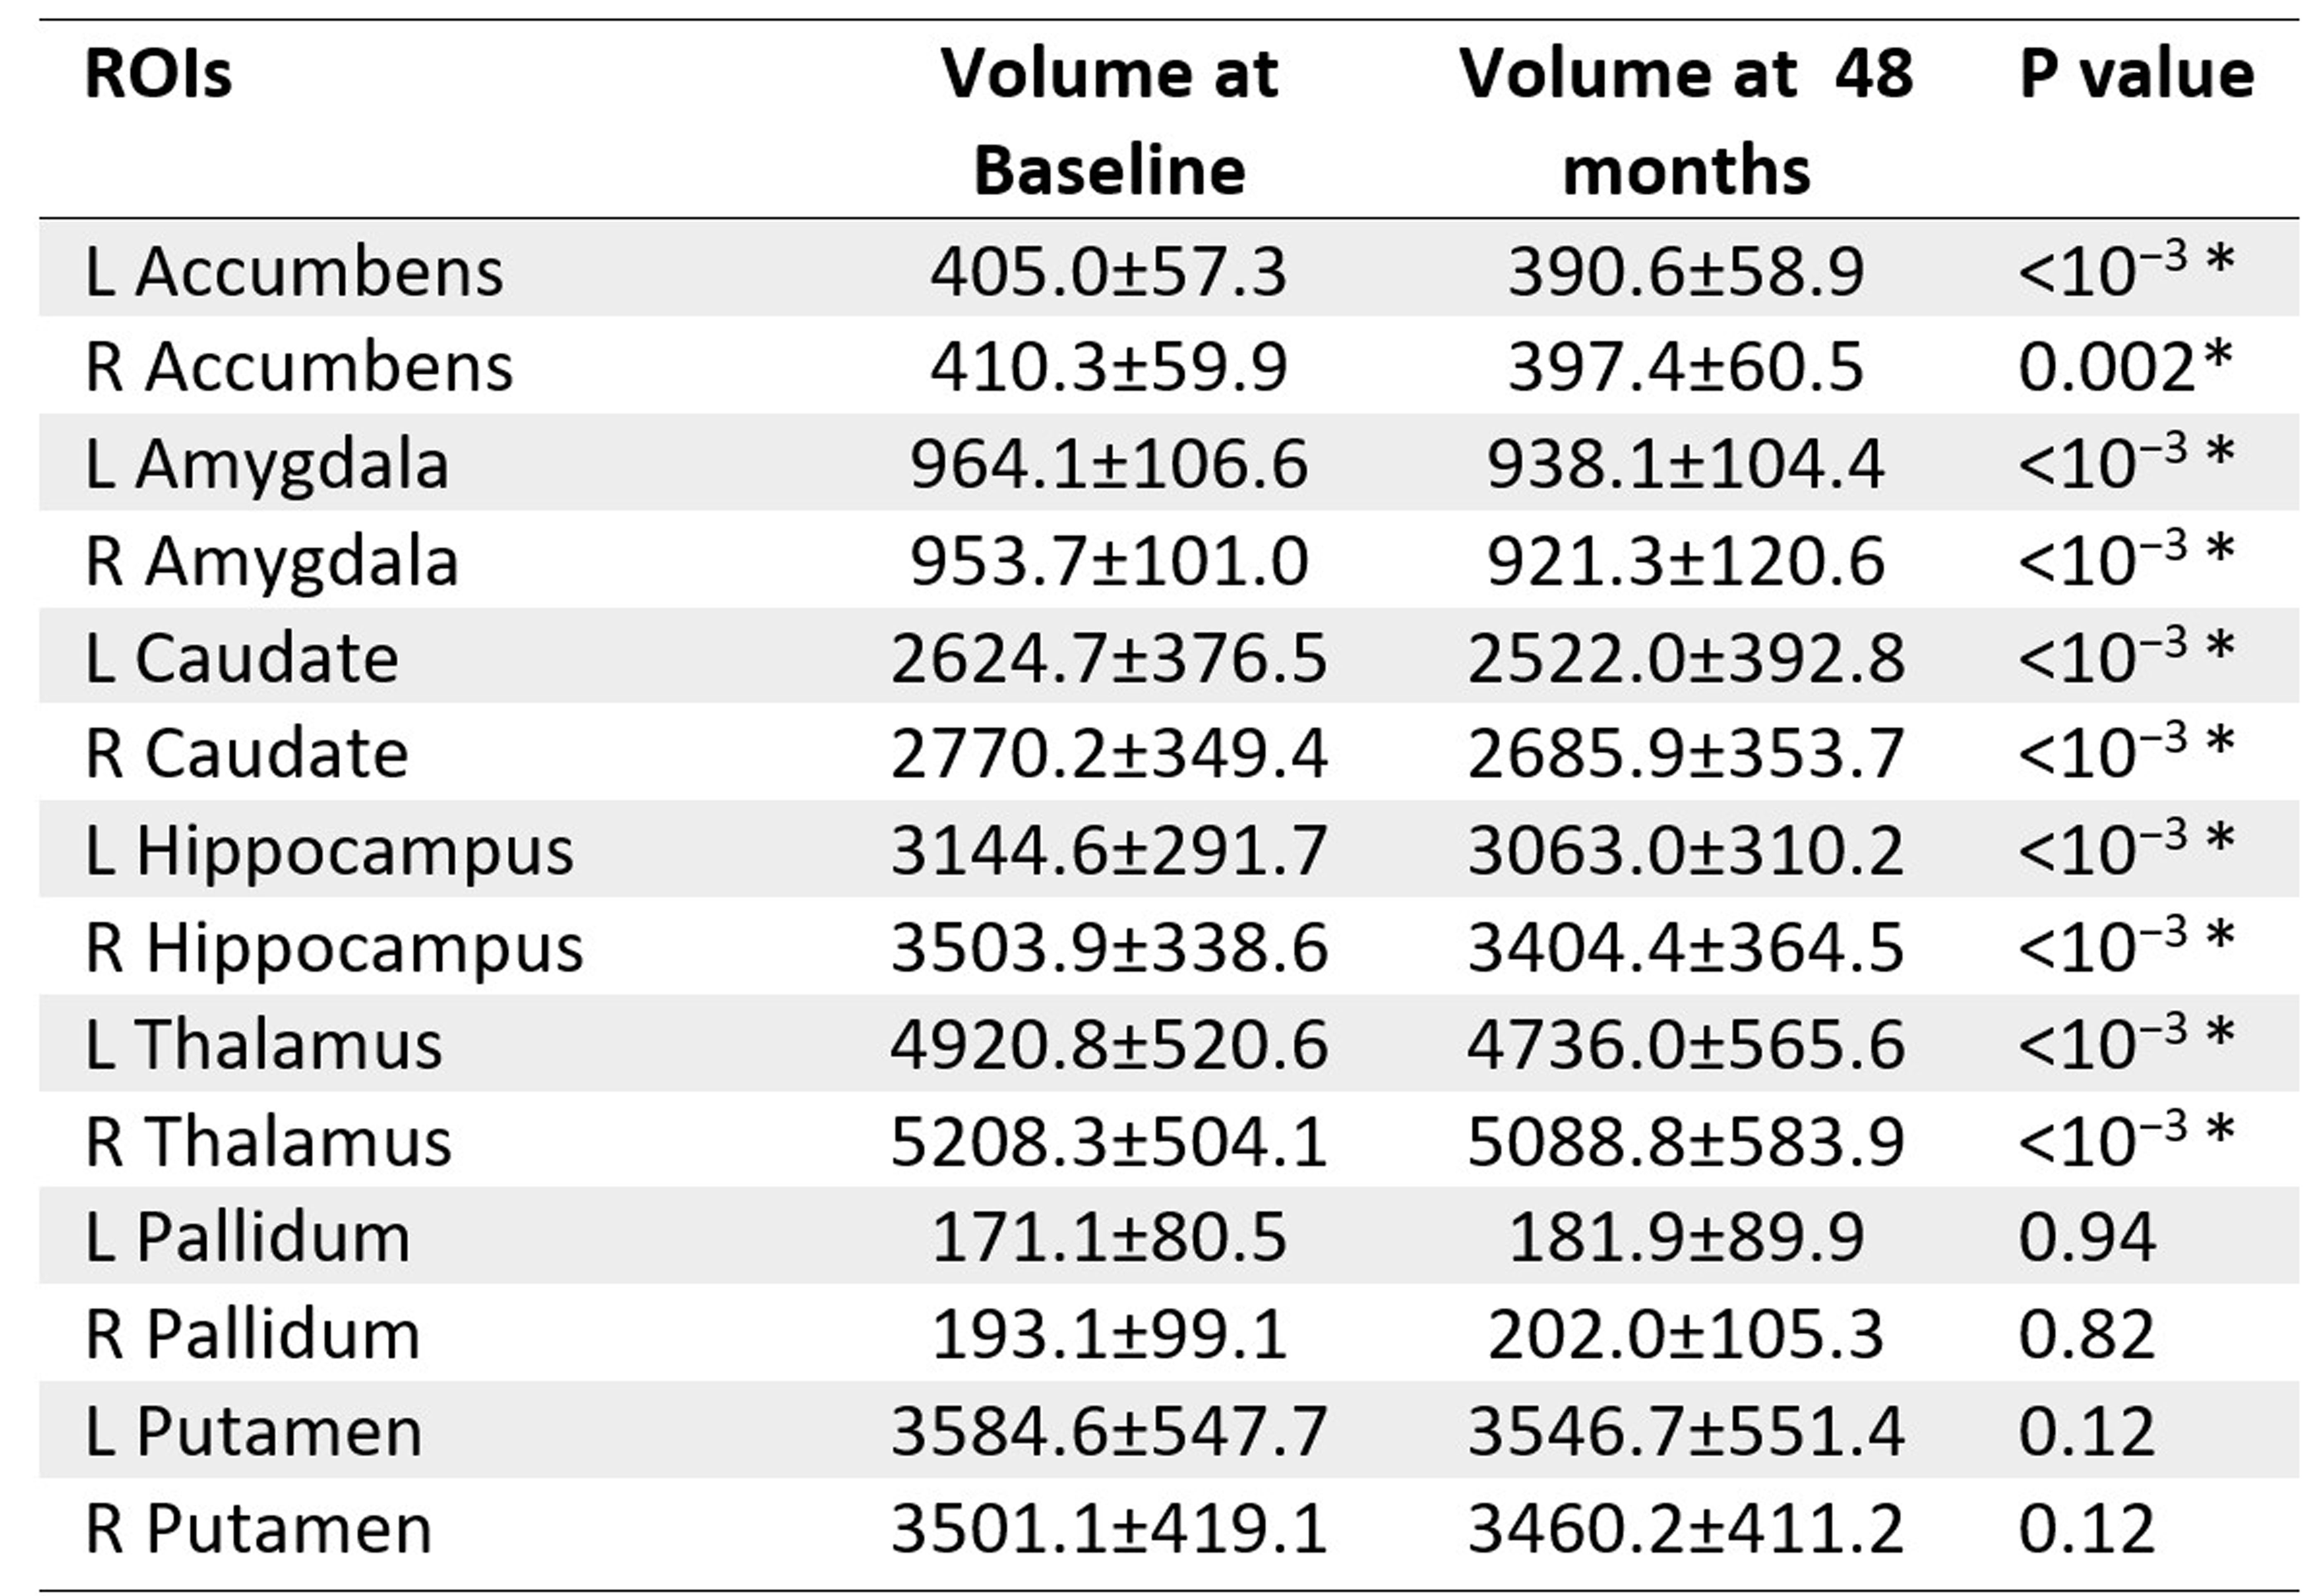
Figure 3: Subcortical grey matter regions showing differences between baseline and 48 months using volume assessment analyses.
The comparison between baseline and 48 months was assessed using a paired-t-test, Bonferonni corrected. The asterisk indicates significant differences at p<0.05. Abbreviations: L = Left, R = Right, ROI = Region of Interest.
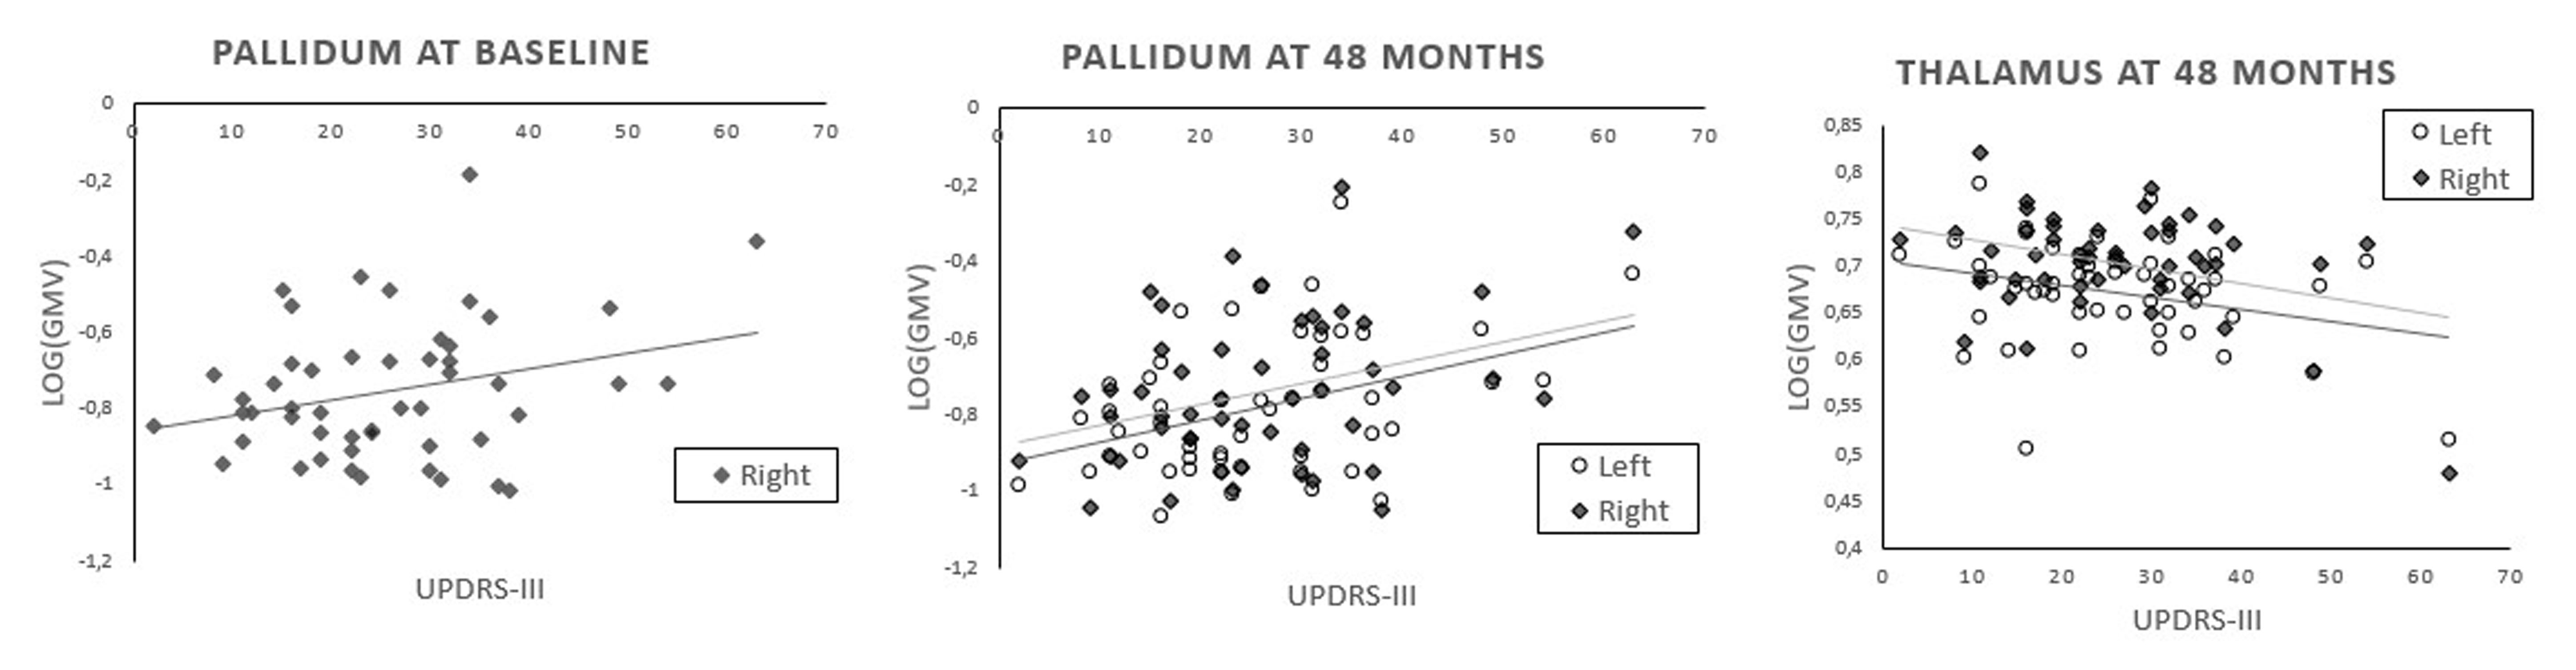
Figure 4: Correlation between grey matter volume and UPDRS-III scores at baseline and 48 months.
At baseline, one positive correlation was identified between grey matter volume and UPDRS-III scores in the right pallidum. At 48 months, a positive correlation was observed between grey matter volume and UPDRS-III scores in bilateral pallidum whereas a negative correlation was identified in bilateral thalamus. Pearson correlations are reported with a statistical threshold of p<0.05.
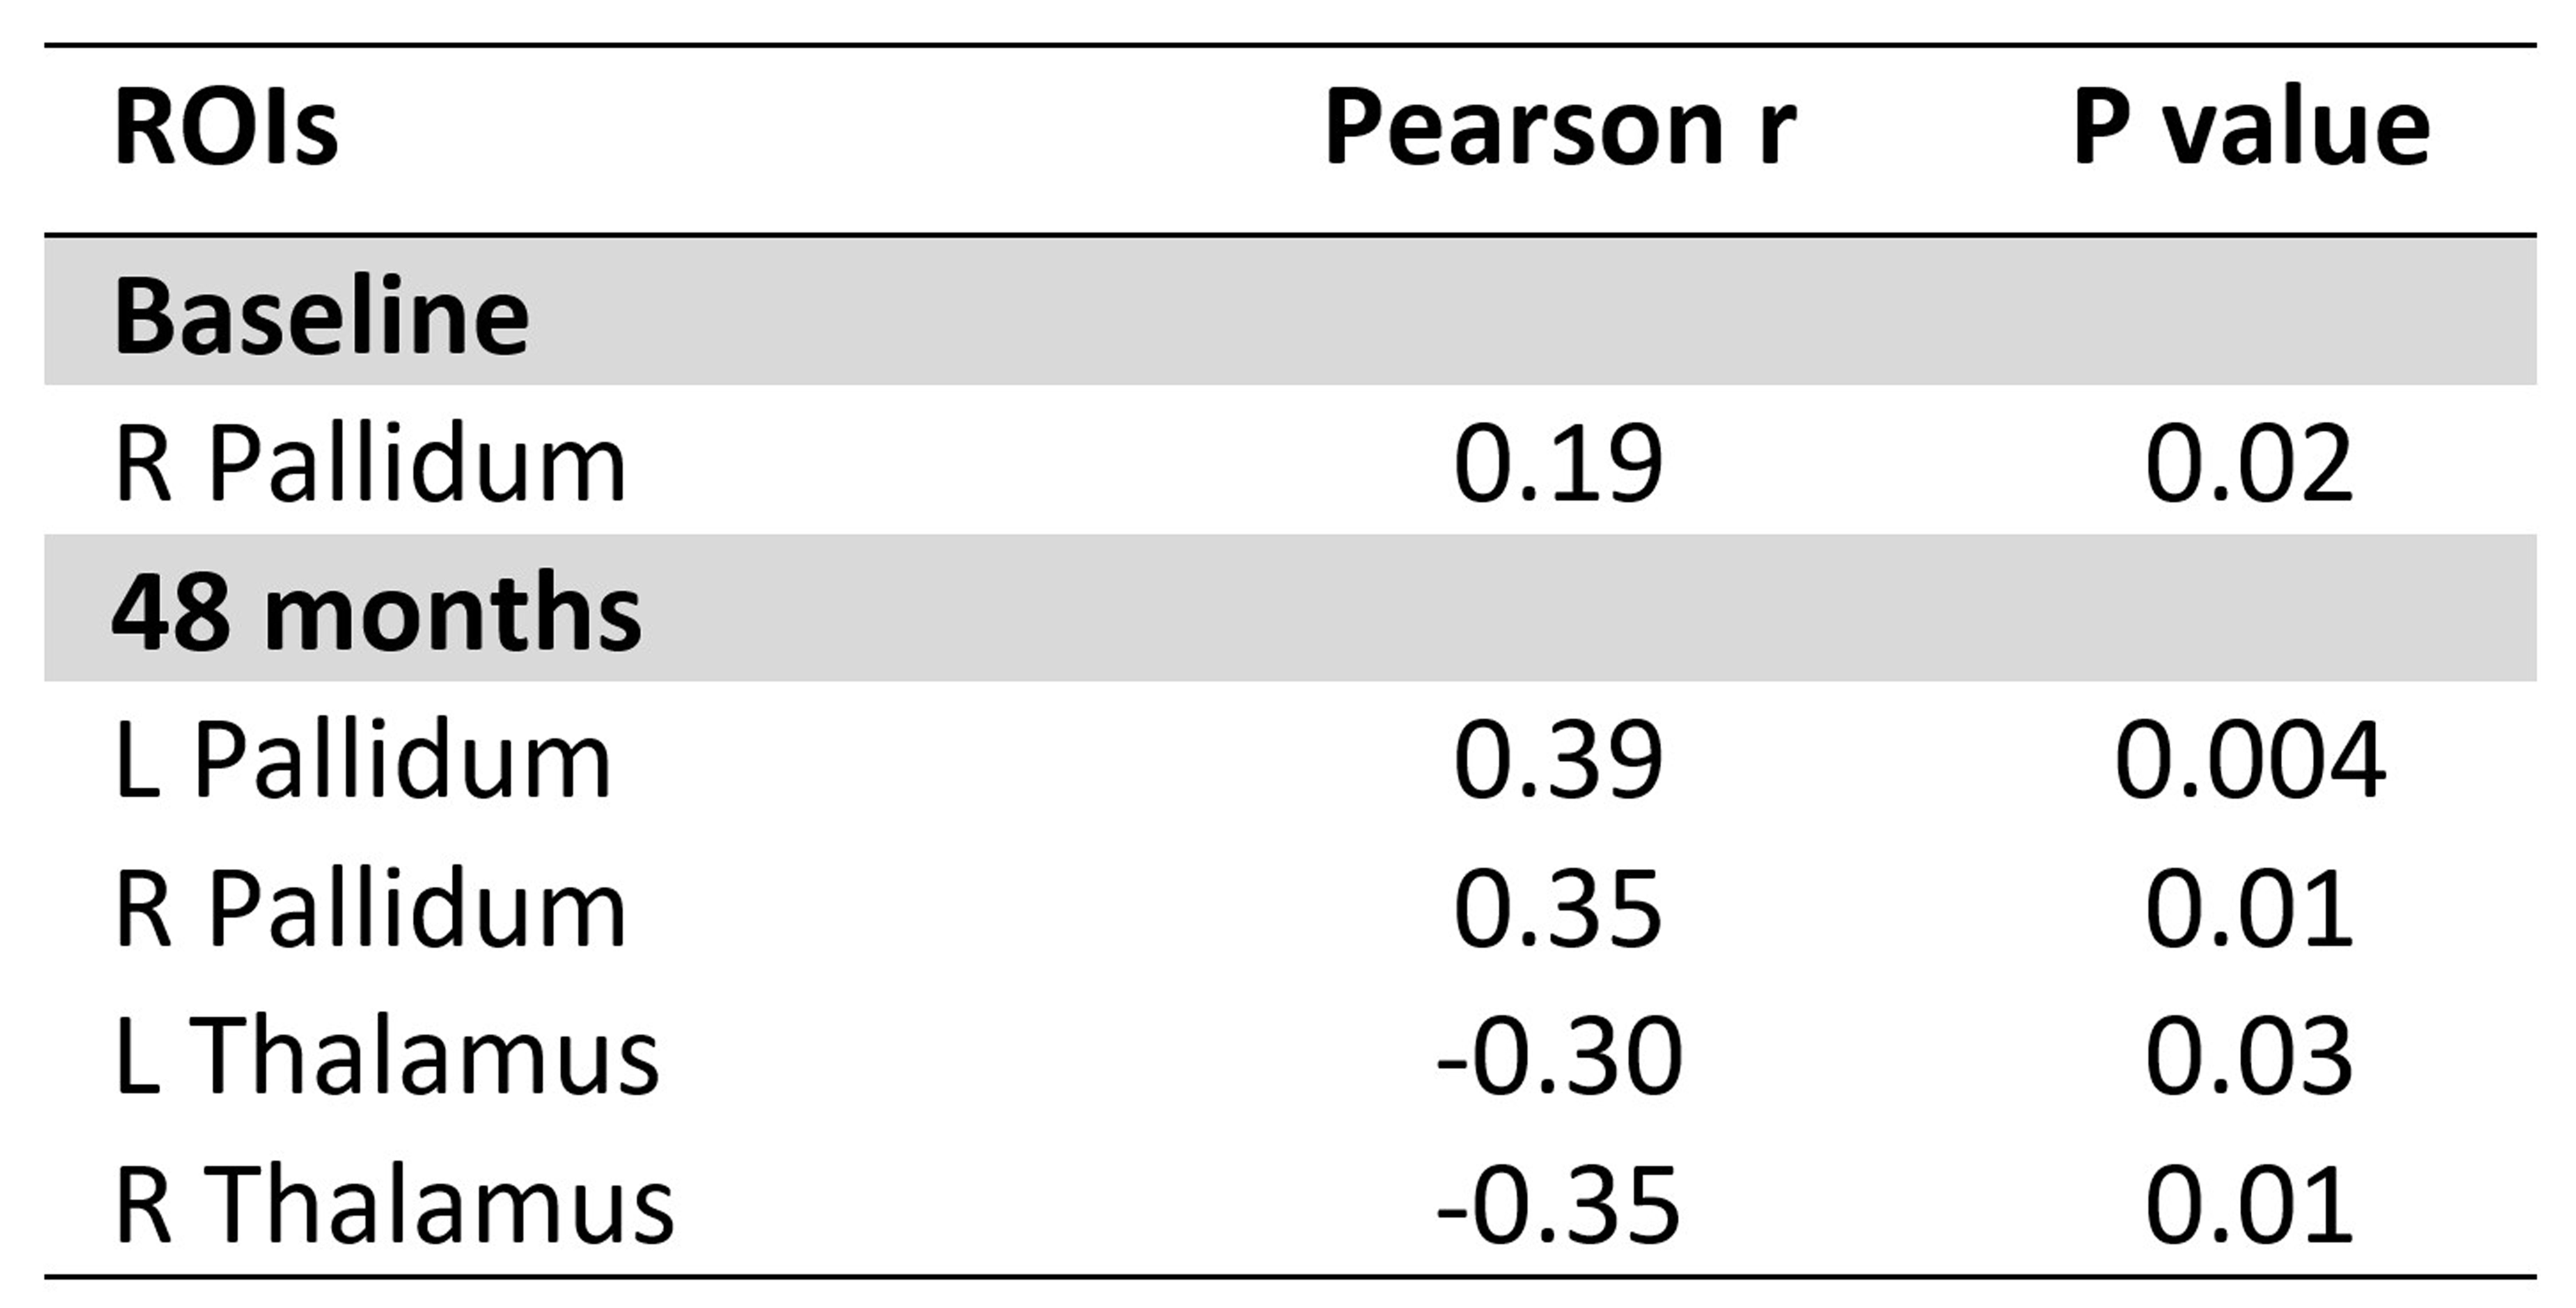
Figure 5: Subcortical grey matter regions showing correlation between grey matter volume and UPDRS-III scores at baseline and 48 months separately using volume assessment analyses.
Pearson correlations (r) are reported with a statistical threshold of p<0.05. Abbreviations: L = Left, R = Right, ROI = Region Of Interest.