3024
Swallow tail sign and nigrosome 1 - close but not quite the same1Max Planck Institute for Human Cognitive and Brain Sciences, Leipzig, Germany, 2Faculty of Physics and Earth Sciences, Leipzig University, Leipzig, Germany, 3Center for Cognitive Neuroscience Berlin, Freie Universität Berlin, Berlin, Germany, 4Integrative Model-based Cognitive Neuroscience Research Unit, University of Amsterdam, Amsterdam, Netherlands, 5Paul Flechsig Institute of Brain Research, University of Leipzig, Leipzig, Germany, 6Department of Anatomy and Embryology, Maastricht University, Maastricht, Netherlands, 7Sir Peter Mansfield Imaging Center, University of Nottingham, Nottingham, United Kingdom
Synopsis
MRI holds great promise for diagnosing Parkinson's disease, based on the disappearance of the swallow tail sign in T2*-weighted images, which past research assumed to be nigrosome 1. We studied the sign's anatomical underpinning, combining ultra-high field MRI in vivo and postmortem, 3D-reconstructed microscopy, and immunohistochemistry. Based on block-face images and calbindin-D28K immunohistochemistry, we constructed a 3D nigrosome atlas. We show that nigrosome 1 extends beyond the swallow tail sign by co-registering this atlas to in vivo MRI. As the swallow tail sign only partially overlaps with but is not identical to nigrosome 1, its interpretation needs to be revised.
Introduction
MRI has great potential for diagnosing Parkinson's disease (PD).1 A very promising imaging biomarker is the swallow tail sign (ST), a bright stripe within a larger dark structure in the substantia nigra (SN) on T2*-weighted images (T2*w, Fig. 1C).2,3The anatomical underpinnings of the ST are not clear. An early influential study suggested that the bright ST corresponds to nigrosome 1 (N1),4 by combining postmortem MRI and 2D immunohistochemistry.5 This assignment renders the ST a highly interesting biomarker for PD as the extensive loss of dopaminergic neurons (DN) in N1 is a central hallmark of the disease.6 This interpretation of ST has entered clinical literature.7 Several recent studies on postmortem tissue seemingly contradict this interpretation, reporting dark clusters of DN in N1 on T2*w images.8,9 Moreover, it remains unclear if the ST is directly caused by DN clusters in N1 or reflects different anatomical structures that partly overlap with N1. Answering these questions is complicated by the fine-grained anatomy of SN,4 its intersubject variability,10 and postmortem changes in MRI contrast.11
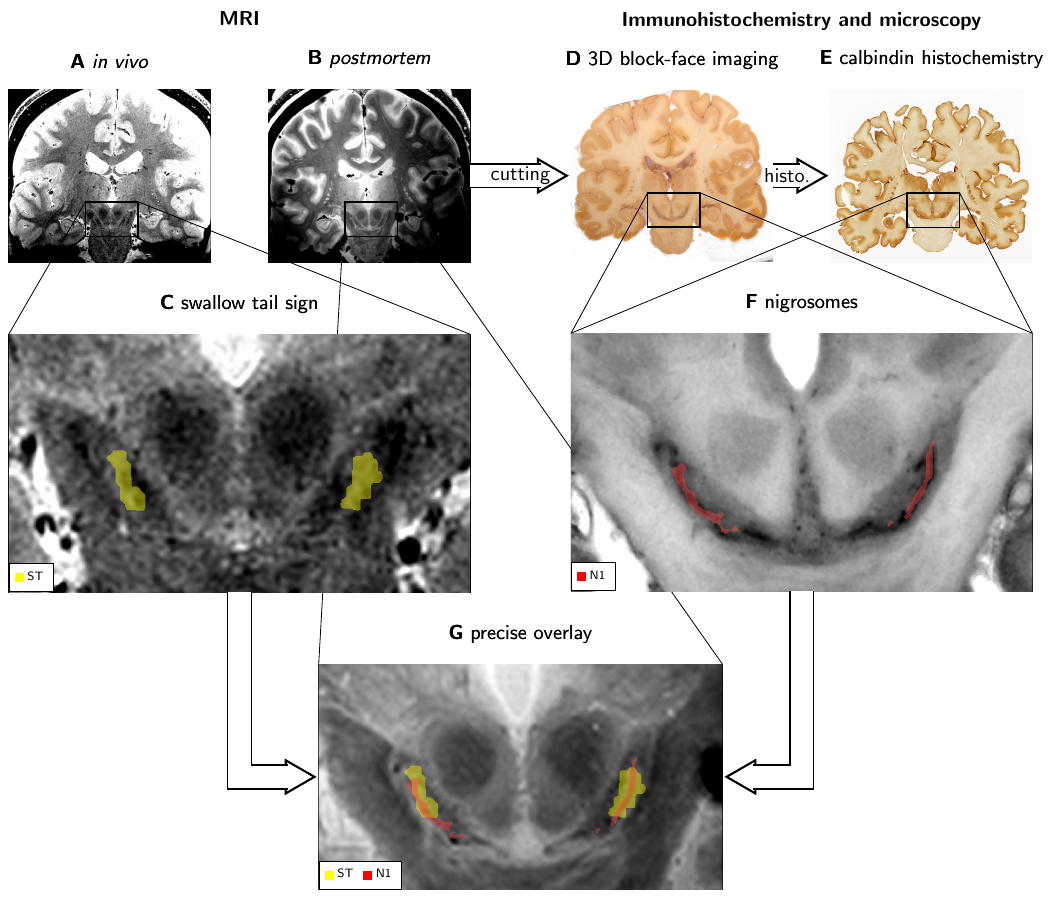
Here, we studied the anatomical relation between ST and N1. We addressed the described challenges by comparing ultra-high field MRI in vivo and postmortem with 3D-reconstructed block-face imaging and immunohistochemistry as a gold standard. Registration between immunohistochemistry, in vivo, and postmortem MRI showed that N1 is thinner, but extends beyond the ST, potentially reflecting a different anatomical structure.
Methods
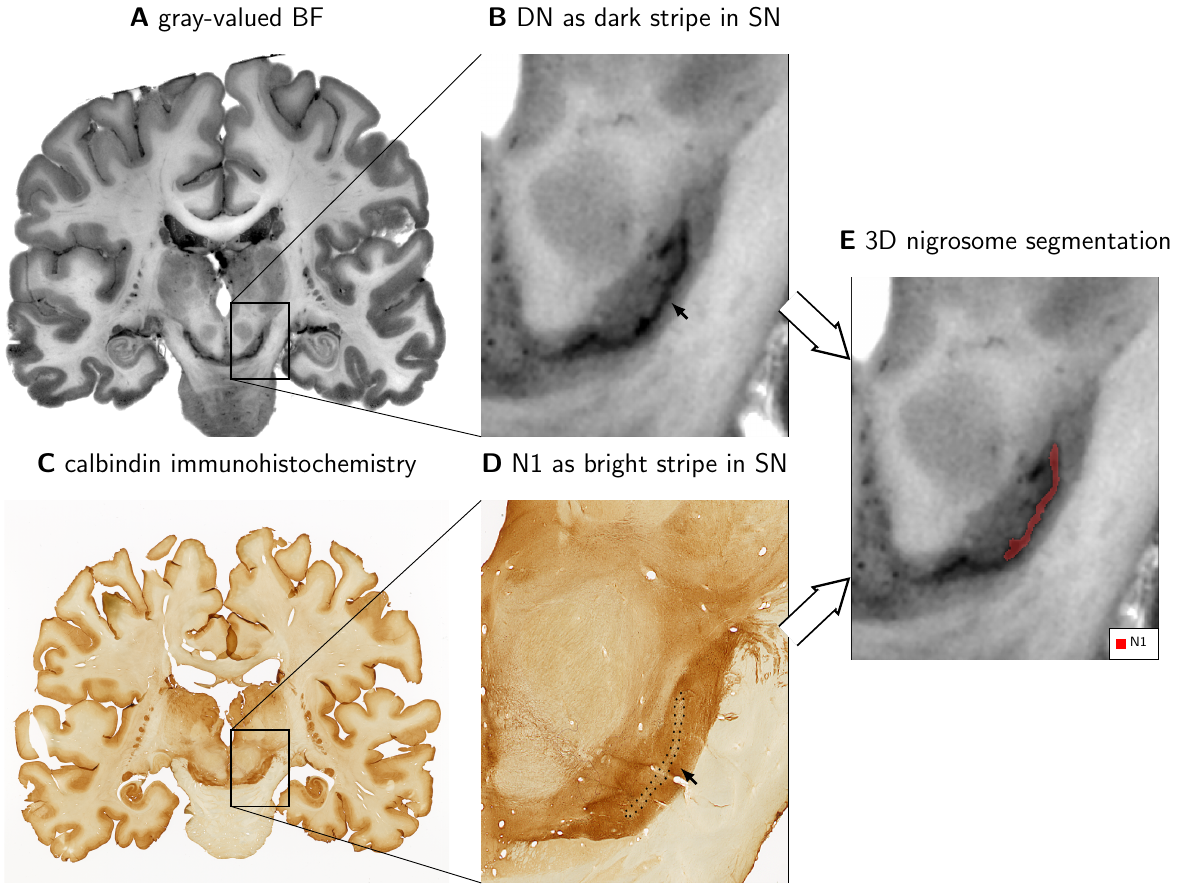
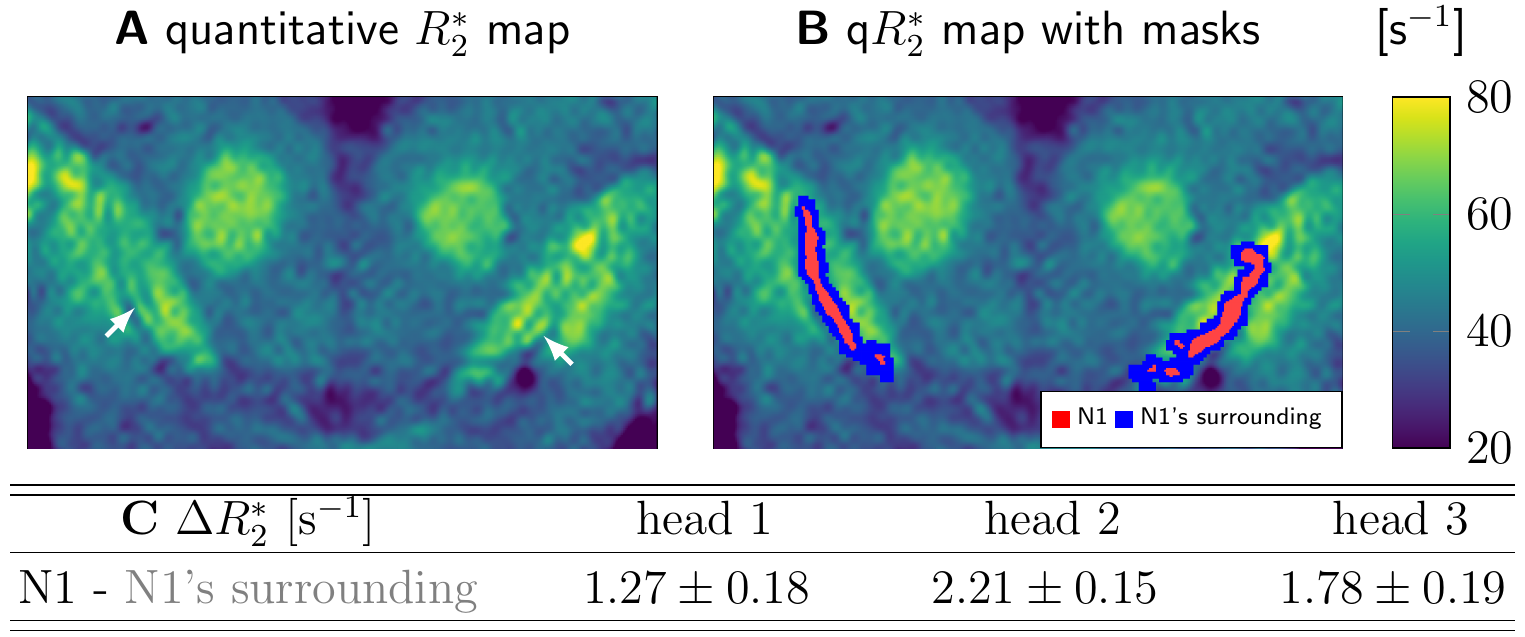
In vivo T2*w images were acquired on three participants at 7 T (Magnetom 7 T, Siemens Healthineers, Erlangen) as a part of a multiparametric mapping acquisition12 using prospective motion correction13 (0.4mm isotropic resolution; flip angle 5°; echo times TE1-8=3.3,5.9,...,21.5ms; repetition time TR=31.6ms). Postmortem T2*w images were acquired on three whole heads using a similar protocol14 (0.4mm isotropic resolution; flip angle 7°; TE1-8=3.44,6.04,...,21.6ms; TR=31.8ms). Combined T2*w images were calculated as a root-sum-of-squares over the TEs (Figs. 1A, B, C, G; 3). Quantitative R2* maps were calculated from the signal’s logarithm using an ordinary-least-squares algorithm (Fig. 5). ST was segmented on in vivo T2*w images as a bright area in SN within a larger dark area (Fig 1C, 3B).53D block-face images (BF) were acquired on three postmortem brains14 with a resolution of 150x150x200µm3 (Fig. 1D). Areas with a high density of neuromelanin-pigmented DN and the morphology of the nigrosomes4 were segmented on BF (Fig. 1F). We defined these DN-rich regions as the nigrosomes and confirmed that they show low calbindin immunoreactivity on one specimen (Fig. 2). Note that our N1 may be smaller than N1 in classical studies, which defined nigrosomes based on tyrosine hydroxylase and calbindin immunohistochemistry. A mask of the region directly surrounding N1, with a similar volume as the N1 mask, was created by dilating the N1 mask with a (0.3mm)3 cubic kernel (Fig. 5B).
In vivo and postmortem T2*w MRI data and BF were affinely registered based on anatomical landmarks, including small vessels, outside of SN.
Results
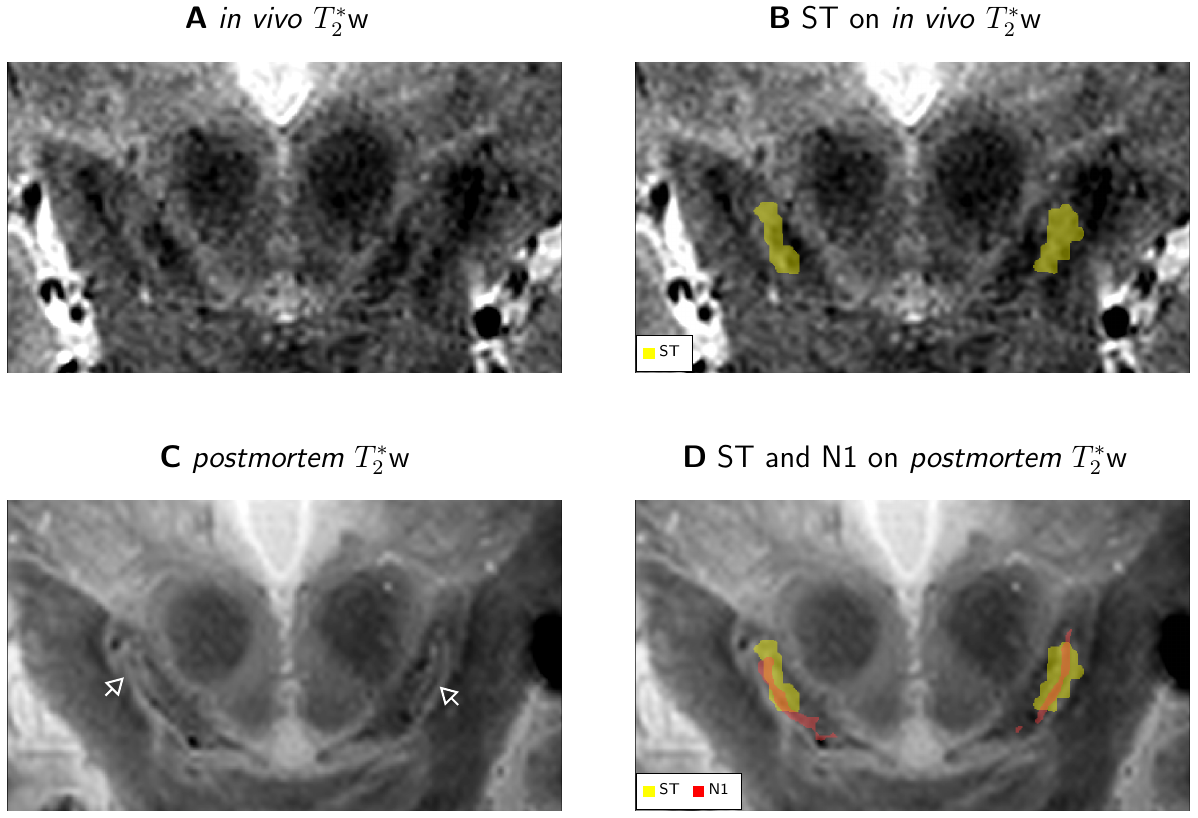
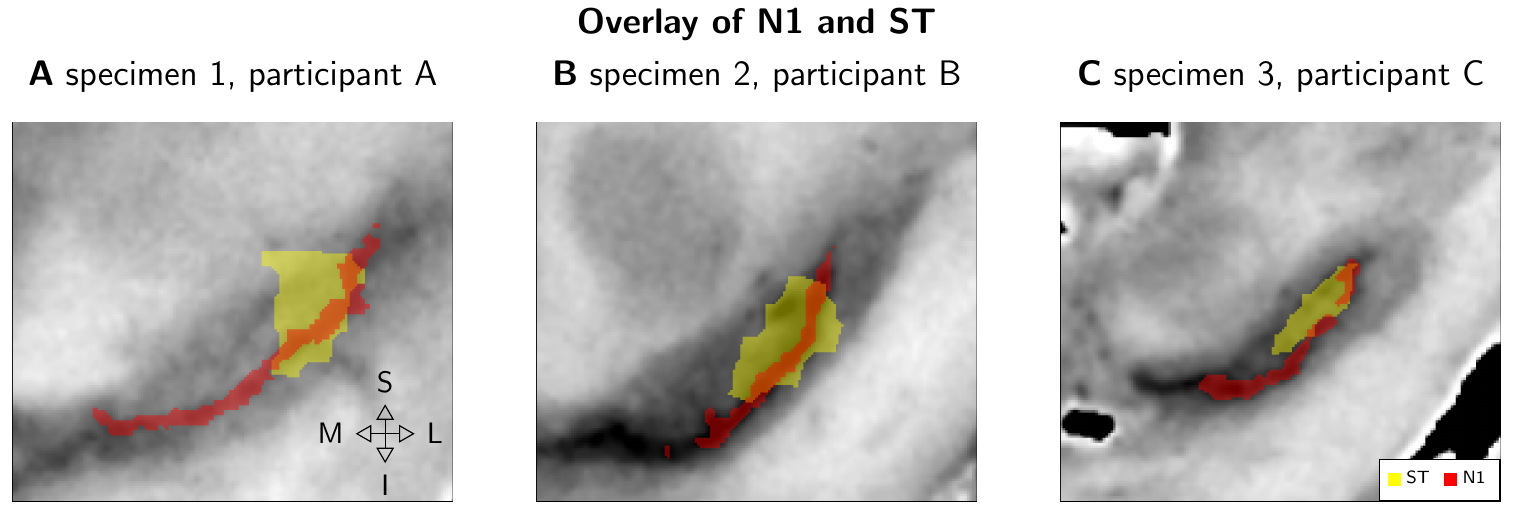
N1 appeared as a flat structure, which on coronal sections was visible as an elongated stripe with a thickness of 0.5 to 1mm (Fig. 1F, 2).ST was visible on in vivo T2*w images of all participants and consistently partly overlapped with N1 after registration of in vivo and postmortem MRI (Fig. 3). In all studied cases, the geometry of ST and N1 differed prominently: The ST was approximately twice as wide as N1. N1 extended beyond the ST both in anterior-posterior and superior-inferior direction (Fig. 4). In view of the identification of N1 and ST, our altered histological procedure may result in a thinner appearance of N1 in histology but cannot explain its larger extent.
On postmortem T2*w images, the SN showed more complex contrast patterns than in vivo, without clear ST (Figs. 3A vs 3C). Postmortem, a dark stripe was visible within a larger bright area in the posterior SN, corresponding to N1’s location (Fig.3C, D). R2* was significantly increased within N1 in all specimens (p<0.005; Fig. 5C).
Discussion and Conclusion
We demonstrated that the ST and the DN-rich area in N1 are spatially partly overlapping but not identical. Therefore, ST and N1 likely correspond to distinct anatomical structures and should not be used as synonyms in research or clinics. The interpretation of the ST sign needs to be revised to improve its value for diagnostics and disease monitoring.The increased R2* rate of N1 is in line with several previous postmortem studies.8,9 However, it is not clear why this dark stripe has not appeared in in vivo MRI. Causes may include insufficient SNR, motion, pulsation, or a fundamental change of contrast mechanisms in N1 between in vivo and postmortem.11
Our 3D nigrosome atlas will help to interpret in vivo MRI and support the search for PD biomarkers.15,16 We propose the need for further studies of SN’s detailed anatomy and its changes in PD.
Acknowledgements
We acknowledge the whole-body donation program at the University of Maastricht for providing postmortem brain samples.14
The research leading to these results has received funding from the European Research Council under the European Union's Seventh Framework Program (FP7/2007-2013) / ERC grant agreement n° 616905. This project has received funding from the European Union's Horizon 2020 research and innovation programme under the grant agreement No 681094, and is supported by the Swiss State Secretariat for Education, Research and Innovation (SERI) under contract number 15.0137. This project has also received funding from the BMBF (01EW1711A & B) in the framework of ERA-NET NEURON. This research was financially supported by STW/NWO, NWO VICI, the European Research Council (no. 616905), Brain Foundation of the Netherlands, and Stichting Internationaal Parkinson Fonds. The research leading to parts of these results has received funding from the DFG, PP 2041 Computational Connectomics (MO 2249/3-1 and MO 2249/3-2 ) and the Alzheimer Forschung Initiative (AFI#18072) to M.M.
M. Brammerloh has received funding from the International Max Planck Research School on Neuroscience of Communication: Function, Structure, and Plasticity.
References
1. Kalia LV, Lang AE. Parkinson’s disease. The Lancet. 2015;386(9996):896-912. doi:10.1016/S0140-6736(14)61393-3
2. Cosottini M, Frosini D, Pesaresi I, et al. MR imaging of the substantia nigra at 7 T enables diagnosis of Parkinson disease. Radiology. 2014;271(3):831-838. doi:10.1148/radiol.14131448
3. Lehéricy S, Bardinet E, Poupon C, Vidailhet M, François C. 7 tesla magnetic resonance imaging: A closer look at substantia nigra anatomy in Parkinson’s disease. Mov Disord. 2014;29(13):1574-1581. doi:10.1002/mds.26043
4. Damier P, Hirsch EC, Agid Y, Graybiel AM. The substantia nigra of the human brain. I. Nigrosomes and the nigral matrix, a compartmental organization based on calbindin D(28K) immunohistochemistry. Brain. 1999;122(8):1421-1436. doi:10.1093/brain/122.8.1421
5. Blazejewska AI, Schwarz ST, Pitiot A, et al. Visualization of nigrosome 1 and its loss in PD Pathoanatomical correlation and in vivo 7 T MRI. Neurology. 2013;81(6):534-540. doi:10.1212/WNL.0b013e31829e6fd2
6. Damier P, Hirsch EC, Agid Y, Graybiel AM. The substantia nigra of the human brain. II. Patterns of loss of dopamine-containing neurons in Parkinson’s disease. Brain J Neurol. 1999;122(8):1437-1448.
7. Barkhof F, Jäger HR, Thurnher MM, Rovira À, eds. Clinical Neuroradiology: The ESNR Textbook. Springer International Publishing; 2019. doi:10.1007/978-3-319-68536-6
8. Lee H, Baek S-Y, Chun SY, Lee J-H, Cho H. Specific visualization of neuromelanin-iron complex and ferric iron in the human post-mortem substantia nigra using MR relaxometry at 7T. NeuroImage. 2018;172:874-885. doi:10.1016/j.neuroimage.2017.11.035
9. Brammerloh M, Weigelt I, Arendt T, et al. A Biophysical Model of Iron-Induced Relaxation in Human Substantia Nigra for Early Stage Parkinson Diagnostic. Proc Int Soc Magn Reson Med. 2019;27(1912). https://cds.ismrm.org/protected/18MPresentations/abstracts/0188.html
10. Cheng Z, He N, Huang P, et al. Imaging the Nigrosome 1 in the substantia nigra using susceptibility weighted imaging and quantitative susceptibility mapping: An application to Parkinson’s disease. NeuroImage Clin. 2019;25. doi:10.1016/j.nicl.2019.102103
11. Evgeniya Kirilina, Charlotte Lange, Carsten Jäger, et al. Iron-Induced MR Contrast in Human Locus Coeruleus: A Cautionary Tale of Misleading Post Mortem MRI Results. Proc Int Soc Magn Reson Med. 2019;27(1211). https://cds.ismrm.org/protected/19MPresentations/abstracts/1211.html
12. Weiskopf N, Suckling J, Williams G, et al. Quantitative multi-parameter mapping of R1, PD*, MT, and R2* at 3T: a multi-center validation. Front Neurosci. 2013;7:95. doi:10.3389/fnins.2013.00095
13. Kirilina E, Helbling S, Morawski M, et al. Superficial white matter imaging: Contrast mechanisms and whole-brain in vivo mapping. Sci Adv. 2020;6(41):eaaz9281. doi:10.1126/sciadv.aaz9281
14. Alkemade A, Pine K, Kirilina E, et al. 7 Tesla MRI Followed by Histological 3D Reconstructions in Whole-Brain Specimens. Front Neuroanat. 2020;14. doi:10.3389/fnana.2020.536838
15. Schwarz ST, Mougin O, Xing Y, et al. Parkinson’s disease related signal change in the nigrosomes 1–5 and the substantia nigra using T2* weighted 7T MRI. NeuroImage Clin. 2018;19:683-689. doi:10.1016/j.nicl.2018.05.027
16. Nigrosomal Iron Imaging in Parkinson’s Disease - Full Text View - ClinicalTrials.gov. Accessed December 4, 2020. https://clinicaltrials.gov/ct2/show/NCT03022357
Figures