3023
Feasibility of a short but comprehensive MRI protocol for quantitative characterization of progressive neurodegeneration in Friedreich ataxia
Koene R.A. Van Dijk1, Courtney A. Bishop2, James O’Callaghan2, James A. Goodman1, Laigao Chen1, Peter T. Loudon3, Lawrence Charnas4, Eugenii A. Rabiner2, and Richard Festenstein5
1Digital Medicine and Translational Imaging, Early Clinical Development, Pfizer, Cambridge, MA, United States, 2Invicro, London, United Kingdom, 3Clinical Sciences, Early Clinical Development, Pfizer, Cambridge, United Kingdom, 4Rare Disease Research Unit, Pfizer, Cambridge, MA, United States, 5Department of Brain Sciences, Imperial Clinical Research Facility and BRC (NIHR), Imperial College London, London, United Kingdom
1Digital Medicine and Translational Imaging, Early Clinical Development, Pfizer, Cambridge, MA, United States, 2Invicro, London, United Kingdom, 3Clinical Sciences, Early Clinical Development, Pfizer, Cambridge, United Kingdom, 4Rare Disease Research Unit, Pfizer, Cambridge, MA, United States, 5Department of Brain Sciences, Imperial Clinical Research Facility and BRC (NIHR), Imperial College London, London, United Kingdom
Synopsis
We report on feasibility of a short but comprehensive 3T brain MRI protocol in Friedreich ataxia. The multi-parametric protocol includes measures of anatomy, iron content, several indices of white matter, and brain metabolites. The scan session, lasting less than 60 minutes, was tolerated well by all 8 patients who had varying degrees of ataxia symptomatology, and provided good quality imaging data for the majority of sequences and patients. This protocol allows non-invasive quantitative characterization of progressive neurodegeneration in cerebral and cerebellar structures in patients with Friedreich ataxia suggesting the potential for rich, longitudinal phenotyping in this population.
INTRODUCTION
Friedreich ataxia (FA) is a rare autosomal recessive disorder with a prevalence of approximately 3-4 cases per 100,000 people1. It is caused by partial deficiency of the mitochondrial protein frataxin due to mutations in the frataxin gene and there is currently no cure for FA leading to premature mortality2. With treatments currently in development, non-invasive imaging biomarkers are expected to play a role in estimation of disease progression and measuring the effects of novel interventions. Over the past decades multiple publications describing one or two MR-based brain imaging acquired at 1.5 or 3T have shown differences between FA patients and controls, associations with disease severity and disease duration, and relationships with genetic markers3. We have recently shown promising results of a translational molecular imaging biomarker in a genetic mouse model of FA4 and are continuing this work in human. We designed an MRI protocol for non-invasive quantitative characterization of progressive neurodegeneration in cerebral and cerebellar cortical and sub-cortical structures in patients with FA. Here we report on the feasibility of a short but comprehensive brain MRI protocol to be used in conjunction with PET imaging of mitochondrial function of the heart and the brain in a single site multi-modal imaging study in FA.METHODS
Eight FA patients have been scanned (4 males, 4 females, mean age = 37.0 ± 15.8 years, mean disease duration = 14.0 ± 8.1 years) on a 3T Siemens TrioTim system using a 32-channel head coil. Mean score on the Scale for the Assessment and Rating of Ataxia (SARA), which ranges from 0 (no ataxia) to 40 (most severe ataxia), for this patient group was 16.2 ± 3.0. The multi-parametric MRI (mpMRI) protocol included: T1w and T2w imaging for assessment of anatomy; R2* mapping for iron content, specifically of the dentate nucleus (DN); NODDI for efficient collection of both conventional DTI-like measurements as well as distinct indices of fiber density and dispersion; and magnetization transfer imaging for the estimation of myelin complimentary to the diffusion metrics. A low TE STEAM MRS sequence was chosen for the estimation of metabolite concentrations in a volume of interest placed over the dentate nucleus (DN) in the right cerebellar hemisphere to mitigate signal degradation due to the presence of iron, which is known to exist in FA patients. Pulse sequence details are provided in Figure 1. Total effective scan time for all sequences was 40 minutes and 29 seconds.RESULTS
All 8 consecutive patients were able to complete the scanning session with the planned protocol. Total duration in the scanner suite with preparation time and short breaks between scans was less than 60 minutes per patient. Visual assessment identified good quality imaging data for the majority of sequences and patients. Sample imaging data of 3 individual patients, focusing on the DN, are shown in Figure 2. Sample spectroscopy data are shown in Figure 3. Initial exploratory analyses of DN quantitative metrics indicate changes with disease duration/severity in terms of atrophy, increasing iron content, and microstructural white matter integrity identified with both NODDI and DTI.DISCUSSION AND CONCLUSION
We report feasibility of acquiring good data quality across all sequences on this widely available 3T MR imaging platform. The total scan time was tolerated well by these patients with varying degrees of ataxia symptomatology, suggesting the potential for rich, longitudinal quantitative phenotyping of multiple features of the central nervous system in this population. Future work will include the scanning of 4 more patients, expanding the quantitative analysis to more brain regions, as well as performing tract-based analysis of microstructural change in efferent fiber pathways from the DN such as the superior cerebellar peduncle using healthy volunteer reference data.Acknowledgements
Authors Koene Van Dijk and Courtney Bishop contributed equally to this work. We want to sincerely thank all participants for their willingness to take part in this study.References
- Schulz JB, Boesch S, Bürk K, Dürr A, Giunti P, Mariotti C, Pousset F, Schöls L, Vankan P, Pandolfo M. Diagnosis and treatment of Friedreich ataxia: a European perspective. Nat Rev Neurol. 2009 5(4):222-34.2.
- Tsou AY, Paulsen EK, Lagedrost SJ, Perlman SL, Mathews KD, Wilmot GR, Ravina B, Koeppen AH, Lynch DR. Mortality in Friedreich ataxia. J Neurol Sci. 2011;307(1-2):46-9.3.
- Selvadurai LP, Harding IH, Corben LA, Georgiou-Karistianis N. Cerebral abnormalities in Friedreich ataxia: A review. Neurosci Biobehav Rev. 2018;84:394-406.4.
- Chen L, Van Dijk KRA, Henning EC, Deng J, Martelli A, Bulawa C, Chasse R, Loudon P, Wells L, Rabiner EA, Festenstein R, Charnas LR. PET Imaging With [18F]BCPP-EF As A Mitochondrial Complex 1 Biomarker For Friedreich Ataxia. International Ataxia Research Conference. Washington DC 2019. http://iarc2019.org/abstract/2019-IARC-AbstractBook.pdf. Accessed December 1, 2020.
Figures
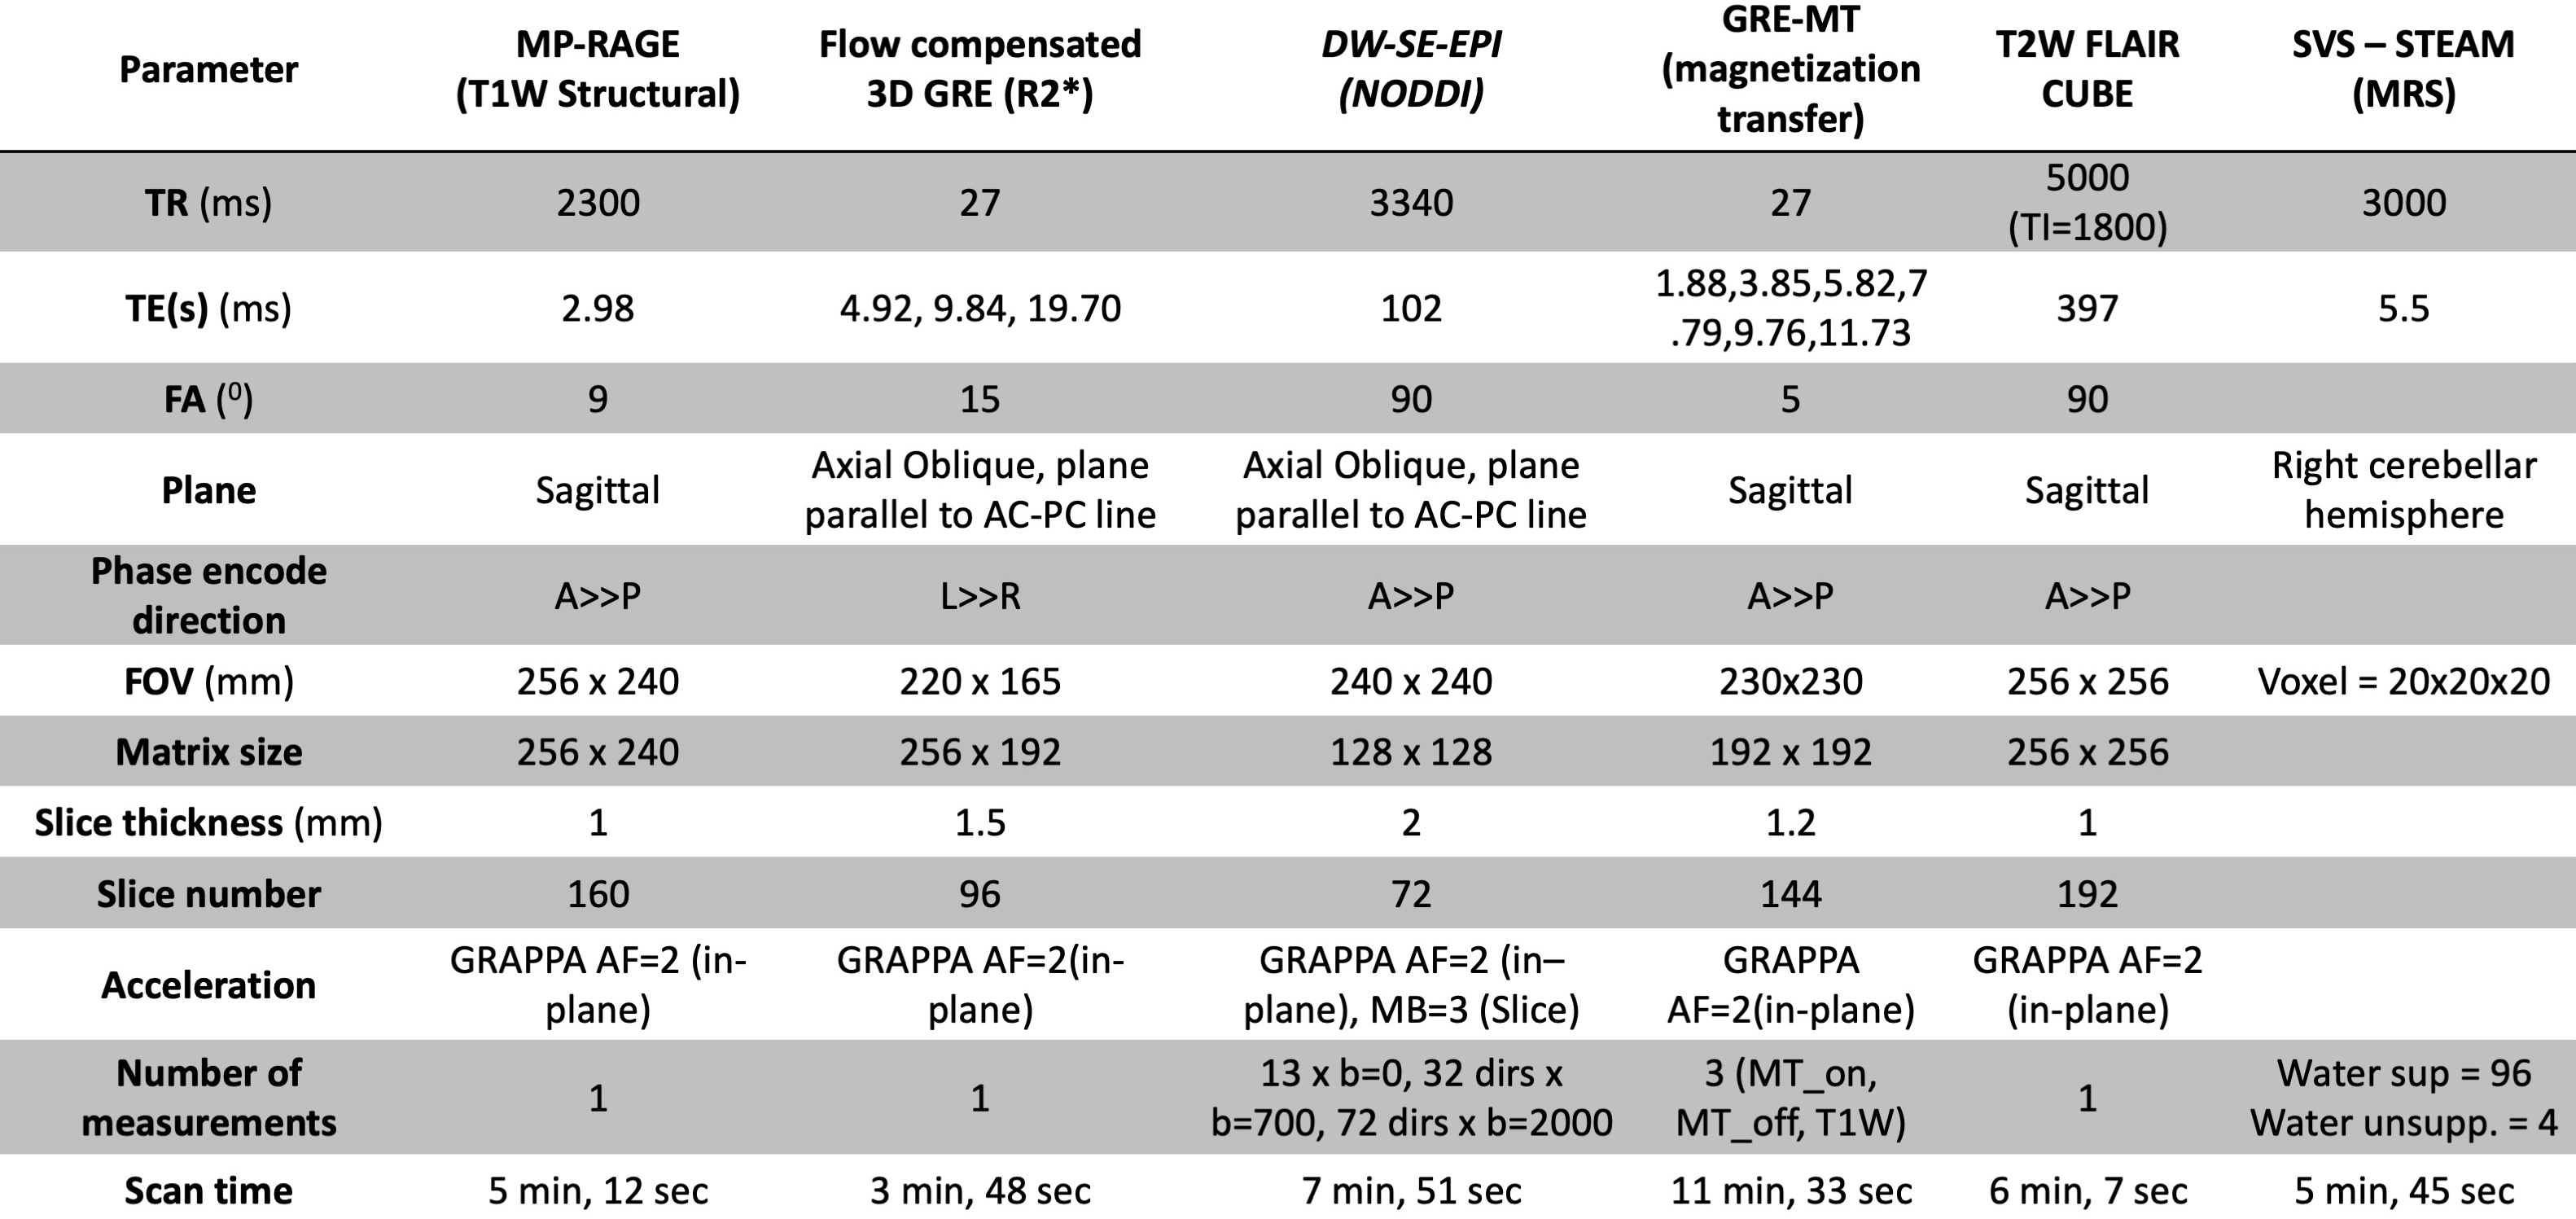
Figure 1. MRI pulse sequences and parameters.
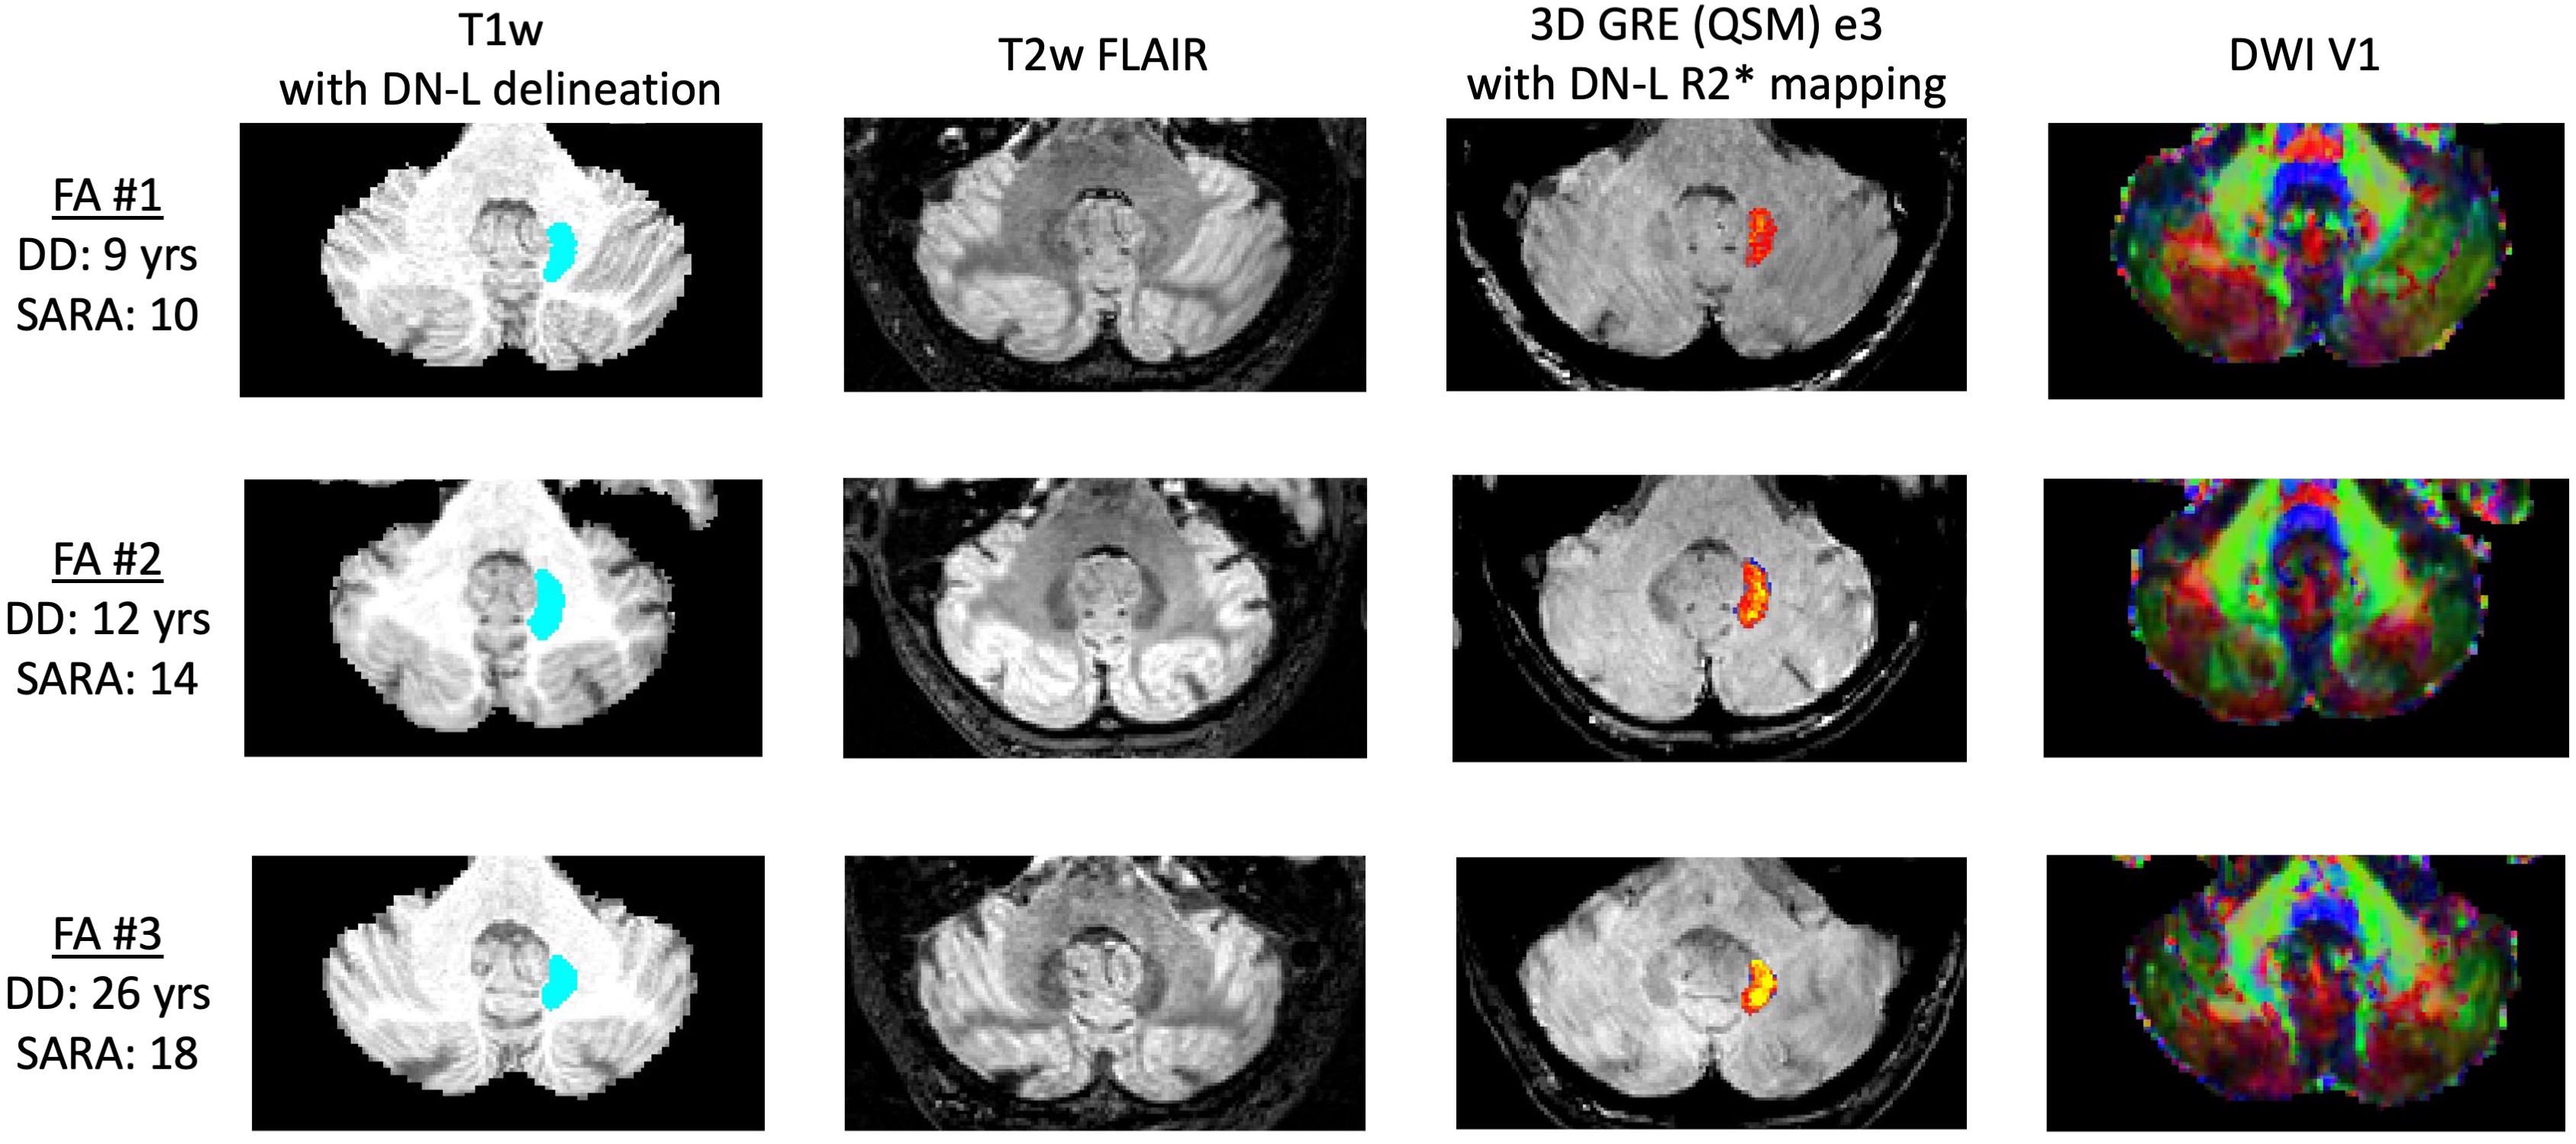
Figure 2. Sample dentate nucleus ROIs and contrast of mpMRI data at 3T. T1w: blue indicates the location of the participants’ left dentate nucleus; QSM: heatmap indicates estimated iron content in the left dentate nucleus mask as measured via R2* mapping (color scale shows rendering of values 5.0-40.0 s-1); DWI: dominant fiber orientation coded as follows: red=left-right, green=anterior-posterior, blue=superior-inferior. DD=disease duration. SARA=Scale for the Assessment and Rating of Ataxia.
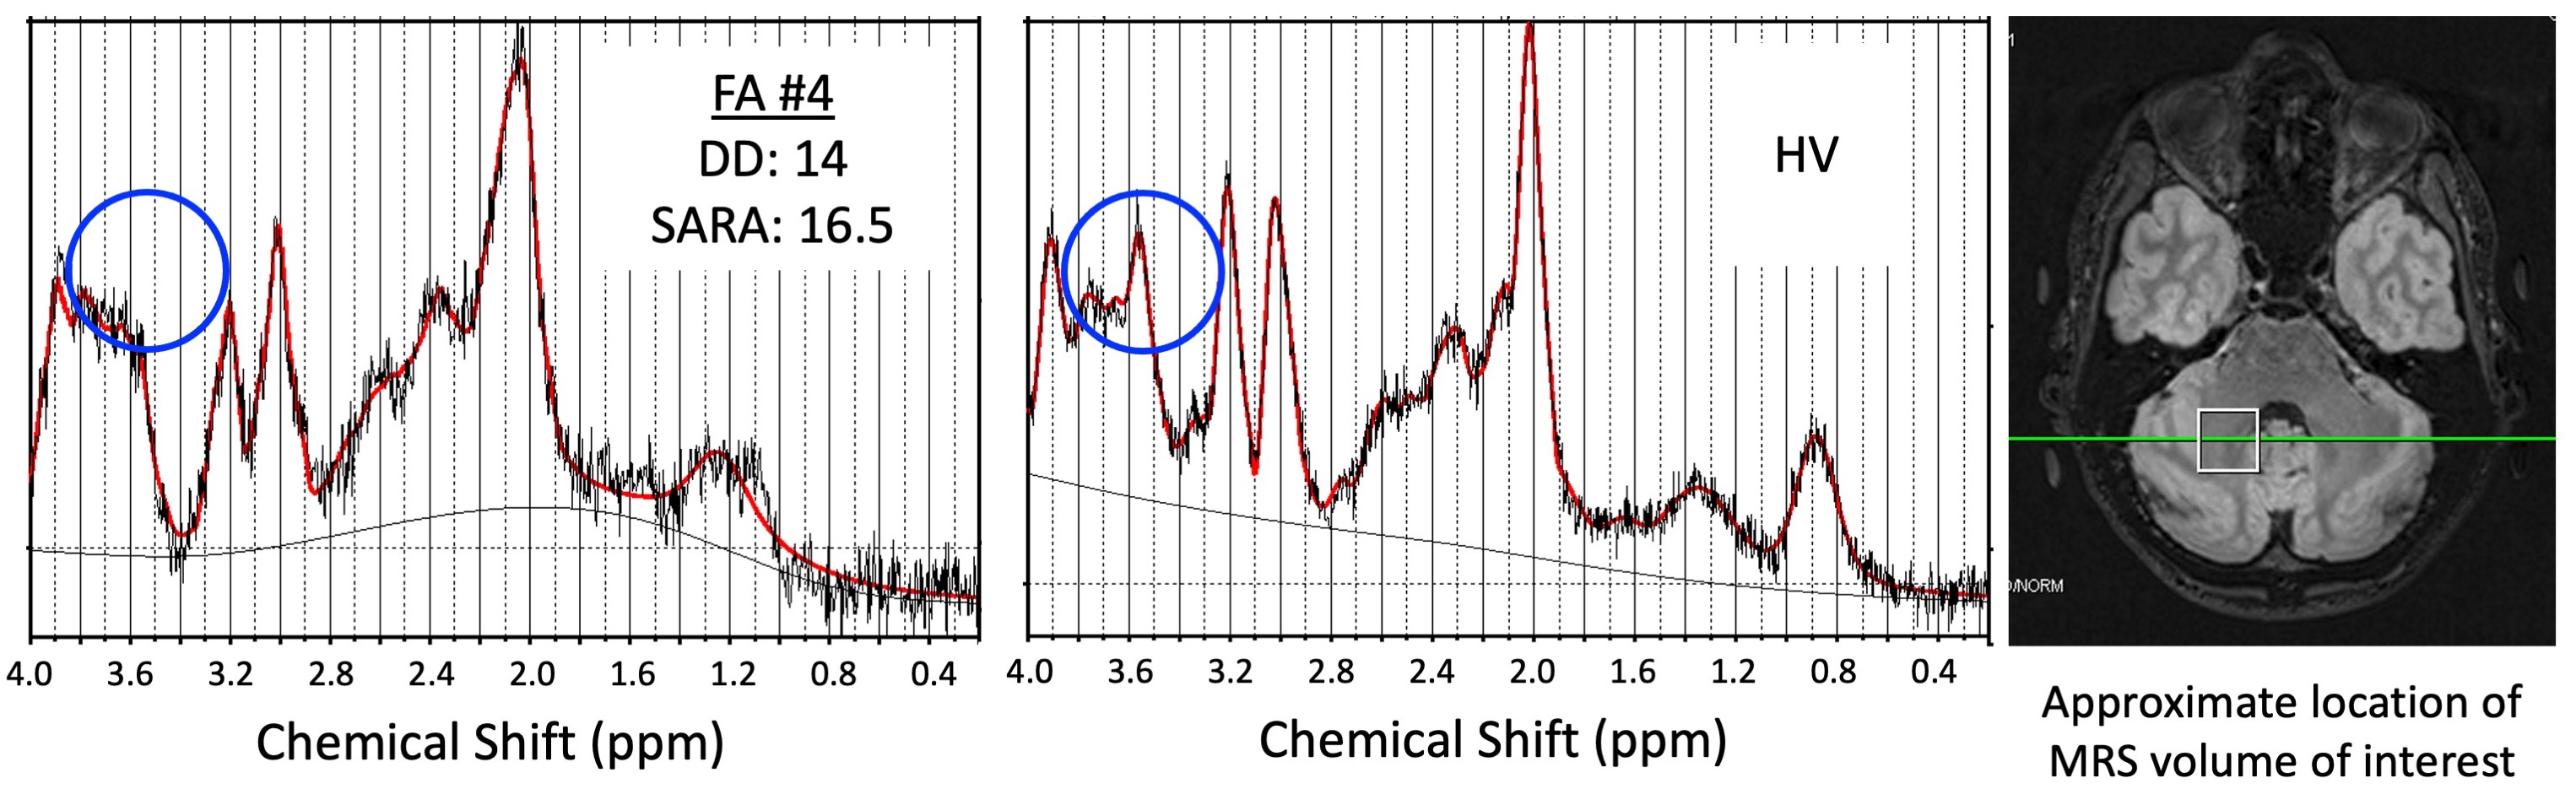
Figure 3. Sample spectroscopy data. Green circles indicate the location of the Myo-inositol peak (3.5ppm) for FA patient #4 (left panel) and a healthy volunteer (HV; center panel). The white square shows the location of the MRS volume of interest placed over the right dentate nucleus (right panel).