3021
Quantitative mapping of substantia nigra iron and neuromelanin in Parkinson’s Disease1Weill Cornell Medicine, New York, NY, United States, 2Meinig School of Biomedical Engineering, Cornell University, Ithaca, NY, United States, 3Hospital for Special Surgery, New York, NY, United States
Synopsis
Parkinson’s disease (PD) is a neurodegenerative disorder characterized pathologically by loss of dopaminergic neurons and accumulation of iron in the substantia nigra. Our MR imaging study uses quantitative susceptibility mapping (QSM) and magnetization transfer contrast (MTC) to quantify iron and neuromelanin, respectively in healthy controls, patients with REM sleep behavior disorder (RBD), and PD. We demonstrate that patients with PD have an increase in iron but reduction in neuromelanin in the substantia nigra as compared to healthy controls. Loss of dopaminergic neurons can cause release of neuromelanin, thus furthering a neuroinflammatory and neurodegenerative cycle1.
Introduction
Parkinson’s disease is a neurodegenerative disorder characterized by motor dysfunction including bradykinesia, rigidity, and rest tremor. These phenotypic changes are in part due to the death of neuromelanin-rich dopaminergic neurons in the substantia nigra. The loss of neuromelanin and consequent release of iron both cause oxidative stress, which can lead to activation of microglia and neuroinflammation. RBD is characterized by loss of REM sleep paralysis, and is a powerful predictor of neurodegenerative synucleinopathies, including PD2. QSM has been used as a PD biomarker for monitoring disease progression and for precise subthalamic nuclei targeting in deep brain stimulation3. Neuromelanin-sensitive MRI has been developed using magnetic transfer contrast (MTC) to study neuromelanin4. We demonstrate that QSM and MTC can be used to characterize iron in the substantia nigra in subjects with RBD and PD.Methods
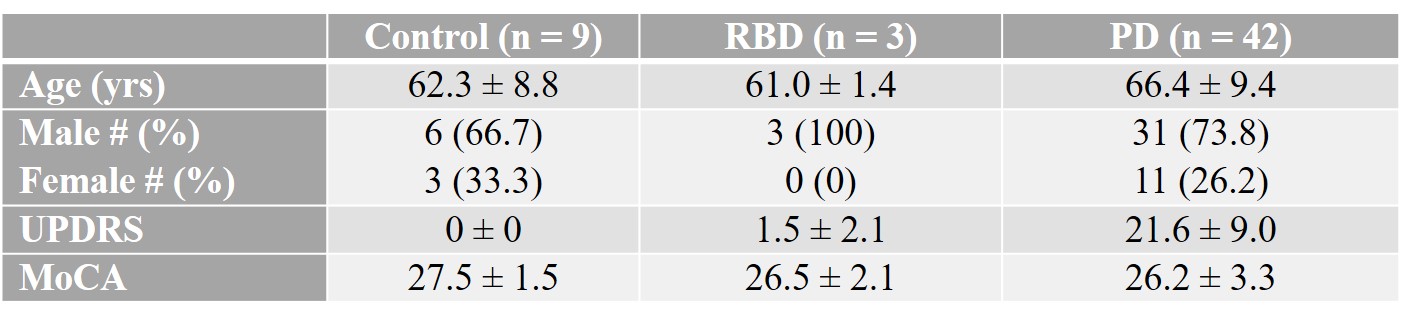
N = 54 subjects were enrolled in this IRB-approved study. Subject demographics are summarized in Table 1. Subjects underwent MRI on a Siemens Skyra 3T scanner to quantify iron and neuromelanin, and neurological testing to assess disease severity. The imaging protocol included a high-resolution whole brain axial QSM sequence (voxel size 0.4´0.4´0.5mm3, TR 44 msec, 10 echoes, DTE 4.1msec, typical matrix size 260x320x256), and a 2D axial GRE-MTC sequence in midbrain (3mm slice thickness, in-plane resolution 0.4x0.4mm2, 11 consecutive slices, TR 284msec, TE 2.83 msec, flip angle 40°, MTC pulse flip angle 500°). QSM was reconstructed using MEDI+0 where regularization on an automatically segmented CSF mask was used for zero referencing5. Parameters for QSM reconstruction were the same across all cases. QSM was analyzed by tracing the substantia nigra and red nucleus using ITK-SNAP software6 by three experienced radiologists. Neuromelanin images were analyzed according to a recent study4 to semi-automatically segment substantia nigra on MTC and quantify neuromelanin volume. Statistical analysis was conducted on MATLAB R2020a. Data were analyzed by one-way analysis of variance (ANOVA), and Bonferroni correction because of multiple comparisons.Results
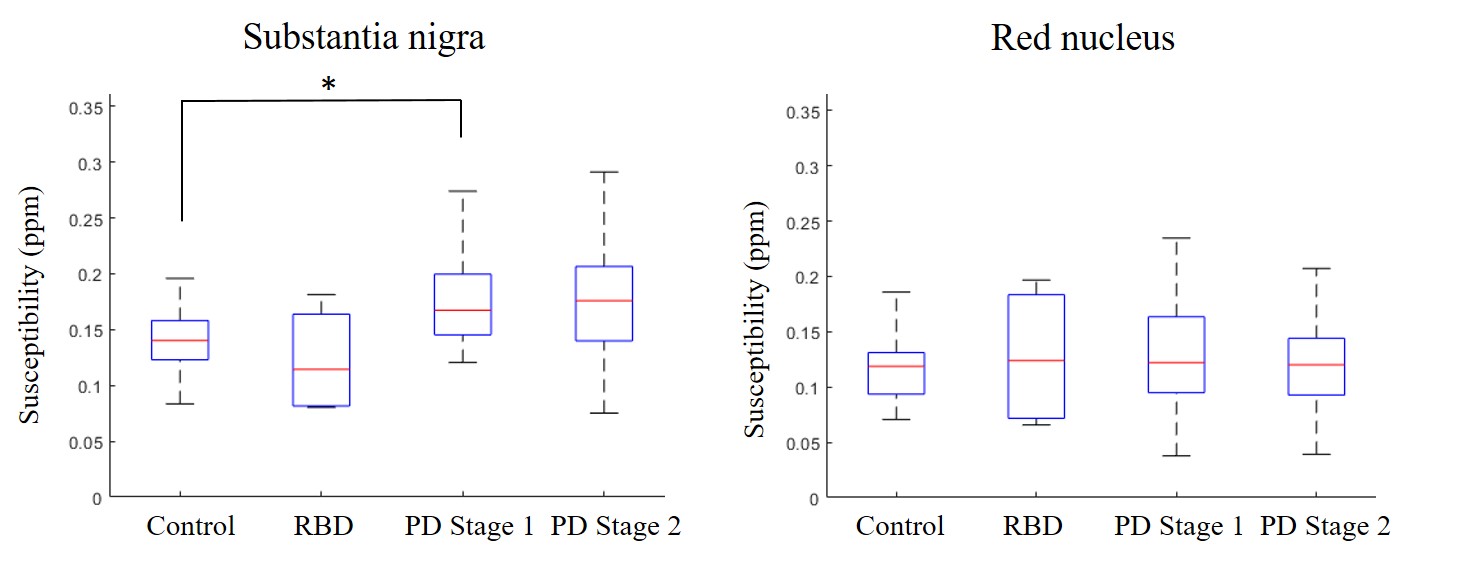
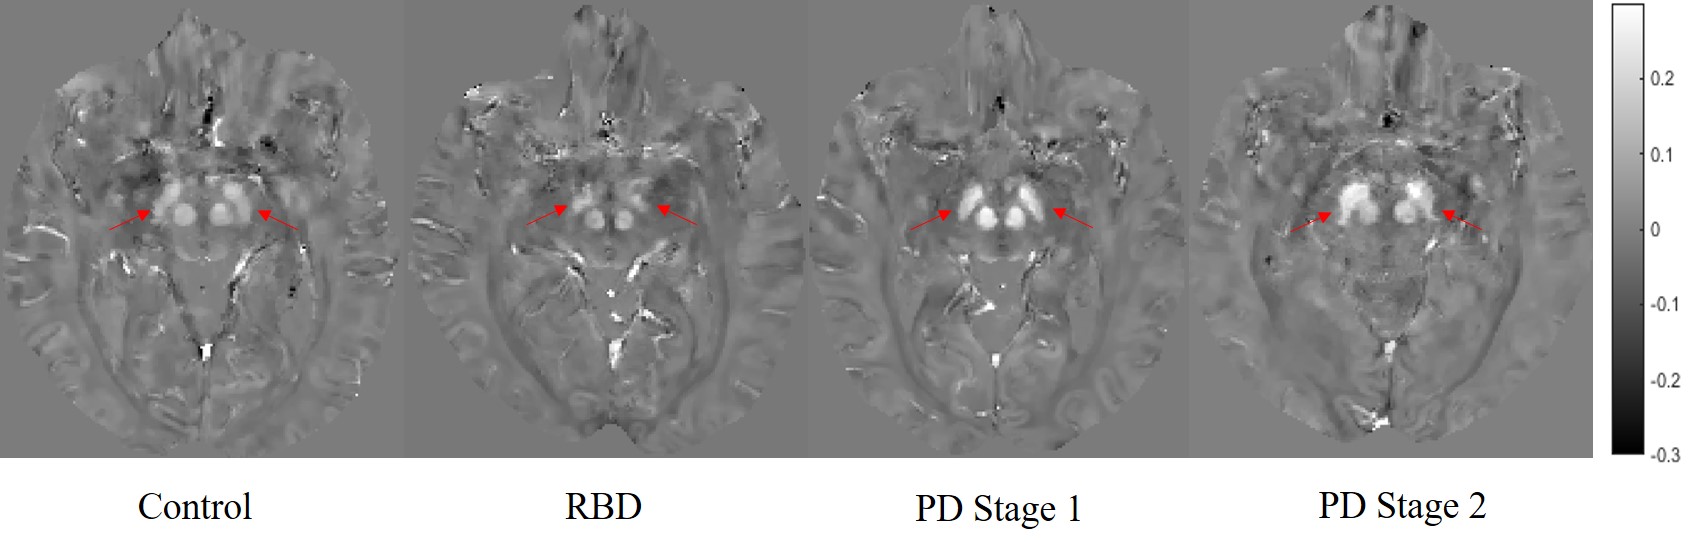
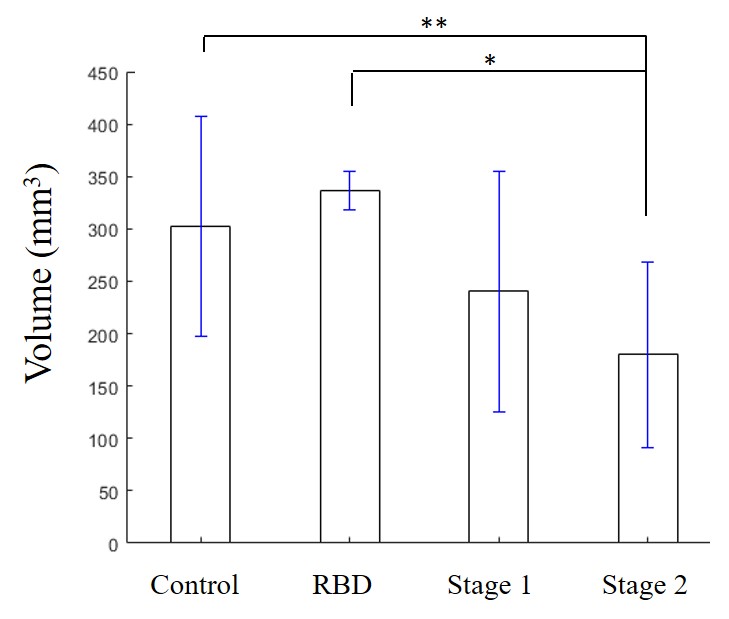
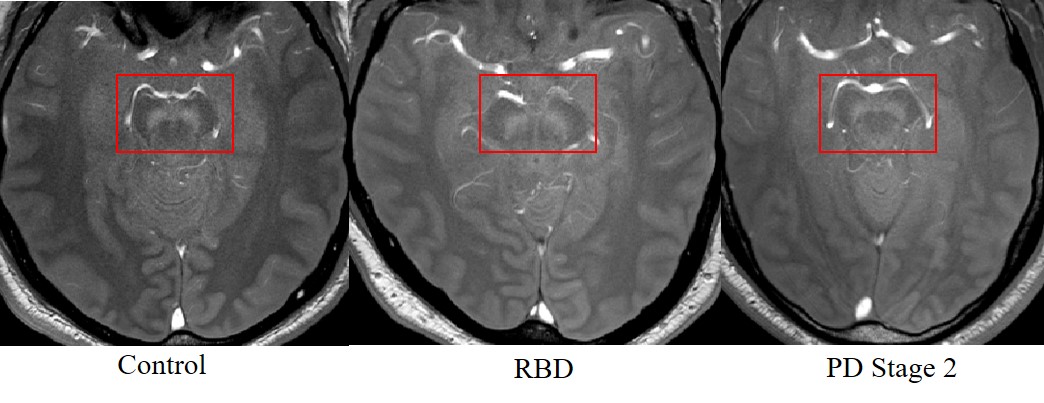
As seen in Figure 1, there was an increase in susceptibility in the SN between healthy controls and PD Stage 1 (p = 0.024), but there were no statistically significant differences in susceptibility in the RN across all cohorts (p = 0.69). Representative QSM images of all cohorts show increased susceptibility in the SN of PD as compared to healthy control or RBD (Figure 2). There was a decrease in neuromelanin volume in the SN in PD Stage 2 as compared to controls (p = 0.01) and RBD (p = 0.039; Figure 3); representative images are shown in Figure 4.Discussion
Iron and neuromelanin accumulate naturally during the aging process7, but their levels must be carefully regulated, as excess iron can cause mitochondrial dysfunction and cell death, while loss of neuromelanin can release chelated metals, stimulating an inflammatory response. In PD subjects, QSM revealed an increase in SN susceptibility reflecting iron accumulation, while MTC imaging showed a decrease in neuromelanin volume indicating neuronal loss. There were no differences in susceptibility or neuromelanin volume between control and RBD subjects, but our RBD sample size is small. Nevertheless, RBD is a biomarker for PD, so carefully monitoring iron and neuromelanin levels in these subjects may provide insight into disease development. Taken together, QSM and MTC revealed iron accumulation coupled with neuromelanin loss in PD, which can drive a positive feedback loop of neuroinflammation and neurodegeneration.Conclusion
There is an increase in susceptibility but a reduction in neuromelanin volume in subjects with PD as compared to healthy controls. Accurately quantifying changes in iron using non-invasive methods is critical for monitoring disease initiation and progression, and can be useful in the development of iron chelation therapy.Acknowledgements
No acknowledgement found.References
1. Zucca FA, Basso E, Cupaioli FA, et al. Neuromelanin of the human substantia nigra: an update. Neurotox Res 2014;25:13-23
2. Postuma RB, Gagnon JF, Bertrand JA, et al. Parkinson risk in idiopathic REM sleep behavior disorder: preparing for neuroprotective trials. Neurology 2015;84:1104-1113
3. Wang Y, Spincemaille P, Liu Z, et al. Clinical quantitative susceptibility mapping (QSM): Biometal imaging and its emerging roles in patient care. J Magn Reson Imaging 2017;46:951-971
4. Chen X, Huddleston DE, Langley J, et al. Simultaneous imaging of locus coeruleus and substantia nigra with a quantitative neuromelanin MRI approach. Magn Reson Imaging 2014;32:1301-1306
5. Liu Z, Spincemaille P, Yao Y, et al. MEDI+0: Morphology enabled dipole inversion with automatic uniform cerebrospinal fluid zero reference for quantitative susceptibility mapping. Magn Reson Med 2018;79:2795-2803
6. Yushkevich PA, Piven J, Hazlett HC, et al. User-guided 3D active contour segmentation of anatomical structures: significantly improved efficiency and reliability. Neuroimage 2006;31:1116-1128 7. Vila M. Neuromelanin, aging, and neuronal vulnerability in Parkinson's disease. Mov Disord 2019;34:1440-1451
Figures