3020
Automatic assessment of motion artifact on Nigrosome 1 visualization protocol using CNN-LSTM1Division of Biomedical Engineering, Hankuk University of Foreign Studies, Yongin, South Korea, yongin, Korea, Republic of, 2Seoul St.Mary’s Hospital, Department of Radiology, The Catholic University of Korea, Seoul, South Korea, Seoul, Korea, Republic of
Synopsis
We proposed an automatic evaluation model for estimating the degree of motion artifacts in high-resolution multi-echo gradient echo images for nigrosome-1 visualization in the substantia nigra. A combination of a convolutional neural network and a long short-term memory was used to develop the automatic motion evaluation model. The results demonstrated that the proposed model could be useful tools for N1 visualization for diagnosing Parkinson’s disease.
Introduction
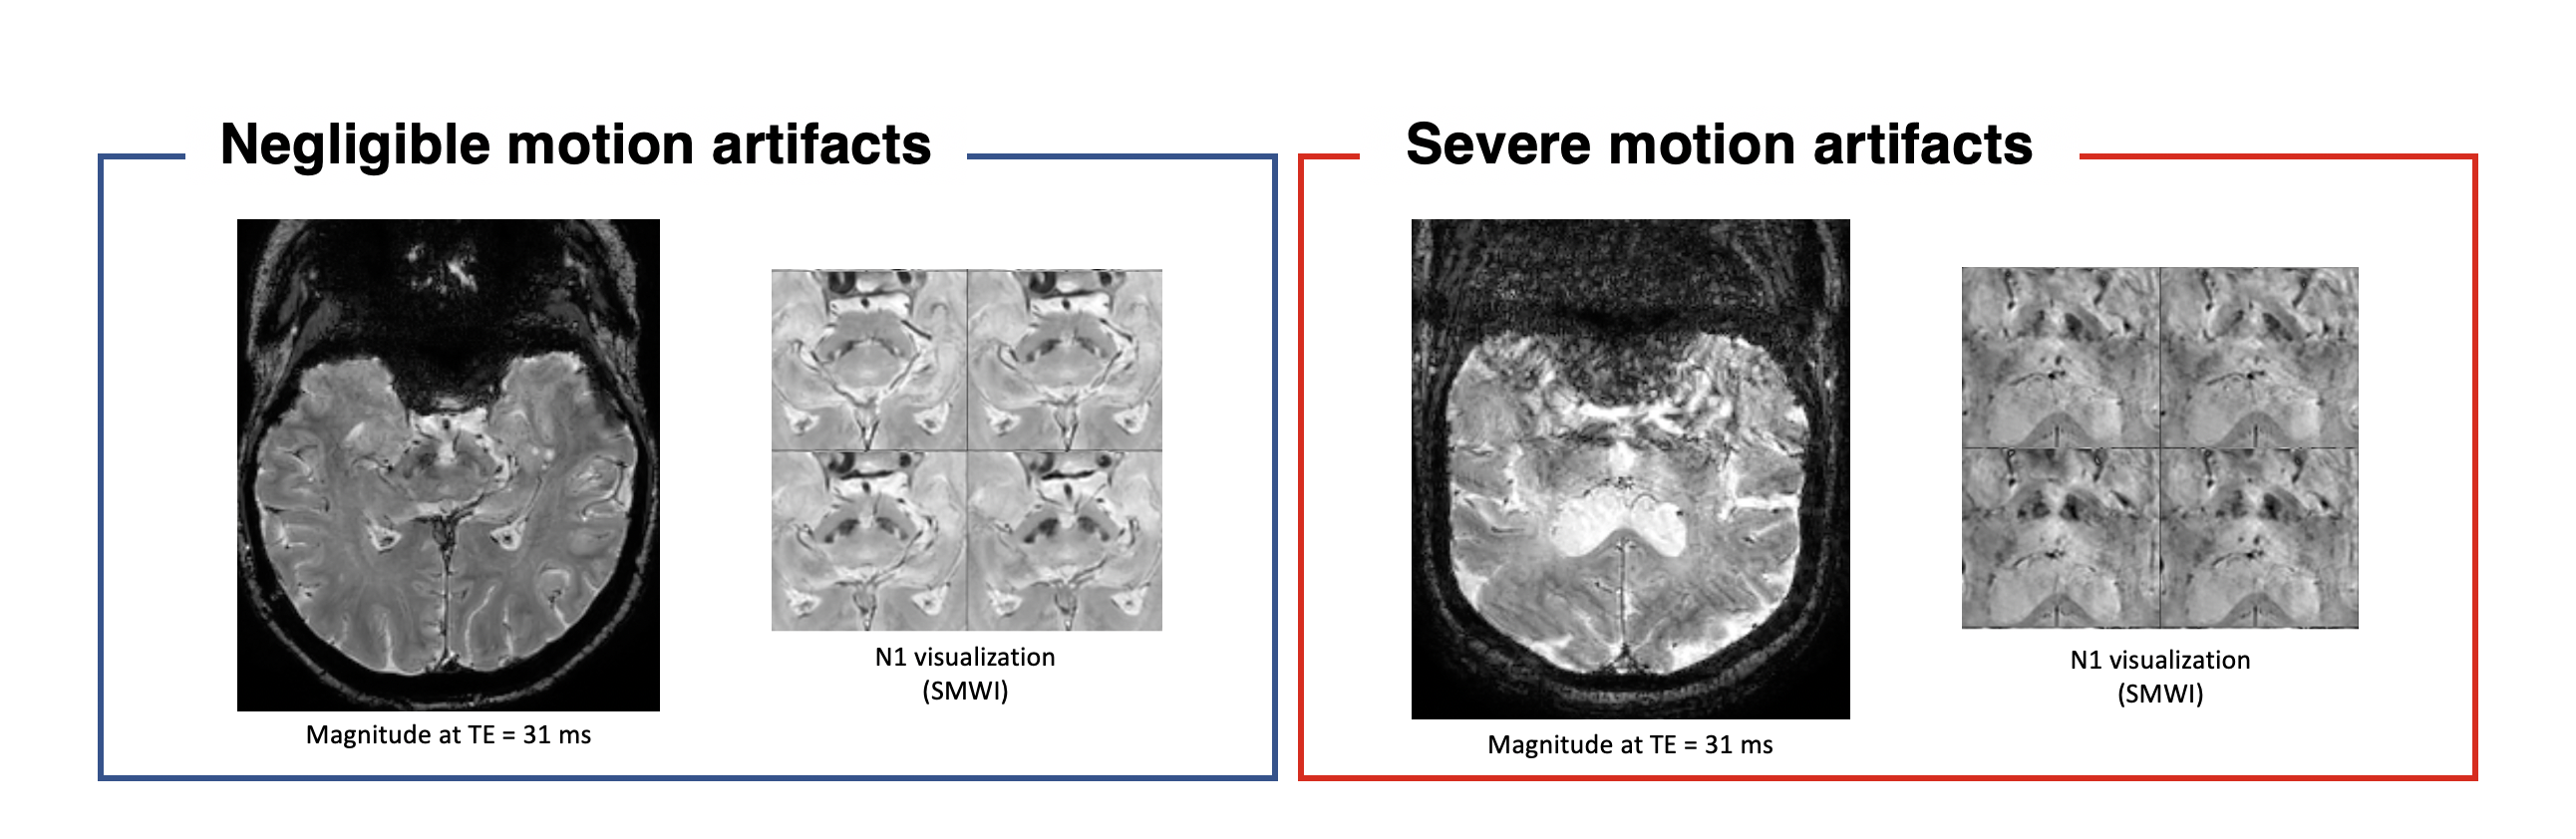
Recently, nigrosome 1 (N1) visualization using high-resolution magnetic susceptibility contrast images is drawing attention to evaluate the substantia nigra in Parkinson’s Disease (PD) [1-3]. However, the MR imaging sequence, (high-resolution 3D multi-echo gradient echo) for N1 visualization is sensitive to patient’s motions, which leads to N1 visibility degradation as shown in Figure 1. In particular, PD patients may have symptoms such as involuntary tremors, so it is necessary to assess and reduce motion artifacts is needed to increase the reliability of diagnosis [2]. If the degree of motion artifacts in the acquired images, it can be helpful in clinical use, such as deciding whether to retest the protocol or providing the degree of uncertainty of N1 visualization. In this study, we develop and test a system that automatically assess the degree of motion artifacts in the high-resolution multi-echo gradient echo images (mGRE) using a combination of a convolutional neural network (CNN) and a long short-term memory (LSTM).Methods
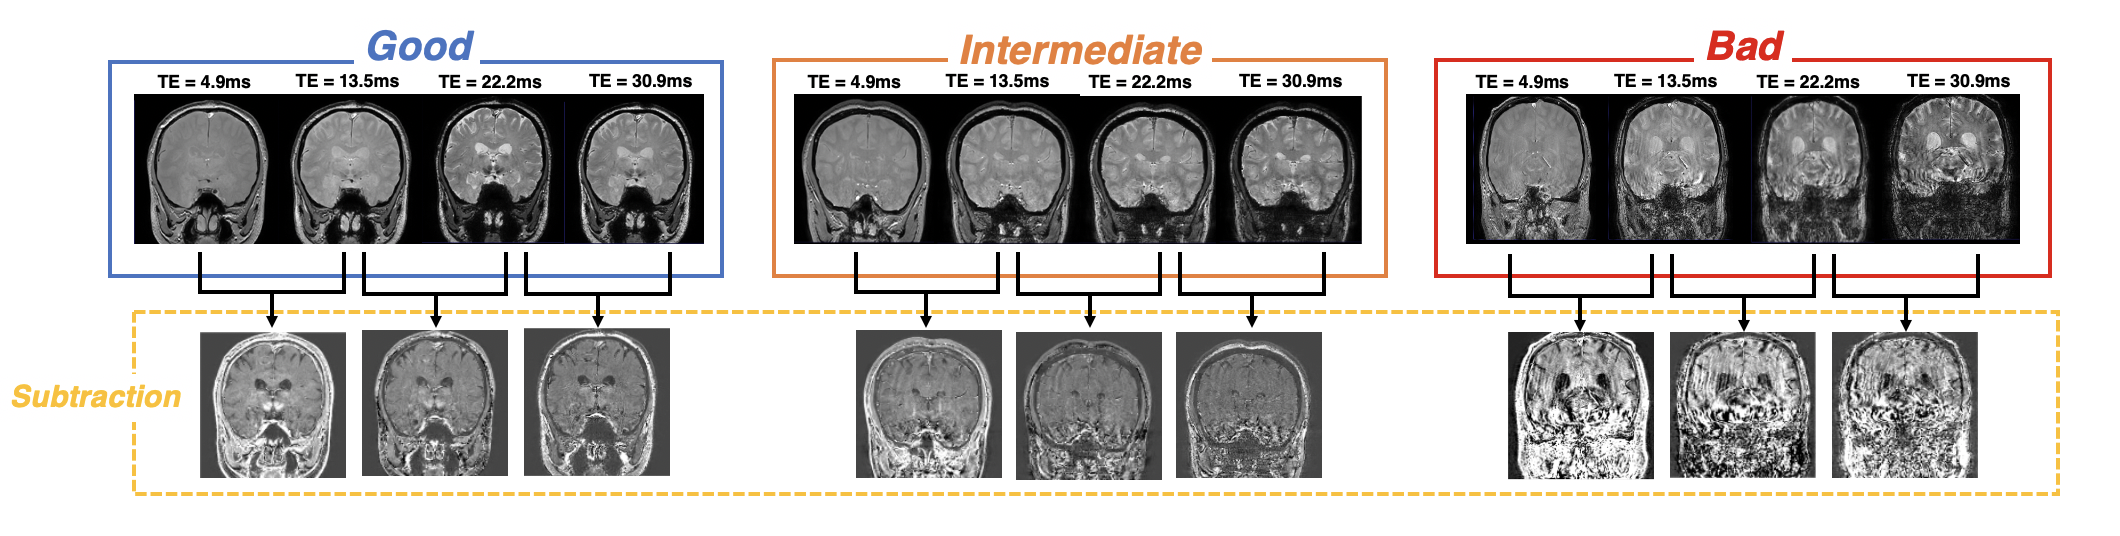
DatasetTotal 210 mGRE data acquired from the N1 visualization protocol [3] was collected at 3T MRI. The acquisition parameters were as follows: 3D mGRE, TR = 80 ms, TE = 4.9, 13.5, 22.2, 30.9, 39.6 ms, voxel size = 0.75 x 0.75 x 1.5 mm3, number of slices = 32. We split dataset for training and test our system: training (N=186), validation (N=24). The labels for the degree of motion artifacts consisted of three classes. Figure 2 shows the representative examples of slices labeled as “Good”(negligible motion artifacts), “Intermediate”(moderate motion artifacts), and “Bad”(severe motion artifacts). For training and validation sets, labeling was performed by visual evaluation of the magnitude images of individual echoes and the difference images between echoes. As shown in Figure 2, the difference images between echoes make it easier to identify the effects of motions on the images. These difference images were also utilized as input data for our automatic assessment system.
Deep learning model architecture to classify motion artifact
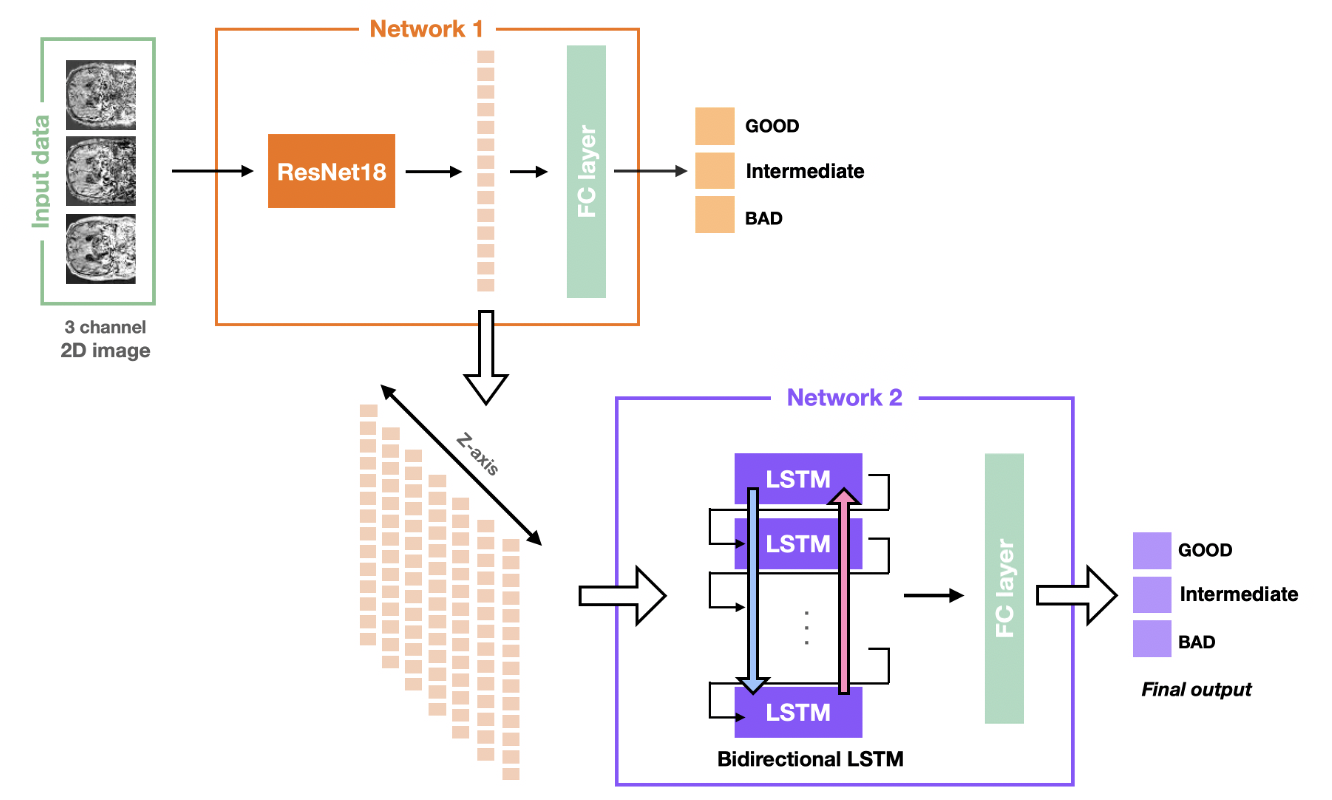
Figure 3 describes our proposed system for assessment of the degree of motion artifacts. Firstly, we used the ResNet-18 architecture as a first network for slice-wise motion assessment. The difference images between the echoes were used as the input data (multi-channel 2D images) for the first network. Since the motion artifacts of 3D MR acquisitions essentially spread in the two phase-encoding directions, a second network was constructed with bidirectional LSTM layer. To utilize the imaging characteristics from the entire slices, the features from the last hidden layer of the first network were extracted and the extracted feature vectors were arranged in order in the slice-direction. And then, a bidirectional LSTM network is used to classify the degree of motion artifacts based on these features [5-9].
Evaluation
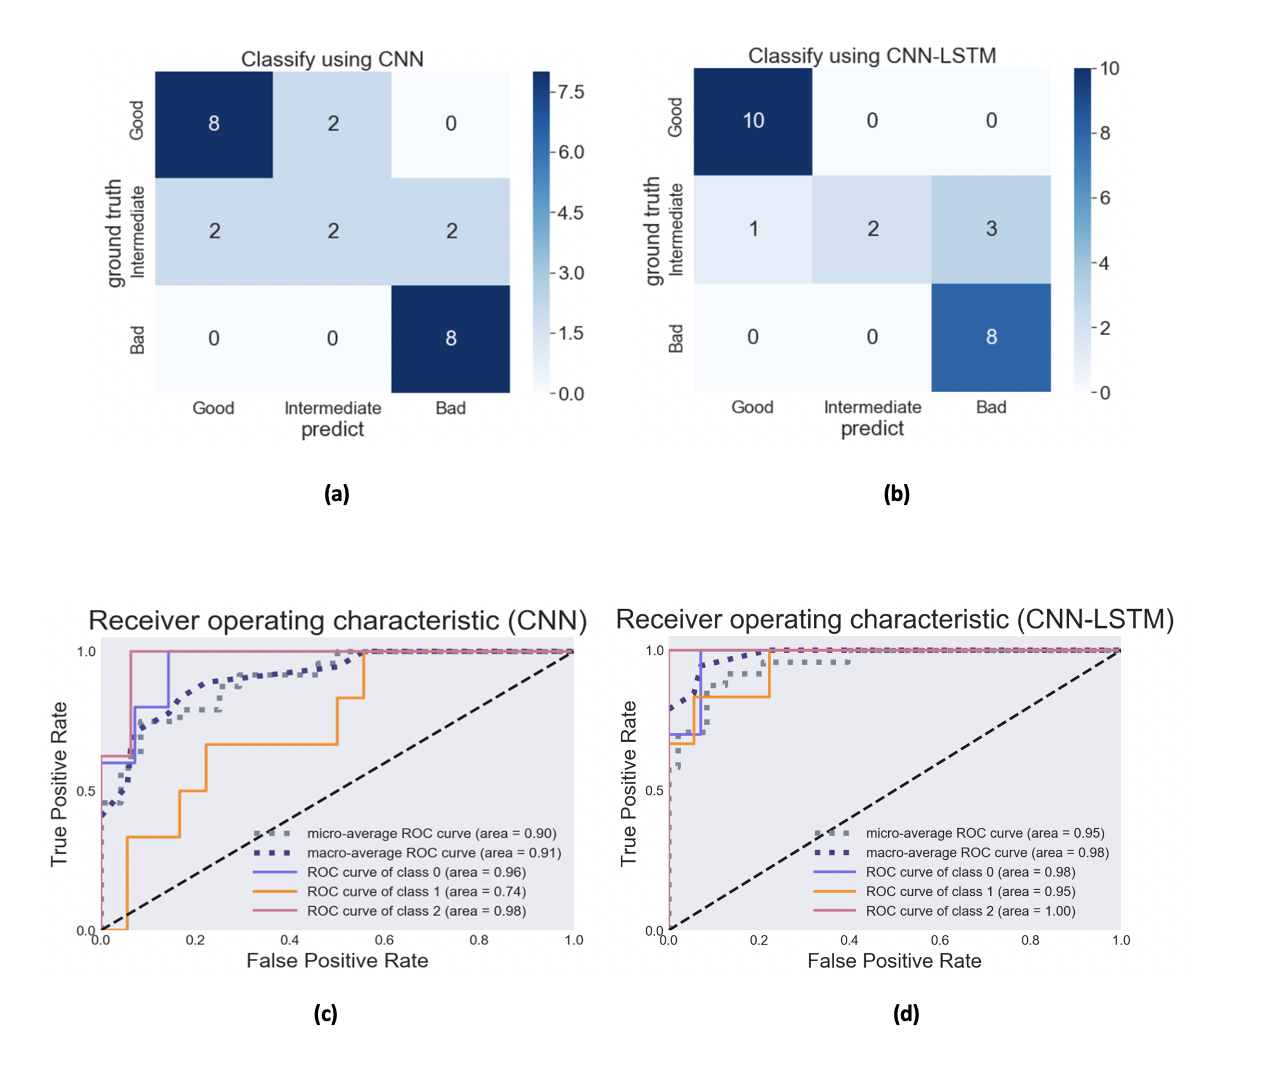
Confusion matrix and receiver operating curve was calculated for the validation set result. The ROC analysis in multi-class classification assumed to be a one-versus-rest (OvR) problem. ROC for each class was calculated, and min and max for the three classes were calculated. The classification results using only the first network (CNN) were compared with the results using the two sequential networks (CNN-LSTM) to investigate the effects of LSTM on the predictions.
Results
Figure 4 shows a comparison of the results from the CNN and the CNN-LSTM models for validation set. Prediction accuracy was 75% for the CNN model, and 83% for the CNN-LSTM model. F1 score and macro-average AUC for the CNN model were 0.73 and 0.91, respectively. Those from the CNN-LSTM model were 0.81 and 0.98, respectively.Discussion
In this study, the results demonstrated that our CNN-LSTM model could provide the degree of motion artifacts on the acquired images of N1 imaging protocol. The proposed model showed the classification results almost similar results to those classified by human observers for the validation set. The proposed model can be useful tools for determining whether to retest the protocol or providing the degree of the uncertainty of N1 visualization.Acknowledgements
NRF-2020R1F1A1070517References
1. Sasaki, M. et al. Neuromelanin magnetic resonance imaging of locus ceruleus and substantia nigra in Parkinson’s disease. Neuroreport 17, 1215–1218 (2006).
2. Samii, A., Nutt, J. G. & Ransom, B. R. Parkinson’s disease. Lancet (London, England) 363, 1783–1793 (2004).
3. Nam, Y., Gho, S. M., Kim, D. H., Kim, E. Y. & Lee, J. Imaging of nigrosome 1 in substantia nigra at 3T using multiecho susceptibility map-weighted imaging (SMWI). J. Magn. Reson. Imaging 46, 528–536 (2017).
4. An, H. et al. DeepResp: Deep learning solution for respiration-induced B0 fluctuation artifacts in multi-slice GRE. Neuroimage 224, 117432 (2020).
5. Nam, Y. Shin, NY. Kim, EY. Simultaneous imaging of neuromelanin and nigrosome 1 in substantia nigra using 3D multi-echo gradient echo acquisition with magnetization transfer preparation. in ISMRM 2635 (2019)
6. He, K., Zhang, X., Ren, S. & Sun, J. Deep residual learning for image recognition. in Proceedings of the IEEE conference on computer vision and pattern recognition 770–778 (2016).
7. Hochreiter, S. & Schmidhuber, J. Long short-term memory. Neural Comput. 9, 1735–1780 (1997).
8. Wang, J., Yu, L.-C., Lai, K. R. & Zhang, X. Dimensional sentiment analysis using a regional CNN-LSTM model. in Proceedings of the 54th Annual Meeting of the Association for Computational Linguistics (Volume 2: Short Papers) 225–230 (2016).
9. Shahzadi, I., Tang, T. B., Meriadeau, F. & Quyyum, A. CNN-LSTM: Cascaded framework for brain Tumour classification. in 2018 IEEE-EMBS Conference on Biomedical Engineering and Sciences (IECBES) 633–637 (IEEE, 2018).
Figures