3018
Substantia Nigra Susceptibility Features Derived by Radiomics Predict Motor Outcome for STN-DBS in Parkinson’s Disease1Radiology, Ruijin Hospital, Shanghai Jiao Tong University School of Medicine, Shanghai, China, 2Institute for Medical Imaging Technology, School of Biomedical Engineering, Shanghai Jiao Tong University, Shanghai, China, Shanghai, China, 3Changshu Hospital Affiliated to Nanjing University of Chinese Medicine, No. 6 Huanghe Road, Changshu, China, Changshu, China, 4Department of Neurosurgery, Center for Functional Neurosurgery, Ruijin Hospital, Shanghai Jiao Tong University School of Medicine, Shanghai, China, Shanghai, China, 5Shanghai United Imaging Intelligence Co., Ltd., Shanghai, China, Shanghai, China, 6Institute for Medical Imaging Technology, Department of Biomedical Engineering, Shanghai Jiao Tong University, Shanghai, China, Shanghai, China, 7Department of Radiology, Wayne State University, Detroit, Michigan, USA, Detroit, MI, United States, 8Philips Healthcare,Shanghai,China, Shanghai, China
Synopsis
Currently, there are neither individual objective nor quantitative indicators for predicting DBS motor outcome. We hypothesized that the distribution of SN iron changes in PD patients may reflect a specific disease trait and could potentially account for some variability in the motor outcomes after sub-thalamic nucleus (STN) deep brain stimulation (DBS). We developed a radiomics model with machine learning (RA-ML) based on preoperative individual QSM of the SN to predict motor outcome for STN-DBS in PD and it performed best with an AUC of 0.897. In addition, the threshold probability of the RA-ML model can differentiate surgical responders and non-responders.
Introduction
Currently, there are neither individual objective nor quantitative indicators for predicting DBS motor outcome preoperatively, warranting the search for imaging biomarkers to predict surgical efficacy and screen for suitable candidates. We hypothesized that the distribution of iron changes in the SN in PD patients may reflect a specific disease trait and could potentially account for some variability in the motor outcomes after sub-thalamic nucleus (STN) deep brain stimulation (DBS) surgery. In this study, we take advantage of radiomics analysis with machine learning to investigate the correlation between the preoperative QSM data of the SN and post-operative clinical motor outcome as assessed with the Unified Parkinson’s Disease Rating Scale Part III (UPDRS-III) in PD patients. We combined MRI imaging radiomic features, presurgical clinical information and postsurgical motor outcome to establish a noninvasive, predictive model for PD patients who may require STN DBS surgery.Methods
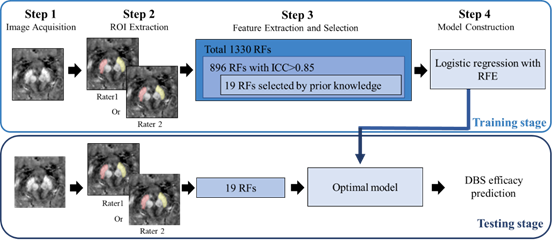
Twenty PD patients were scanned consecutively at 3T (Ingenia, Philips Healthcare, Netherlands) with a three-dimensional multi-echo gradient-recalled echo sequence (medication OFF) 1-3 days before the STN DBS surgery. The third section of Unified Parkinson's disease Rating Scale (UPDRS-III) scores were recorded 1-3 days before and 6 months after DBS surgery. All patients were scanned with a 15-channel phased array head coil using a multi-echo GRE sequence. Thin foam pads both under and beside the head were used to stabilize the head and reduce possible motion artifacts. The imaging parameters were chosen as follows: voxel size = 1× 1 × 1 mm3; flip angle = 12o; repetition time (TR) = 25 ms; eight echoes with the first echo time (TE1) = 3.3 ms; echo spacing (ΔTE) = 2.6 ms; sampling bandwidth = 673 Hz/pixel; matrix size = 220 × 220; number of slices = 136; phase encoding SENSE acceleration factor = 2; and a total acquisition time of 6 minutes and 16 seconds. The long axis of the sagittal imaging slab was placed perpendicular to the anterior commissure-posterior commissure (AC-PC) line. Regions of interest (ROIs) of the bilateral SN were drawn semi-automatically. Subsequently, volumes of interest (VOIs) were segmented for extracting radiomic features with machine learning. Finally, two logistic regression models (with or without clinical information: disease duration, the preoperative levodopa equivalent daily dosage, and response to the levodopa challenge test) based on recursive feature elimination was utilized to classify responders and non-responders (30% as cut-off decrease percentage of pre- and post-surgical UPDRS-III rating scores) in global motor outcome. The processing pipeline of the radiomics model with machine learning is shown in Fig. 1.Results
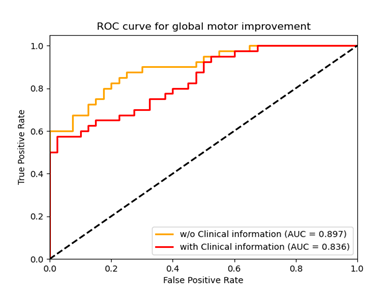
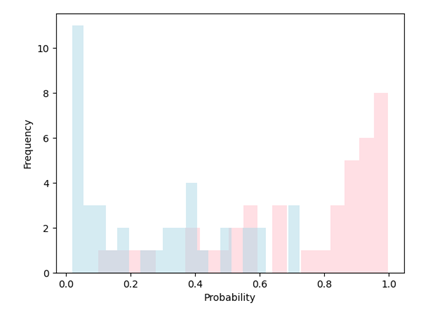
Our radiomics-based analysis (RA-ML) model performs best with an accuracy of 81.2% (AUC=0.897) with respect to the global motor outcome after DBS surgery (Fig. 2.). The accuracy drops to 72.5% (AUC=0.836) after the inclusion of several related clinical variables. In addition, significantly greater GLDM Dependence Variance (GLDM-DV) (p=0.019) and GLRLM Long Run Low Gray Level Emphasis (p=0.041) radiomic values in the SN for non-responders was seen compared to responders. Furthermore, in this model, all test samples whose probability scores were greater than 0.75 or less than 0.1 were correctly classified as responder (pink) or non-responder (blue), respectively (Fig. 3.).Discussion and conclusion
To our knowledge, this is the first study to investigate whether preoperative QSM features of iron in the SN derived by radiomics with machine learning can predict motor improvement in PD patients after STN DBS. The motor outcome of STN-DBS in PD patients is heterogeneous, thus addressing risk–benefit profiles and imposing proper treatment are of vital importance for individuals. The key result in this study relates to creating a noninvasive model with an AUC as high as 0.897 and threshold probability for clinical use in counselling candidates for DBS surgery. Compared with traditional manual analysis, a radiomics-based analysis using machine learning suggests that information as gleaned from preoperative QSM may capture the subtle change of iron deposition in the SN, the most vulnerable target in PD progression. Hence, this QSM based feature can be identified as a potential imaging biomarker for predicting successful DBS outcome. In addition, the semi-automated boundary detection approach we used in this study provides high consistency and reliability between raters.Acknowledgements
No acknowledgement found.References
1. A. Zaidel, H. Bergman, Y. Ritov, Z. Israel, Levodopa and subthalamic deep brain stimulation responses are not congruent. Movement disorders : official journal of the Movement Disorder Society 25, 2379-2386 (2010).
2. A. E. Oakley, J. F. Collingwood, J. Dobson, G. Love, H. R. Perrott, J. A. Edwardson, M. Elstner, C. M. Morris, Individual dopaminergic neurons show raised iron levels in Parkinson disease. Neurology 68, 1820-1825 (2007).
3. N. He, J. Langley, D. E. Huddleston, S. Chen, P. Huang, H. Ling, F. Yan, X. Hu, Increased iron-deposition in lateral-ventral substantia nigra pars compacta: A promising neuroimaging marker for Parkinson's disease. NeuroImage. Clinical 28, 102391 (2020).
4. E. M. Haacke, S. Liu, S. Buch, W. Zheng, D. Wu, Y. Ye, Quantitative susceptibility mapping: current status and future directions. Magnetic resonance imaging 33, 1-25 (2015).
5. C. Liu, W. Li, K. A. Tong, K. W. Yeom, S. Kuzminski, Susceptibility-weighted imaging and quantitative susceptibility mapping in the brain. Journal of magnetic resonance imaging : JMRI 42, 23-41 (2015).
Figures