3017
Fibre-specific white matter reduction in patients with multiple system atrophy: comparison of parkinsonian and cerebellar subtypes1Chang Gung University, Taoyuan, Taiwan, 2Chang Gung Memorial Hospital, Taoyuan, Taoyuan, Taiwan, 3Chang Gung Memorial Hospital, Linkou, Taoyuan, Taiwan
Synopsis
Precise differentiation between MSA subtype is critical in medical intervention and prognosis. The results of previous studies using DTI to differentiate subtypes of MSA is controversial. We use fixel based analysis to examine the tract-specific differences in white matter between individuals with MSA and healthy controls. The results demonstrate the white matter degeneration in specific fibre bundle, including middle cerebellar peduncle, pontine crossing tract and cerebellar white matter tracts in the early MSA-C patients; in contrast, this pattern was not observed in MSA-P patients. This suggests that FBA may be a sensitive marker for early differential diagnosis of MSA subtype.
Introduction
Multiple system atrophy (MSA) is a rare, fatal neurodegenerative disorder with autonomic impairment plus predominantly levodopa-refractory parkinsonism (in the parkinsonian subtype, MSA-P) or cerebellar syndrome (in the cerebellar subtype, MSA-C).1,2 Precise differentiation among two subtypes is challenging because of the overlap both in clinical and histopathological.3,4 Medication strategies and prognosis vary with the subtype of the disease.5,6 Thus, an objective diagnostic biomarker is crucial for disease-modifying therapy. However, previous studies using diffusion tensor imaging for the differentiation of subtype of MSA is debated.7-9Fixel Based analysis (FBA) is a novel framework that provides fibre-specific comparison in the white matter (WM). FBA can be used to analyze distinct fiber populations within a voxel (termed “fixels”).10 FBA is capable of evaluating multiple fibre bundles within a voxel and enables the assessment of both micro-structural (intra-axonal fibre volume, Fibre Density) and macro-structural (fibre bundle width, Fibre Cross-section) changes in the white matter.10
The different pattern of WM degeneration could be observed between subtypes in the earlier stage in patients with MSA.7 Thus, the study aimed to determine the white matter differences by FBA in patients with MSA, especially between MSA-P and MSA-C. Patients with MSA were further divided into the group with long (> 3 years) and short (≦ 3 years) disease duration to examine whether the different pattern of WM degeneration was detected in an earlier stage.
Methods
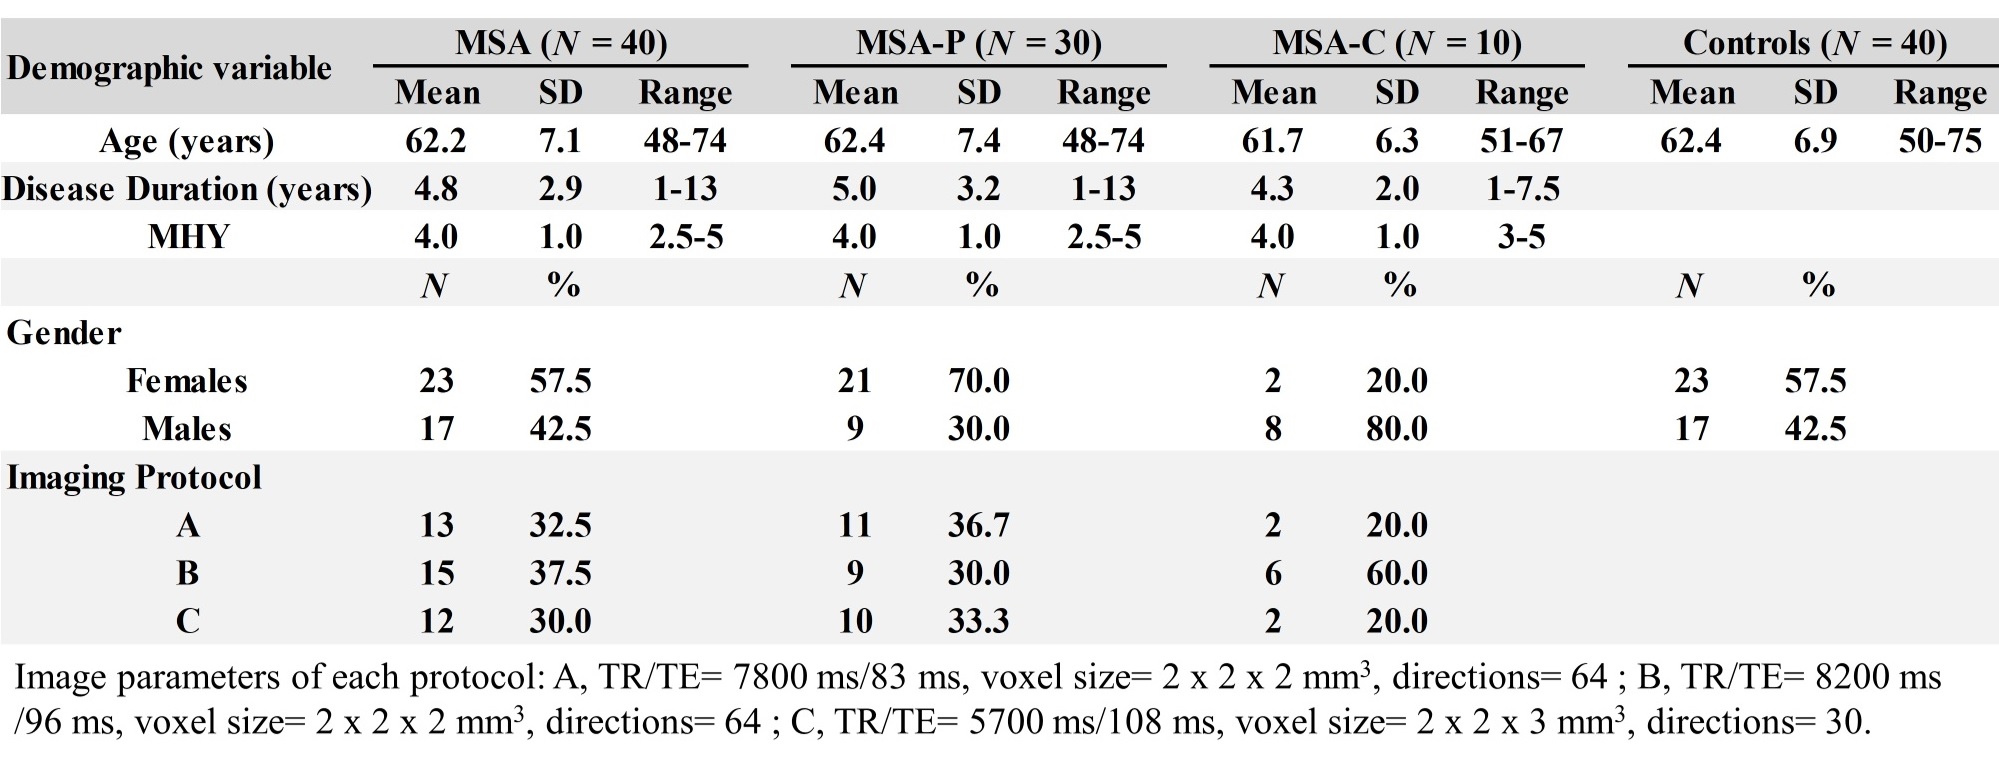
Image AcquisitionImage were acquired from 40 probable MSA patients and 40 age and gender-matched healthy control subjects using a 3T MR scanner (Magnetom Trio, Erlangen, Siemens, Germany). Diffusion-weighted images were acquired with spin-echo echo-planar imaging (SE-EPI) sequence and three different imaging protocols. Forty slices were acquired to cover the brain. Two diffusion weighting values (b-values) – 0 and 1000 sec/mm2- were used in the analysis. A T1-weighted images were acquired with magnetization prepared rapid acquisition gradient echo (T1-MPRAGE) sequence (160 axial slices; voxel size 1 mm x 1 mm x1 mm; TR/TE= 2000 ms/2.63 ms; flip angle= 9°; field of view= 224 mm x 256 mm) was also obtained from each subject. The demographic data and imaging parameters were listed in Table 1.
Fixel Based Analysis
FBA was performed using the MRtrix3 according to recommended procedures.10 Diffusion data underwent preprocessing, including denoising, Gibbs ringing removal, motion and distortion correction, bias field correction.10 A study-specific template was generated, to which all subjects and subsequent image data were registered to. Single-tissue constraint spherical deconvolution (CSD) was used for computing fibre density (FD) and fibre cross-section (FC) with fibre orientation distributions (FODs).11A combined index fibre density and cross-section (FDC) was calculated by multiplying FD and FC.10
Statistical analysis
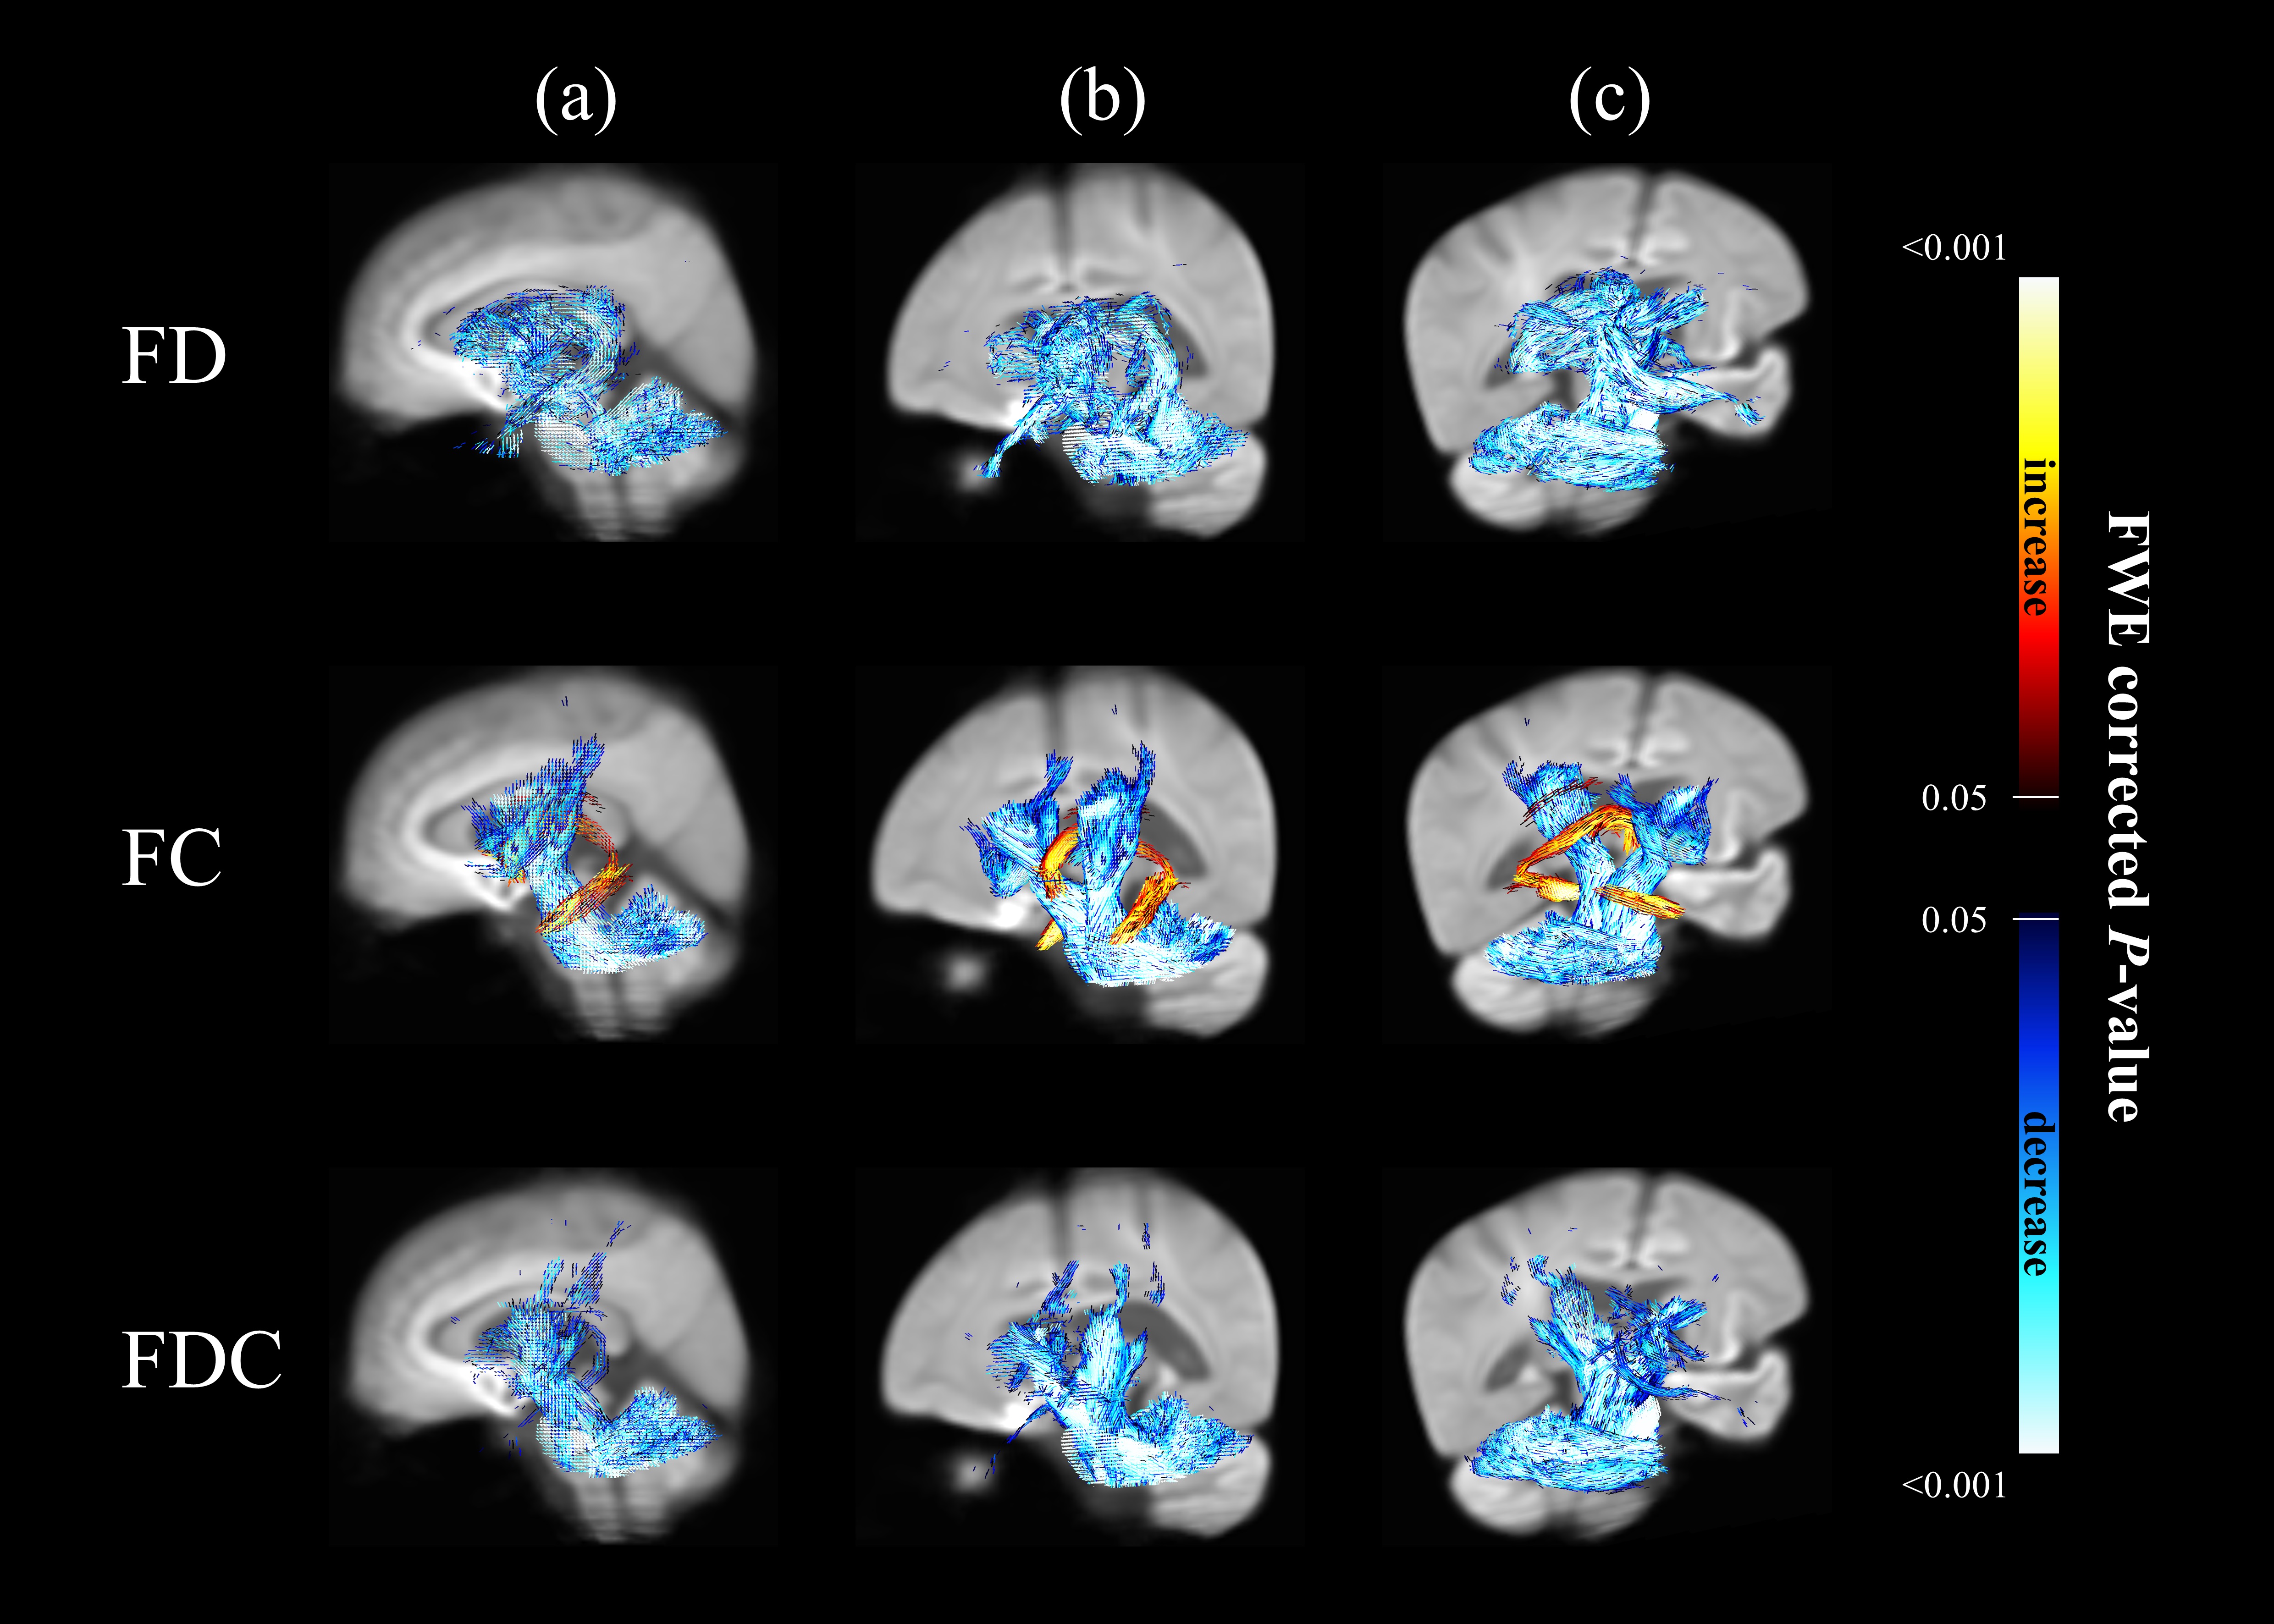
Family-wise error (FWE)-corrected p-values were assigned to each fixel with nonparametric permutation testing and connectivity-based fixel enhancement (CFE).12 Significance was denoted by FWE-corrected p-value < 0.05. To visualize the findings, significant fixels were then displayed using mrview tool in MRtrix3.
Results
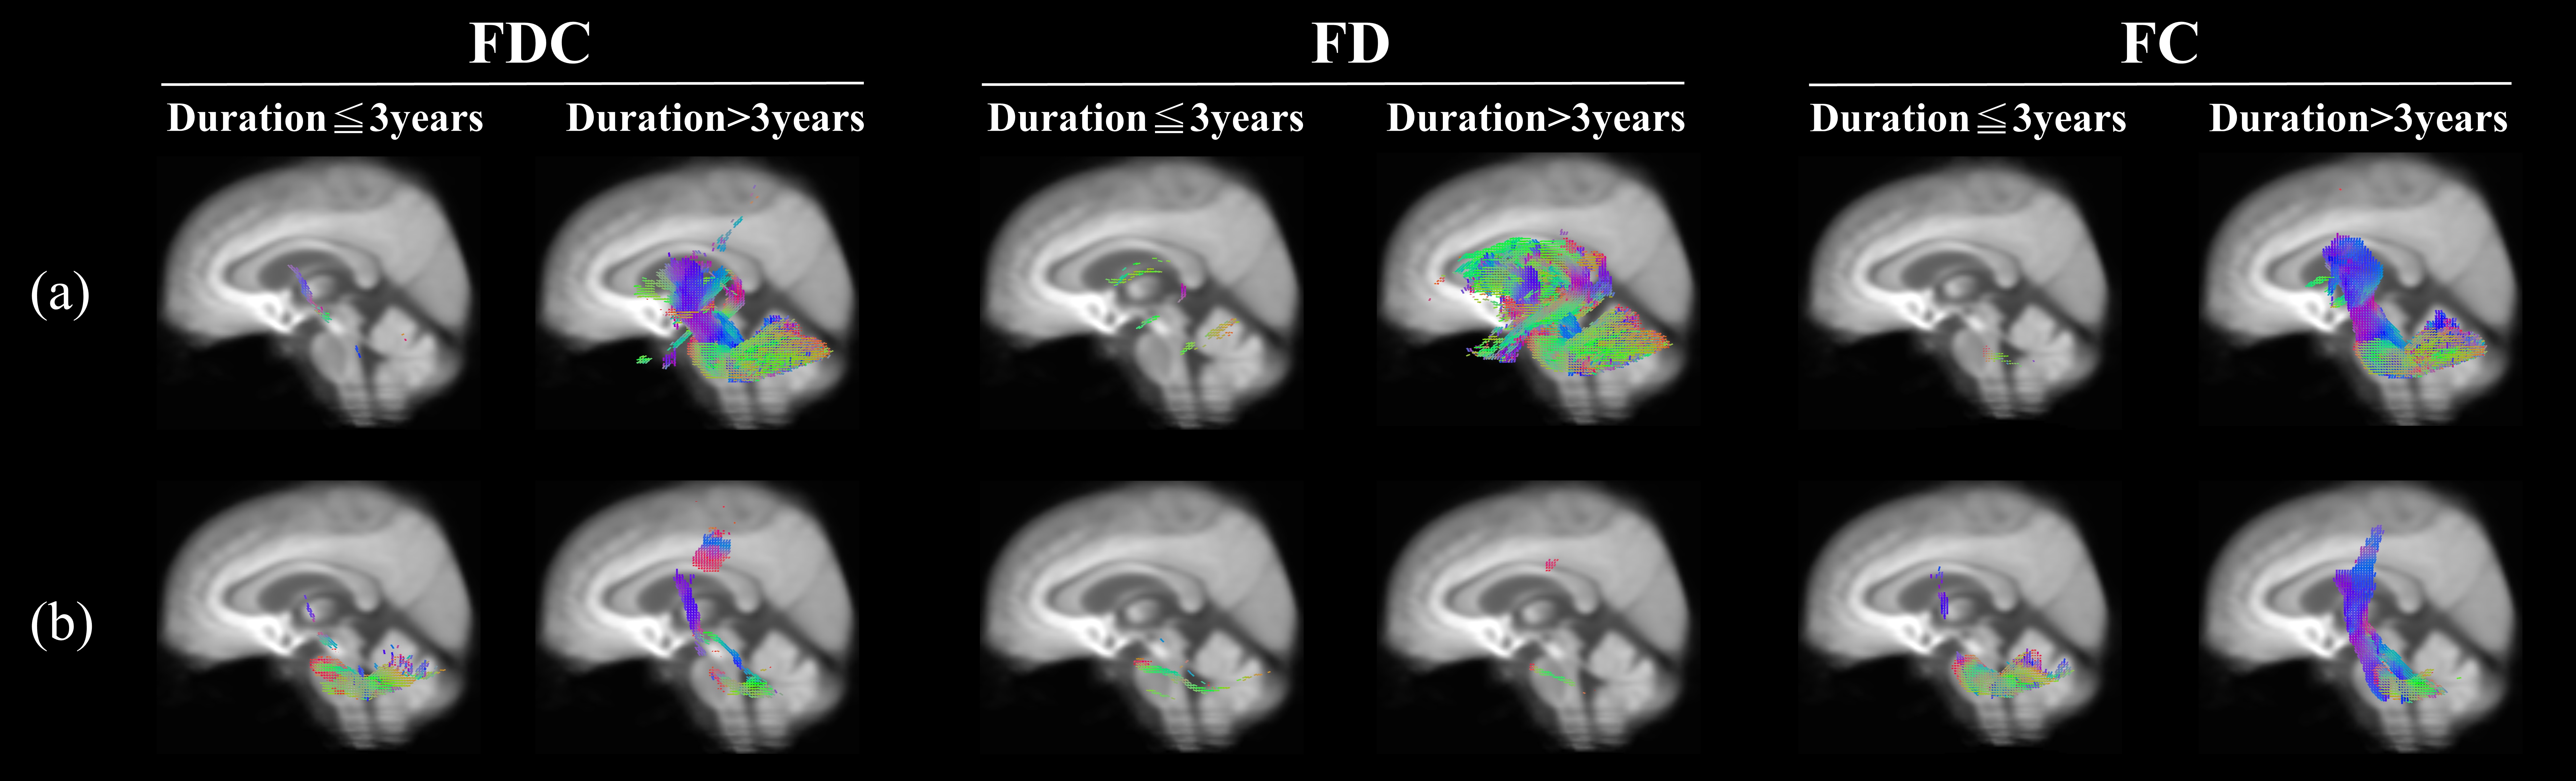
Figure 1 showed significant changes in FD (upper row), FC (middle row) and FDC (lower row) from patients with MSA compared with healthy controls. The main reduction of fixels were identified in the middle cerebellar peduncle, pontine crossing tract, bilateral cerebral peduncle, superior cerebellar peduncle, internal capsule and corticospinal tract. Significant FC increase was identified in the fornix.The difference of white matter degeneration between subtype in patients with disease duration≦3 years and > 3 years was shown in figure 2. In the patients with disease duration≦3 years, FC and FDC of middle cerebellar peduncle, pontine crossing tract and cerebellar white matter tracts were significantly decreased in MSA-C. Furthermore, FD of MSA-P demonstrated extensive FD loss compared to MSA-C in patients with disease duration > 3 years.
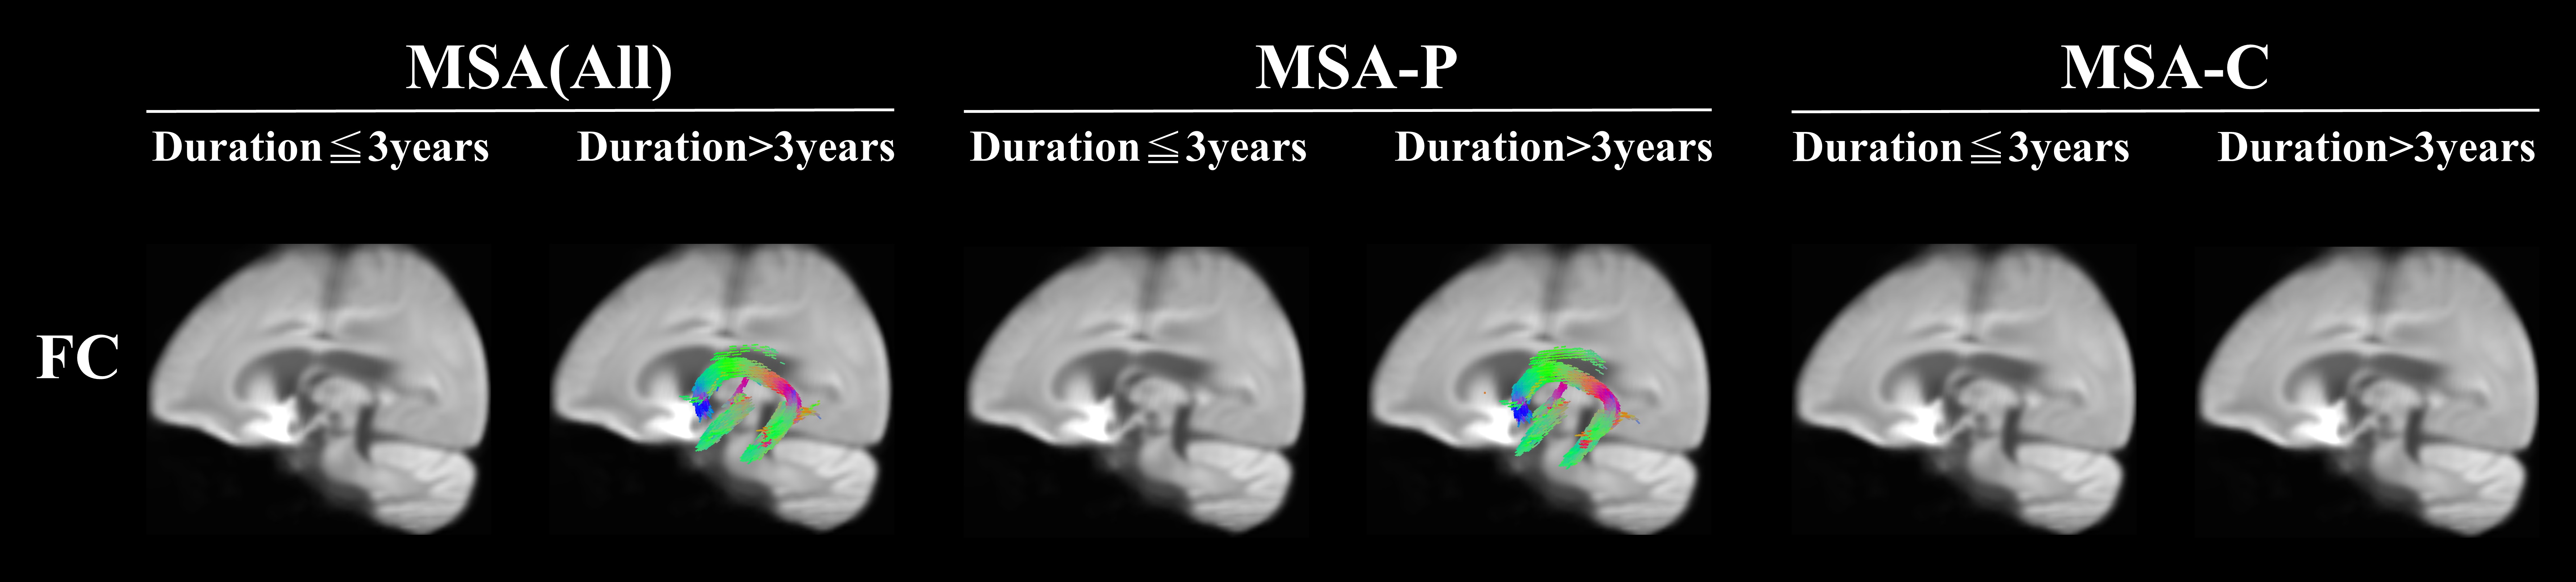
The Difference of white matter between subtype in FC was represented in figure 3. No difference was observed in all three groups of MSA patients with disease duration ≦3 years; however, fixels of fornix were significantly increased in the group of MSA(All) and MSA-P with disease duration > 3 years.
Discussion
Our results demonstrate distinct pattern of white matter degeneration between MSA subtypes. The regions of fixels with significant change were congruent with the locations of white matter lesion reported by DTI literature.13-15 In early MSA, MSA-C was detected to have more WM involvement in comparison to MSA-P. This result endorse previous DTI findings.7To our surprise, the FC of fornix was significantly increased compared to healthy controls. This phenomenon accompany with disease progression and exist only in MSA-P subtype. Previous literature16 indicates other cell death mechanisms besides apoptosis might responsible for neuronal death in MSA. Previous study report necroptosis, which is a regulated necrosis and characterized by cell swelling, play an important role in pathogenesis of Parkinson’s disease17. Since both MSA and Parkinson’s Disease are classified as “α-Synucleinopathies”.18 The increase of fibre bundle width of fornix might owing to the necroptosis-induced cell swelling. Widespread FD loss together with significant FC increase in fornix, which exclusive exist in late MSA-P suggest the possibility of worse survival in MSA-P as reported by previous literature.2,5
Conclusion
Our findings indicate FBA may serve as a biomarker for early differential diagnosis of MSA. It can potentially aid in treatment efficacy, and consequently increased quality of life of patients.Acknowledgements
No acknowledgement found.References
1. Wenning GK, Tison F, Ben Shlomo Y, et al. Multiple system atrophy: a review of 203 pathologically proven cases. Mov Disord. 1997;12(2):133-147.
2. Gilman S, Wenning GK, Low PA, et al. Second consensus statement on the diagnosis of multiple system atrophy. Neurology. 2008;71(9):670-676.
3. Roncevic D, Palma JA, Martinez J, et al. Cerebellar and parkinsonian phenotypes in multiple system atrophy: similarities, differences and survival. J Neural Transm. 2014;121(5):507-512.
4. Watanabe H, Riku Y, Hara K, et al. Clinical and Imaging Features of Multiple System Atrophy: Challenges for an Early and Clinically Definitive Diagnosis. J Mov Disord. 2018;11(3):107-120.
5. Wenning GK, Geser F, Krismer F, et al. European Multiple System Atrophy Study Group. The natural history of multiple system atrophy: a prospective European cohort study. Lancet Neurol. 2013;12(3):264-274.
6. Chelban V, Catereniuc D, Aftene D, et al. An update on MSA: premotor and non-motor features open a window of opportunities for early diagnosis and intervention. J Neurol. 2020;267(9):2754-2770.
7. Dash SK, Stezin A, Takalkar T, George L, Kamble NL, Netravathi M, Yadav R, Kumar KJ, Ingalhalikar M, Saini J, Pal PK. Abnormalities of white and grey matter in early multiple system atrophy: comparison of parkinsonian and cerebellar variants. Eur Radiol. 2019;29(2):716-724.
8. Li J, Donglin Z, Chaoyong X, et al. Tract based spatial statistics in multiple system atrophy: A comparison between clinical subtypes. Parkinsonism & Related Disorders. 2014;20(10):1050-1055.
9. Rulseh AM, Keller J, Rusz J, et al. Diffusion tensor imaging in the characterization of multiple system atrophy. Neuropsychiatr Dis Treat. 2016;26(12):2181-2187.
10. Raffelt DA, Tournier JD, Smith RE, et al. Investigating white matter fibre density and morphology using fixel-based analysis. Neuroimage. 2017;144(Pt A):58-73.
11. Raffelt D, Tournier JD, Rose S, et al. Apparent Fibre Density: a novel measure for the analysis of diffusion-weighted magnetic resonance images. Neuroimage. 2012;59(4):3976-3994.
12. Raffelt DA, Smith RE, Ridgway GR, et al. Connectivity-based fixel enhancement: Whole-brain statistical analysis of diffusion MRI measures in the presence of crossing fibres. Neuroimage. 2015;15(117):40-55.
13. Oishi K, Konishi J, Mori S, et al. Reduced fractional anisotropy in early-stage cerebellar variant of multiple system atrophy. J Neuroimaging. 2009;19:127–131.
14. Wang PS, Wu HM, Lin CP, et al. Use of diffusion tensor imaging to identify similarities and differences between cerebellar and Parkinsonism forms of multiple system atrophy. Neuroradiology. 2011;53:471–481.
15. Wang PS, Yeh CL, Lu CF, et al. The involvement of supratentorial white matter in multiple system atrophy: a diffusion tensor imaging tractography study. Acta Neurol Belg. 2016;117:213–220.
16. Probst-Cousin S, Rickert CH, Schmid KW, et al. Cell death mechanisms in multiple system atrophy. J Neuropathol Exp Neurol. 1998;57(9):814-821.
17. Wu JR, Wang J, Zhou SK, et al. Necrostatin-1 protection of dopaminergic neurons. Neural Regen Res. 2015;10(7):1120-1124.
18. Wakabayashi K, Yoshimoto M, Tsuji S, et al. Alpha-synuclein immunoreactivity in glial cytoplasmic inclusions in multiple system atrophy. Neurosci Lett. 1998;249(2-3):180-182.
Figures