3016
Substantia Nigra Neuromelanin-sensitive Imaging Biomarker to Differentiate Between Atypical Parkinsonian Syndromes1CENIR, ICM Paris, Paris, France, 2Paris Brain Institute (ICM), Sorbonne University, UPMC Univ Paris 06, Inserm U1127, CNRS UMR 7225, Paris, France, 3ICM Team “Movement Investigations and Therapeutics” (MOV’IT), Paris, France, 4Department of Neuroradiology, Pitié-Salpêtrière Hospital, AP-HP, Paris, France, 5Department of Neurology, APHP, Pitié-Salpêtrière Hospital, Paris, France
Synopsis
Atypical Parkinsonian disorders are progressive neurodegenerative diseases characterized clinically by parkinsonism, associated with degeneration of dopaminergic neurons in the substantia nigra pars compacta (SNc). Histological studies suggested that dopaminergic cell neurodegeneration pattern may differ between atypical Parkinsonian disorders and with Parkinson’s disease.
In this study, we aimed to quantify and compare SNc volume and signal intensity using neuromelanin-sensitive T1-weighted MRI between progressive supranuclear palsy, multiple system atrophy, corticobasal degeneration, dementia with Lewy body and sporadic Parkinson’s disease.
INTRODUCTION
Parkinson’s disease (PD) is characterized pathologically by progressive loss of dopaminergic neurons in the substantia nigra pars compacta (SNc)1-4. Atypical Parkinsonian disorders are progressive neurodegenerative diseases, characterized clinically with symptoms including Parkinsonism and other atypical clinical signs. Progressive supranuclear palsy (PSP), corticobasal degeneration (CBD), multiple system atrophy (MSA), with its cerebellar (MSAc) and Parkinsonian (MSAp) subtypes, and dementia with Lewy body (DLB) constitute different entities of atypical parkinsonism5.The dopaminergic neurons contain neuromelanin pigment in the SNc that can be imaged using neuromelanin-sensitive T1-weighted MRI and have been effectual in detecting SNc neurodegeneration showing diminution in several atypical parkinsonism6,7.
In this study, we aimed to discriminate different patterns of SNc neurodegeneration in various types of Parkinsonian syndromes using neuromelanin-sensitive imaging.
MATERIALS AND METHODS
Parkinsonian syndrome patients and healthy volunteers were analyzed. These subjects had a diagnostic doubt and underwent MRI scanning in this context. Subjects were scanned in clinical conditions for diagnostic purposes at the department of Neuroradiology of the Salpetriere hospital (Paris, France) using a 3T Skyra (Siemens, Germany) and a 64-channel head coil for signal reception. The standardized protocol included a three-dimensional T1-weighted gradient-recalled echo sequence (Magnetization-prepared rapid acquisition with gradient-recalled echo, MPRAGE, or Spoiled Gradient Recalled Acquisition in Steady State, SPGR) and neuromelanin-sensitive images acquired using a T1-weighted two-dimensional axial TSE protocol with TR/TE=890 ms/13 ms, 3 averages, and voxel size: 0.4x0.4x3 mm3.SNc regions of interest (ROI) were manually drawn as the border of the hyperintense area dorsal to the cerebral peduncle and ventral to the red nucleus by a radiologist blinded to the status (patient or HV) of the subject on the neuromelanin-sensitive images using the FreeSurfer viewer similar to the previous study8. We also manually traced a background region comprising the tegmentum and superior cerebral peduncles (Figure 1). SNc volumes, signal-to-noise ratio (SNR), and contrast-to-noise ratio (CNR) were calculated by normalizing the mean signal in SNc relative to the background signal8.
Quantitative data were analyzed using non-parametric statistics such as the Kruskal-Wallis test among the groups (PD, PSP, MSAc, MSAp, DLB, CBD, HV) and the Mann-Whitney U test for the post-hoc two-group comparisons. The significance level in all statistical tests was set to 0.05. Inter and intra-observer variability was estimated using Dice-coefficient.
RESULTS AND DISCUSSION
Ninety-four patients comprising 39 PD, 23 PSP, 6 MSA, 5 MSAc, 9 MSAp, 8 DLB and 4 CBD were compared to 22 healthy volunteers (HV) (Table 1, Table 2).Volume: SNc volume for patients significantly differed compared to the HV (Kruskal-Wallis test p<0.001). For SNc volume, PD patients showed a highly significant difference with respect to the HV (p<0.001) and PSP (p=0.005) and close to significance with respect to DLB (p=0.07) and with respect to MSAp (p=0.07). For SNc volume in PSP patients, there was also a significant difference compared to HV (p<0.001), compared to MSAp (p=0.005), and compared to CBD (p=0.01). PSP patients had the lowest mean SNc volume followed by MSAc, MSA, PD, CBD, MSAp, and DLB with respect to HV (Figure 2).
SNR: SNR also significantly differed for all groups compared to the HV (Kruskal-Wallis test p<0.001) where PD patients demonstrated significant difference with respect to the HV (p<0.001) and with respect to DLB (p=0.04) whereas PSP patients significantly differed from the HV (p=0.02), MSAc (p=0.01) and CBD (p=0.01). PSP patients had the lowest SNR compared to the other groups and were significantly different from PD (p = 0.01) (Figure 3).
CNR: Similarly, we found a significant difference in CNR for patients as compared to the HV (Kruskal-Wallis test p<0.001) where PD patients showed highly significant difference compared to HV (p<0.001) and compared to PSP (p<0.001) while showing close to significance for DLB (p=0.07). PSP patients demonstrated a significant difference compared to HV, (p<0.001), compared to MSAp (p=0.04), and compared to CBD (p=0.01) and had the lowest values than other groups for CNR as well (Figure 4).
There was a high reproducibility between the manual segmentations performed by the radiologist (DICE co-efficient: 0.85).
CONCLUSION
A decrease in SNc volume and signal intensity was observed in all Parkinsonian syndromes that predominated in PSP. Hence, neuromelanin-sensitive imaging of the SNc could provide useful biomarkers for clinical practice. The spatial pattern of neuromelanin changes in the SNc will be further studied.Acknowledgements
Rahul Gaurav and Emina Arsovic contributed equally to the manuscript.
This study was funded by grants from the ANR Nucleipark, DHOS-Inserm, France Parkinson, École des NeuroSciences de Paris (ENP), Fondation pour la Recherche Médicale (FRM). The authors would like to thank the participants in the study.
References
1. Poewe W, Seppi K, Tanner CM, et al. Parkinson disease. Nat. Rev. Dis. Prim. 2017;3:1–21.
2. Kish SJ, Shannak K, Hornykiewicz O. Uneven Pattern of Dopamine Loss in the Striatum of Patients with Idiopathic Parkinson’s Disease. N. Engl. J. Med. 1988;318(14):876–880.
3. Fearnley JM, Lees AJ. Ageing and parkinson’s disease: Substantia nigra regional selectivity. Brain 1991;114(5):2283–2301.
4. Hornykiewicz O. Biochemical aspects of Parkinson’s disease. Neurology 1998;51(2 SUPPL.):S2-9.
5. Dickson, Dennis W. "Parkinson’s disease and parkinsonism: neuropathology." Cold Spring Harbor perspectives in medicine 2.8 (2012): a009258.
6. Sulzer D, Cassidy C, Horga G, et al. Neuromelanin detection by magnetic resonance imaging (MRI) and its promise as a biomarker for Parkinson’s disease [Internet]. npj Park. Dis. 2018;4(1):11.Available from: http://www.nature.com/articles/s41531-018-0047-3
7. Sasaki M, Shibata E, Tohyama K, et al. Neuromelanin magnetic resonance imaging of locus ceruleus and substantia nigra in Parkinson’s disease. Neuroreport 2006;17(11):1215–1218.
8. Pyatigorskaya N, Magnin B, Mongin M, et al. Comparative study of MRI biomarkers in the substantia nigra to discriminate idiopathic Parkinson disease. Am. J. Neuroradiol. 2018;39(8):1460–1467.
Figures
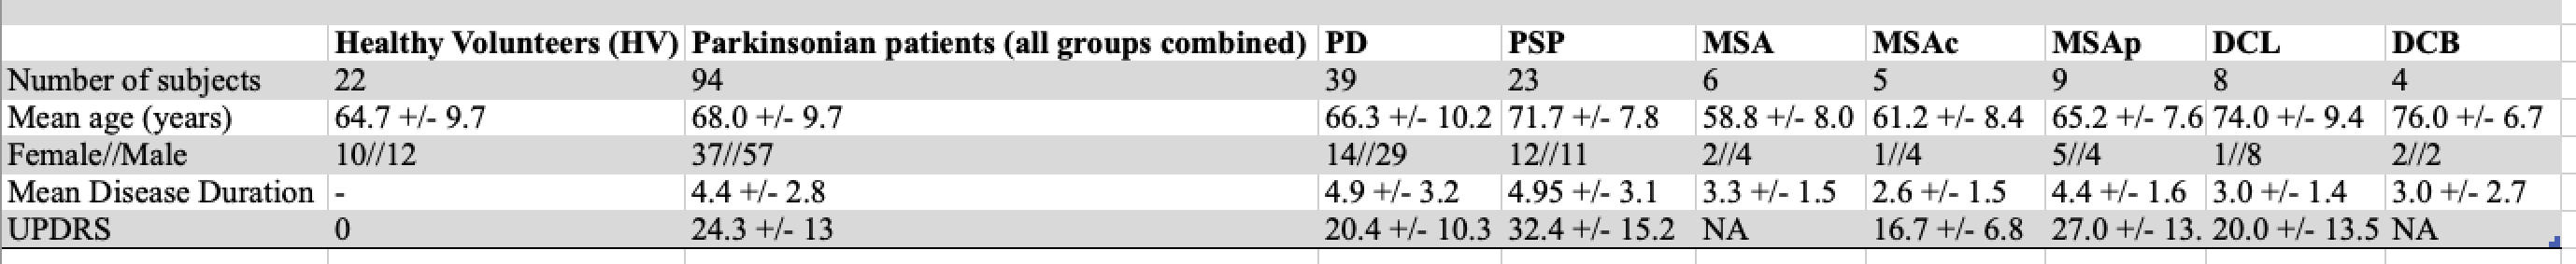
Table 1: Demographic and clinical characteristics. PD is Parkinson's Disease, PSP is Progressive supranuclear palsy, DCB is CorticoBasal Degeneration, MSA is Multiple System Atrophy, with its cerebellar (MSAc) and Parkinsonian (MSAp) subtypes, and DCL is dementia with Lewy body.
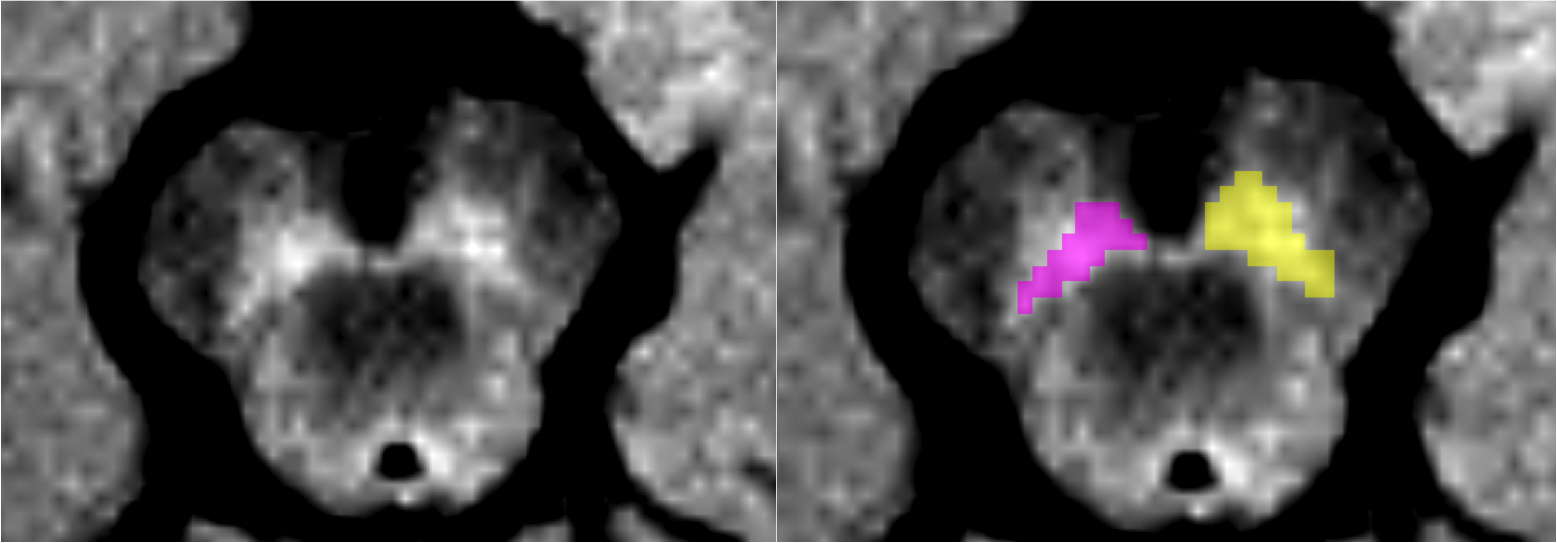

Table 2: Substantia nigra pars compacta measurements. HV is Healthy Volunteers, PD is Parkinson's Disease, PSP is Progressive supranuclear palsy, DCB is CorticoBasal Degeneration, MSA is Multiple System Atrophy, with its cerebellar (MSAc) and Parkinsonian (MSAp) subtypes, and DCL is dementia with Lewy body.
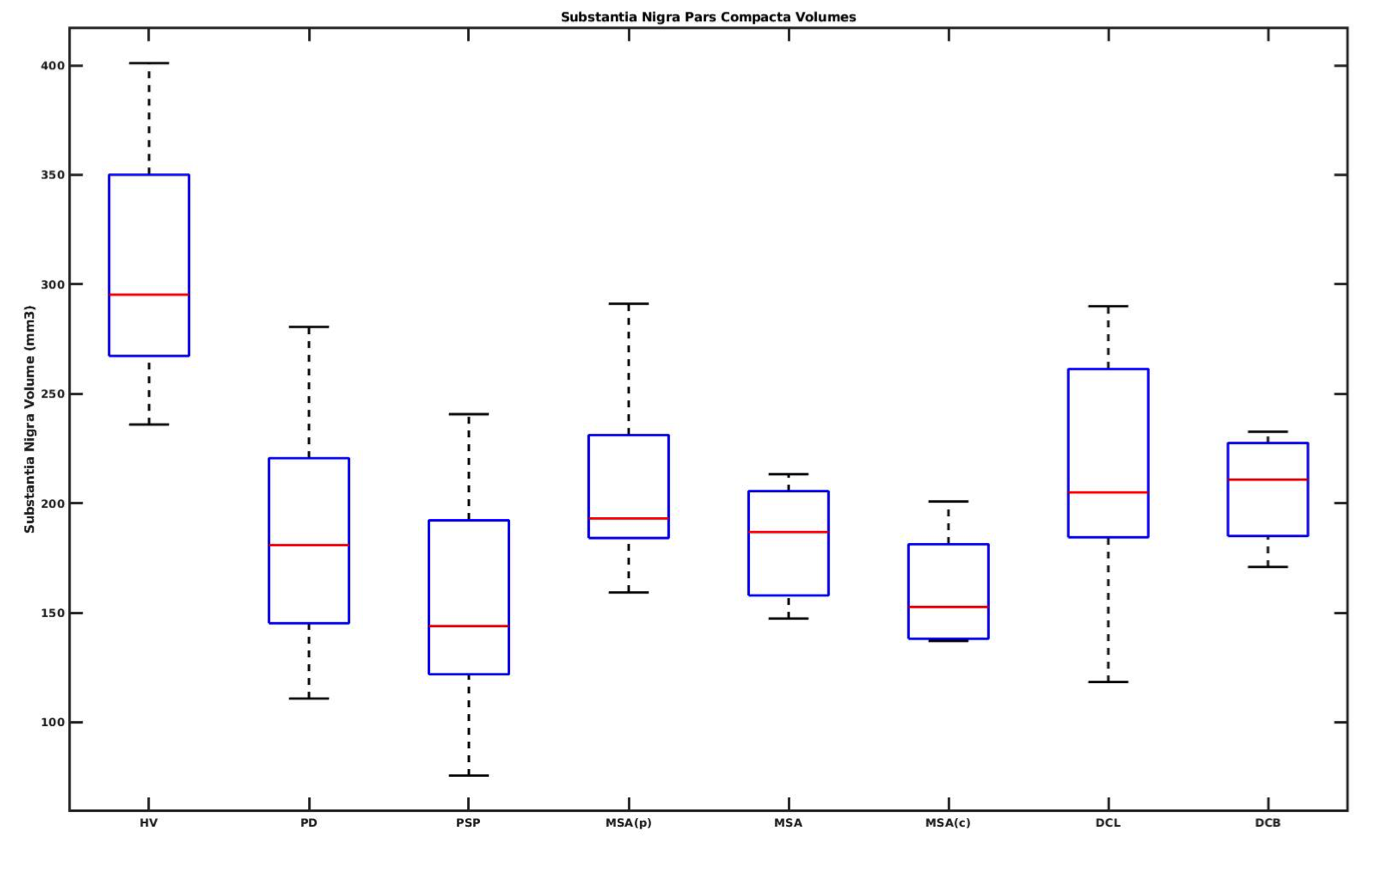
Figure 2: Box plot of Substantia Nigra pars compacta volume in Atypical Parkinsonian along with healthy volunteers. HV is Healthy Volunteers, PD is Parkinson's Disease, PSP is Progressive supranuclear palsy, DCB is CorticoBasal Degeneration, MSA is Multiple System Atrophy, with its cerebellar (MSAc) and Parkinsonian (MSAp) subtypes, and DCL is dementia with Lewy body.
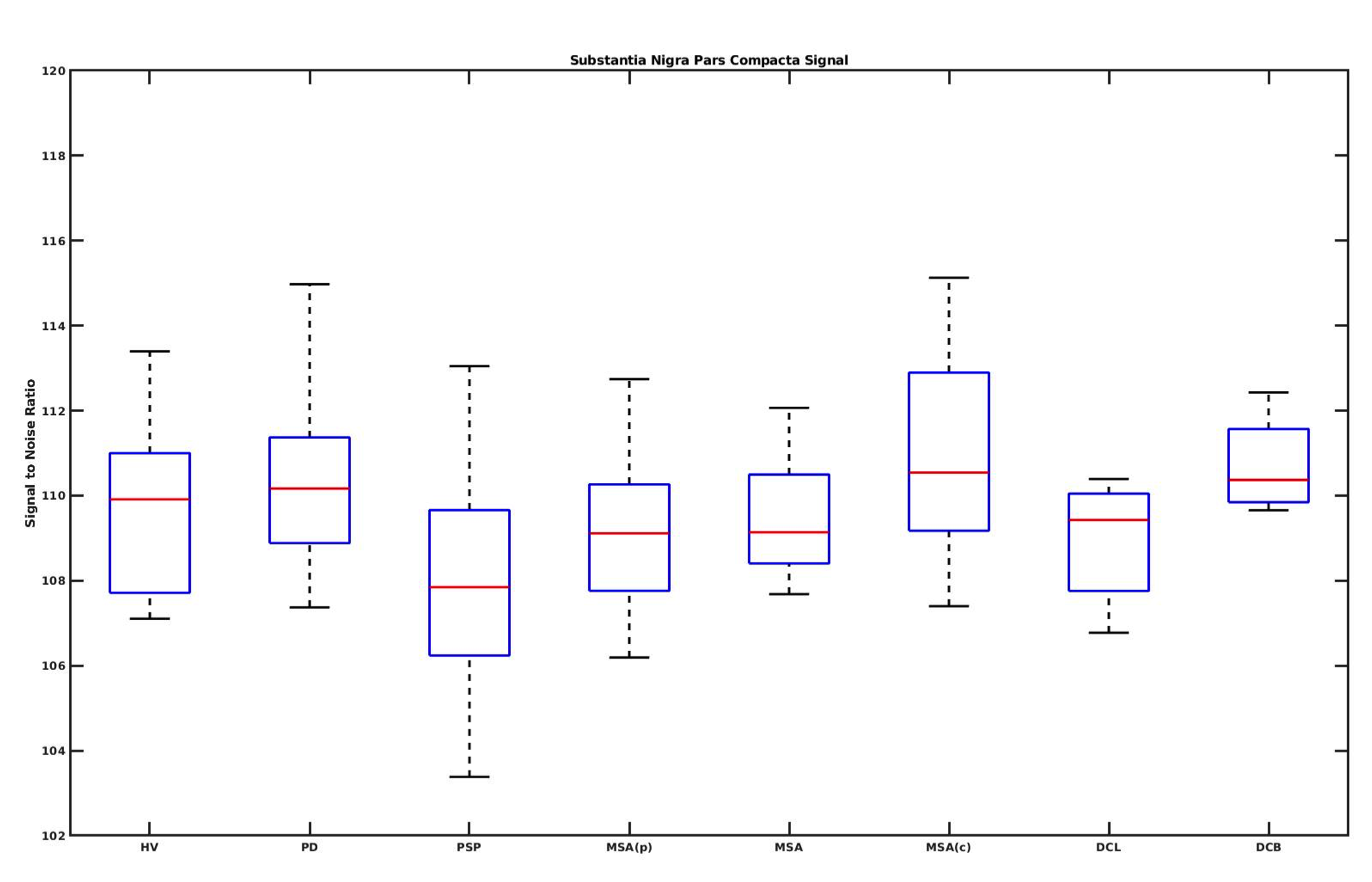
Figure 3: Box plot of SNc signal to noise ratio variations in Atypical Parkinsonian along with healthy volunteers. HV is Healthy Volunteers, PD is Parkinson's Disease, PSP is Progressive supranuclear palsy, DCB is CorticoBasal Degeneration, MSA is Multiple System Atrophy, with its cerebellar (MSAc) and Parkinsonian (MSAp) subtypes, and DCL is dementia with Lewy body.
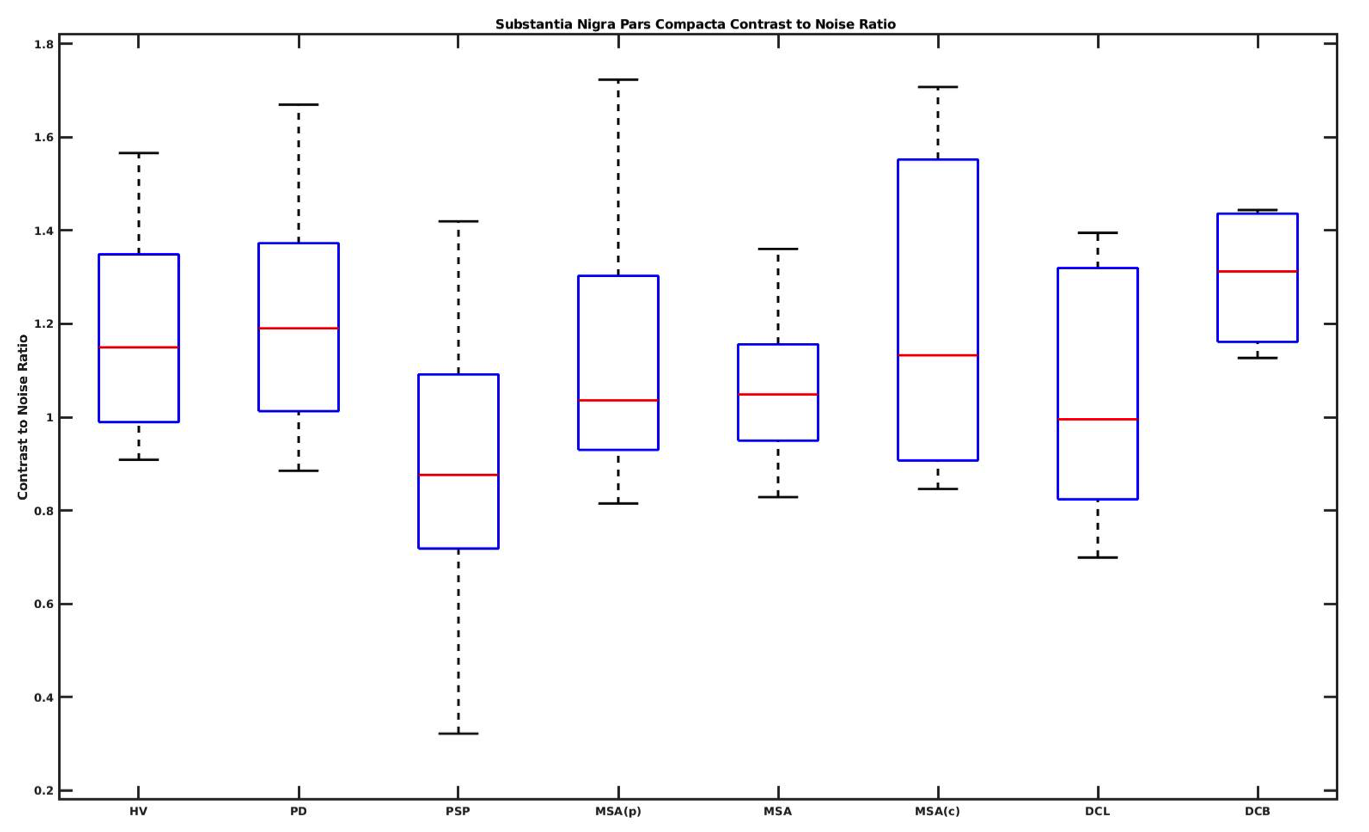
Figure 4: Box plot of SNc contrast to noise ratio variations in Atypical Parkinsonian along with healthy volunteers. HV is Healthy Volunteers, PD is Parkinson's Disease, PSP is Progressive supranuclear palsy, DCB is CorticoBasal Degeneration, MSA is Multiple System Atrophy, with its cerebellar (MSAc) and Parkinsonian (MSAp) subtypes, and DCL is dementia with Lewy body.