3013
Automatic Detection of the Neuromelanin, Substantia Nigra, Red Nucleus and Subthalamic Nucleus using a High Resolution Brain Template1Magnetic Resonance Innovations, Inc., Bingham Farms, MI, United States, 2Department of Radiology, Wayne State University, Detroit, MI, United States, 3Department of Radiology, Ruijin Hospital, Shanghai Jiao Tong University School of Medicine, Shanghai, China, 4Department of Biomedical Engineering, Wayne State University, Detroit, MI, United States, 5Department of Neurology, Wayne State University, Detroit, MI, United States
Synopsis
A total of 37 healthy controls (HC) were used to create a template which was then used to automatically detect neuromelanin, substantia nigra, red nucleus and subthalamic nucleus in the midbrain. In order to evaluate the performance of the template, regions of interest (ROIs) were drawn manually on the MTC and QSM images. DICE similarity coefficients and volume ratios of the template to manual data were calculated for different thresholds for each structure. These showed promising results, validating the performance of the template.
Introduction
Parkinson’s disease (PD) is a chronic progressive neurodegenerative disorder affecting approximately 1% of individuals over 60 years of age1. It is characterized pathologically by early neurodegeneration of neuromelanin (NM) in the substantia nigra pars compacta (SNpc) and increased iron deposition in the overall substantia nigra (SN).2,3 Therefore, being able to visualize and quantify the NM and iron content is key to mapping out changes in the SN as a function of age or disease. In this study, we looked to create NM, SN, RN and STN templates using high resolution imaging from a single multi-echo NM-MRI sequence.Methods
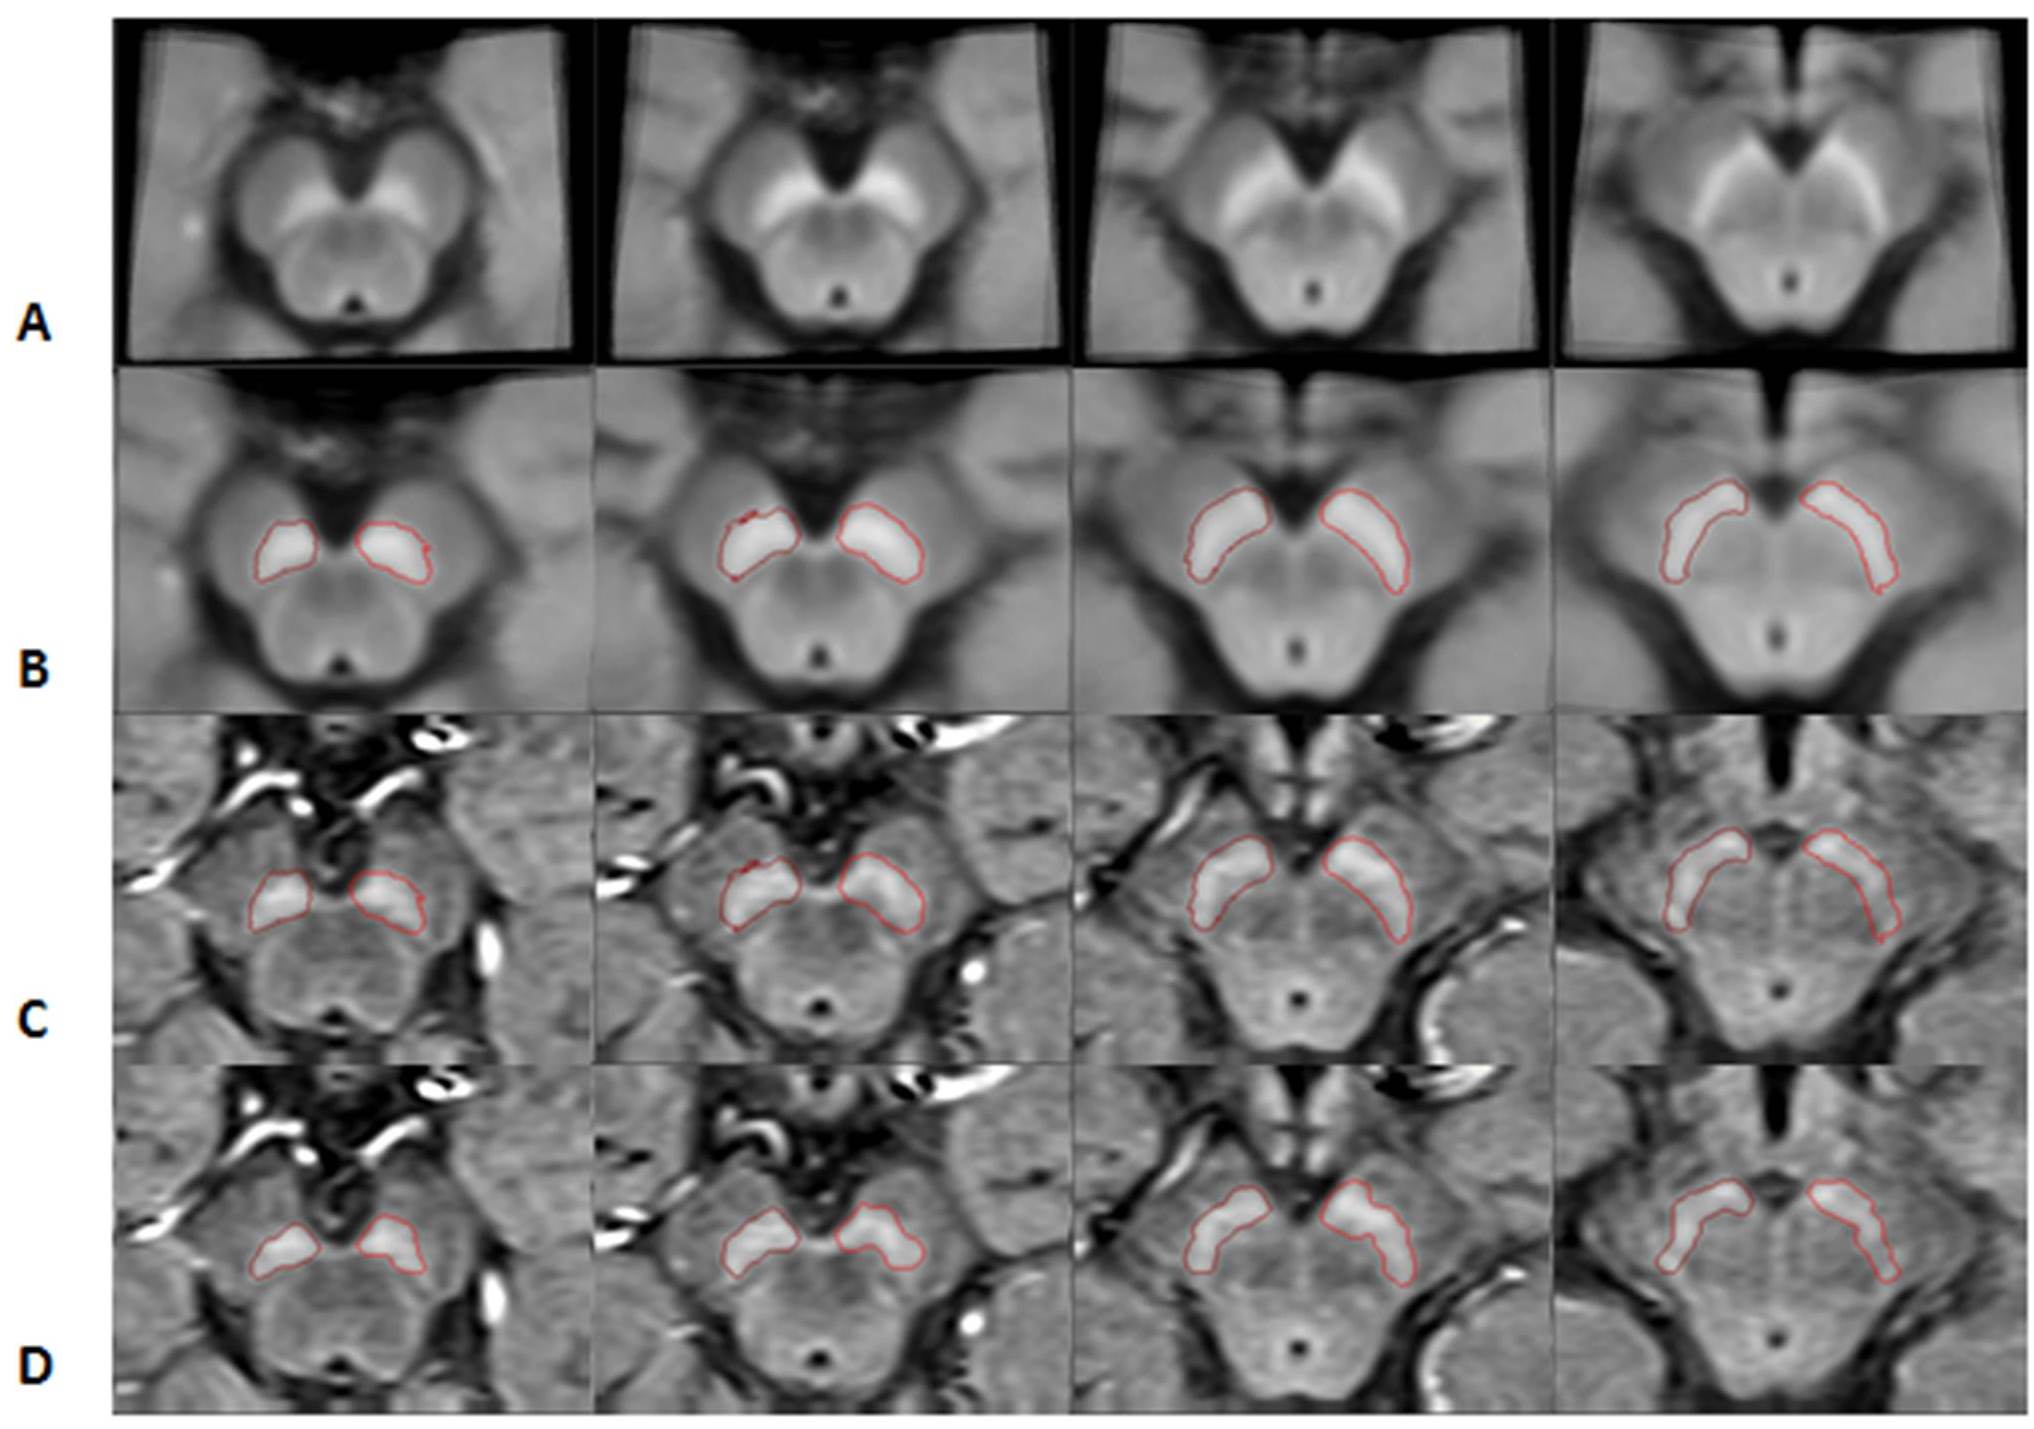
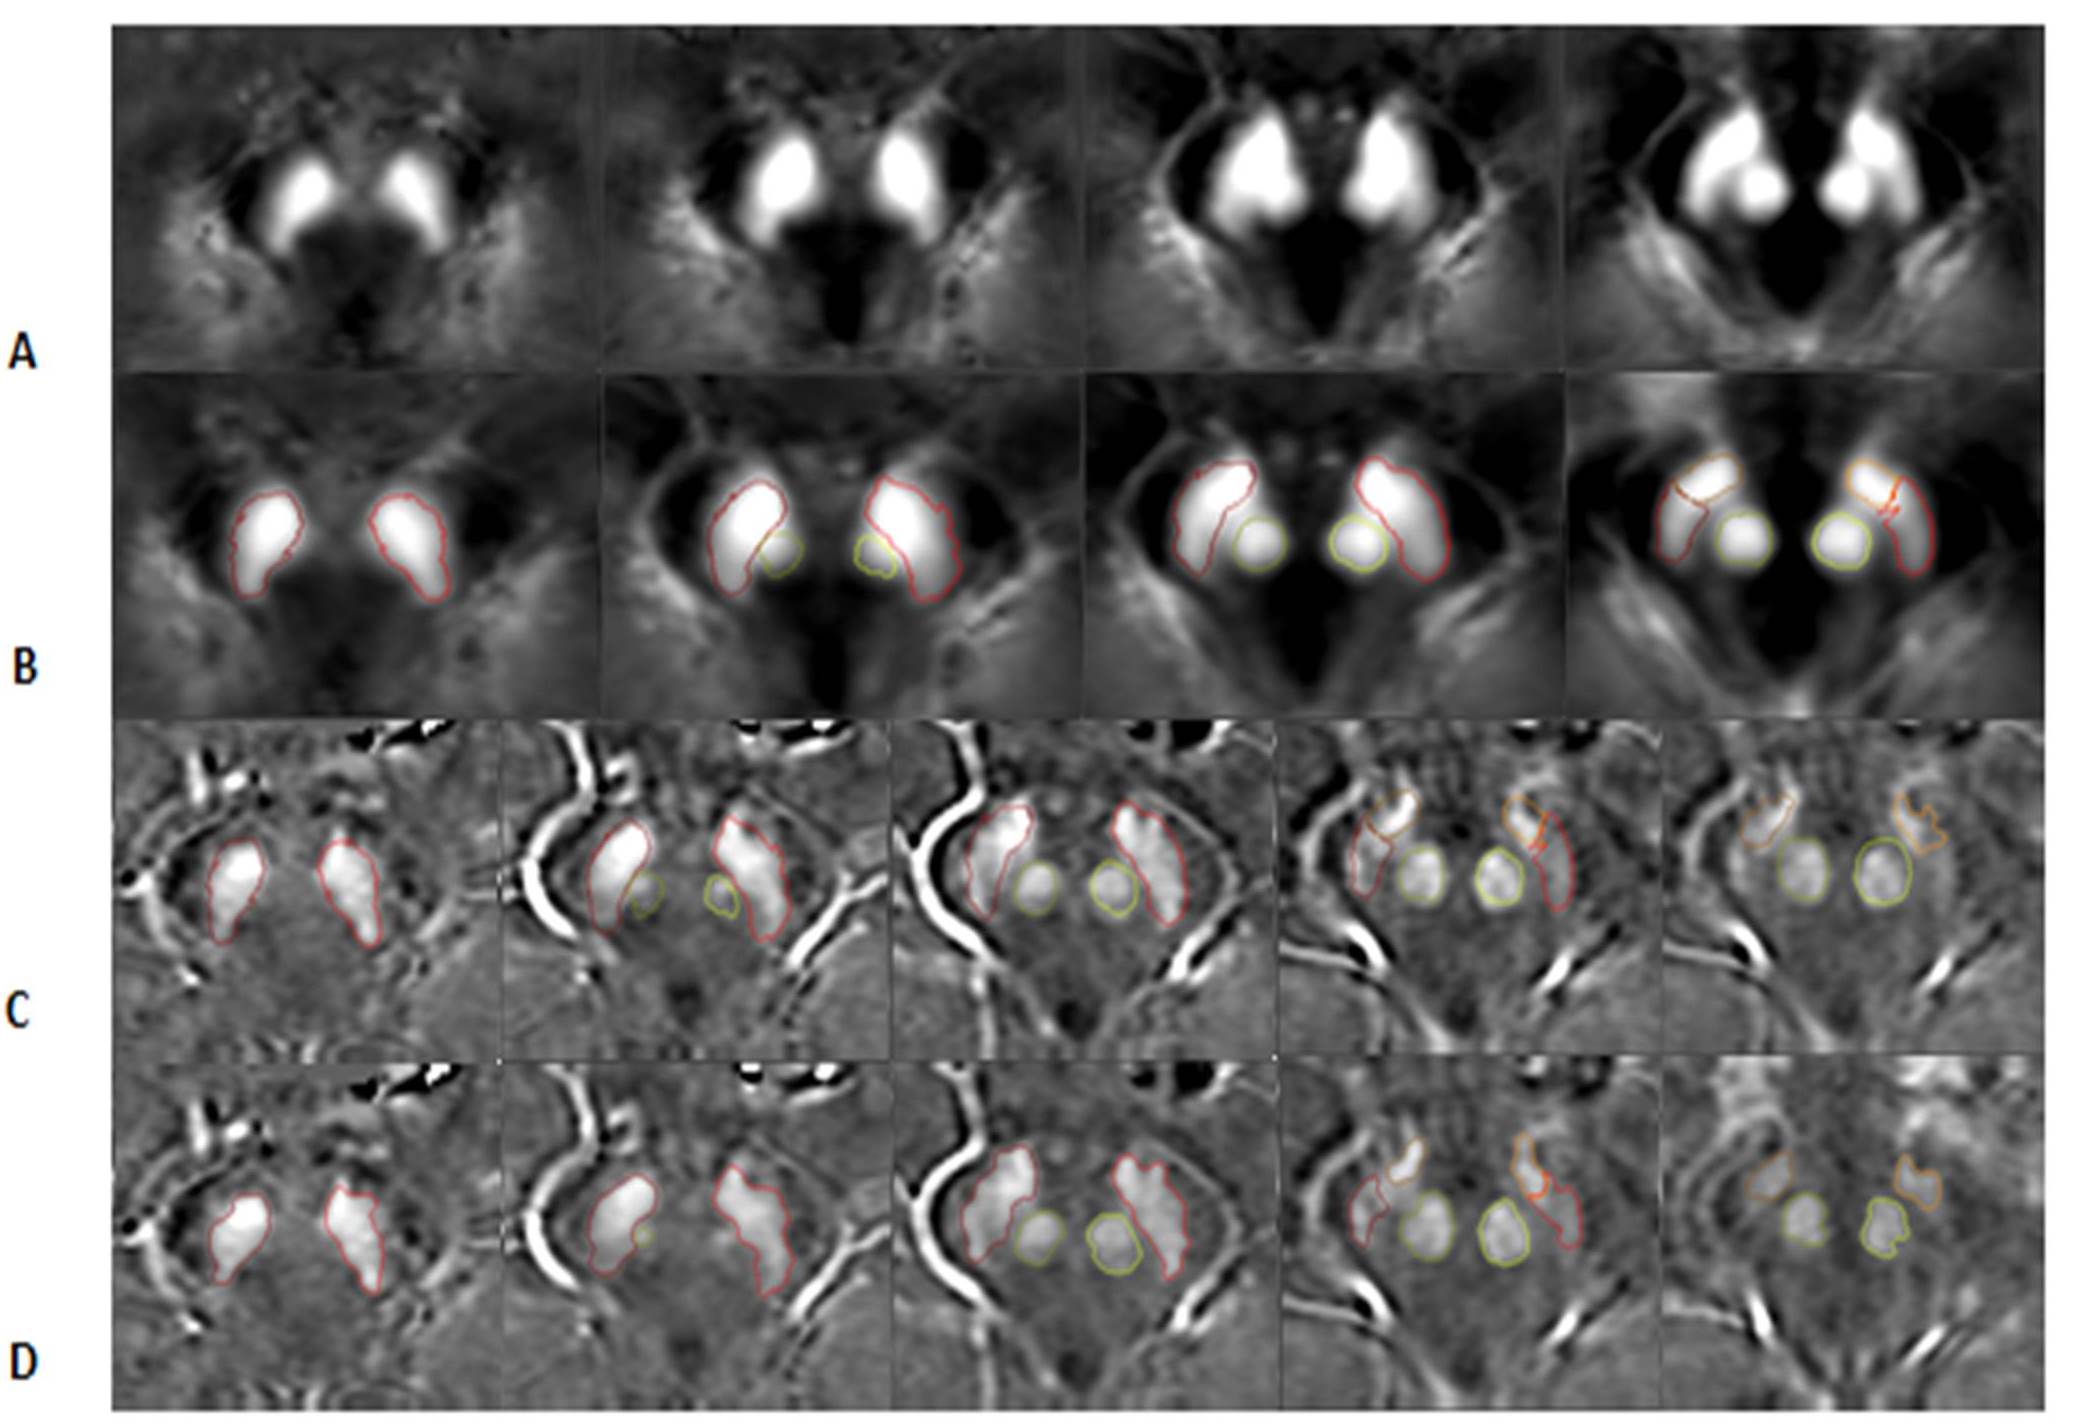
A total of 37 healthy controls (age range 65.8 ± 7.6 years old, including 19 males and 18 females) were imaged on a 3T Philips scanner using a 3D multi-echo gradient echo SWI sequence with an activated MTC pulse. The imaging parameters included: seven echoes with TE1 = 7.5ms, ΔTE = 7.5ms with a total of 7 echoes, TR = 62ms, flip angle = 30˚, pixel bandwidth = 174Hz/pixel, matrix size = 384 × 144, slice thickness = 2mm, slice number = 64, spatial in-plane resolution = 0.67 × 1.34mm2 interpolated to 0.167 × 0.167mm2 and a total scan time of 4min,47s. The first echo of the MTC-SWI magnitude image (TE = 7.5ms) was used to delineate the NM content since that provided the key MT contrast. The second echo (TE = 15ms) was used for QSM reconstruction. In order to create the midbrain template, all the images were zoomed in-plane by a factor of four and mapped to one of the high-quality cases which was chosen as our template. For both QSM and MTC data, we cropped the data to 16 slices around the midbrain territory and then performed a second local template mapping to the reference case. Then, the data was interpolated in the slice select direction to create a template with 0.167 isotropic resolution resulting into the final template. The boundaries were initially drawn manually in the template space for each of the structures and the DPA was run to finalize the template boundaries.4,5 These boundaries were then mapped back to the original space where DPA was run once again to provide the final boundaries, making this a fully automated process. For the manual drawings, DPA was also run making the final boundary determination semi-automatic. From these boundaries, the volumes, signal intensities, susceptibility, and any other desired measure that is available in the data can be calculated. In order to evaluate the performance of the template, we used the DICE similarity coefficient, which shows the spatial overlap between the structures associated with the two segmentation methods and the volume ratio (VR) of the structure from the template over that of the manual segmentation.Results
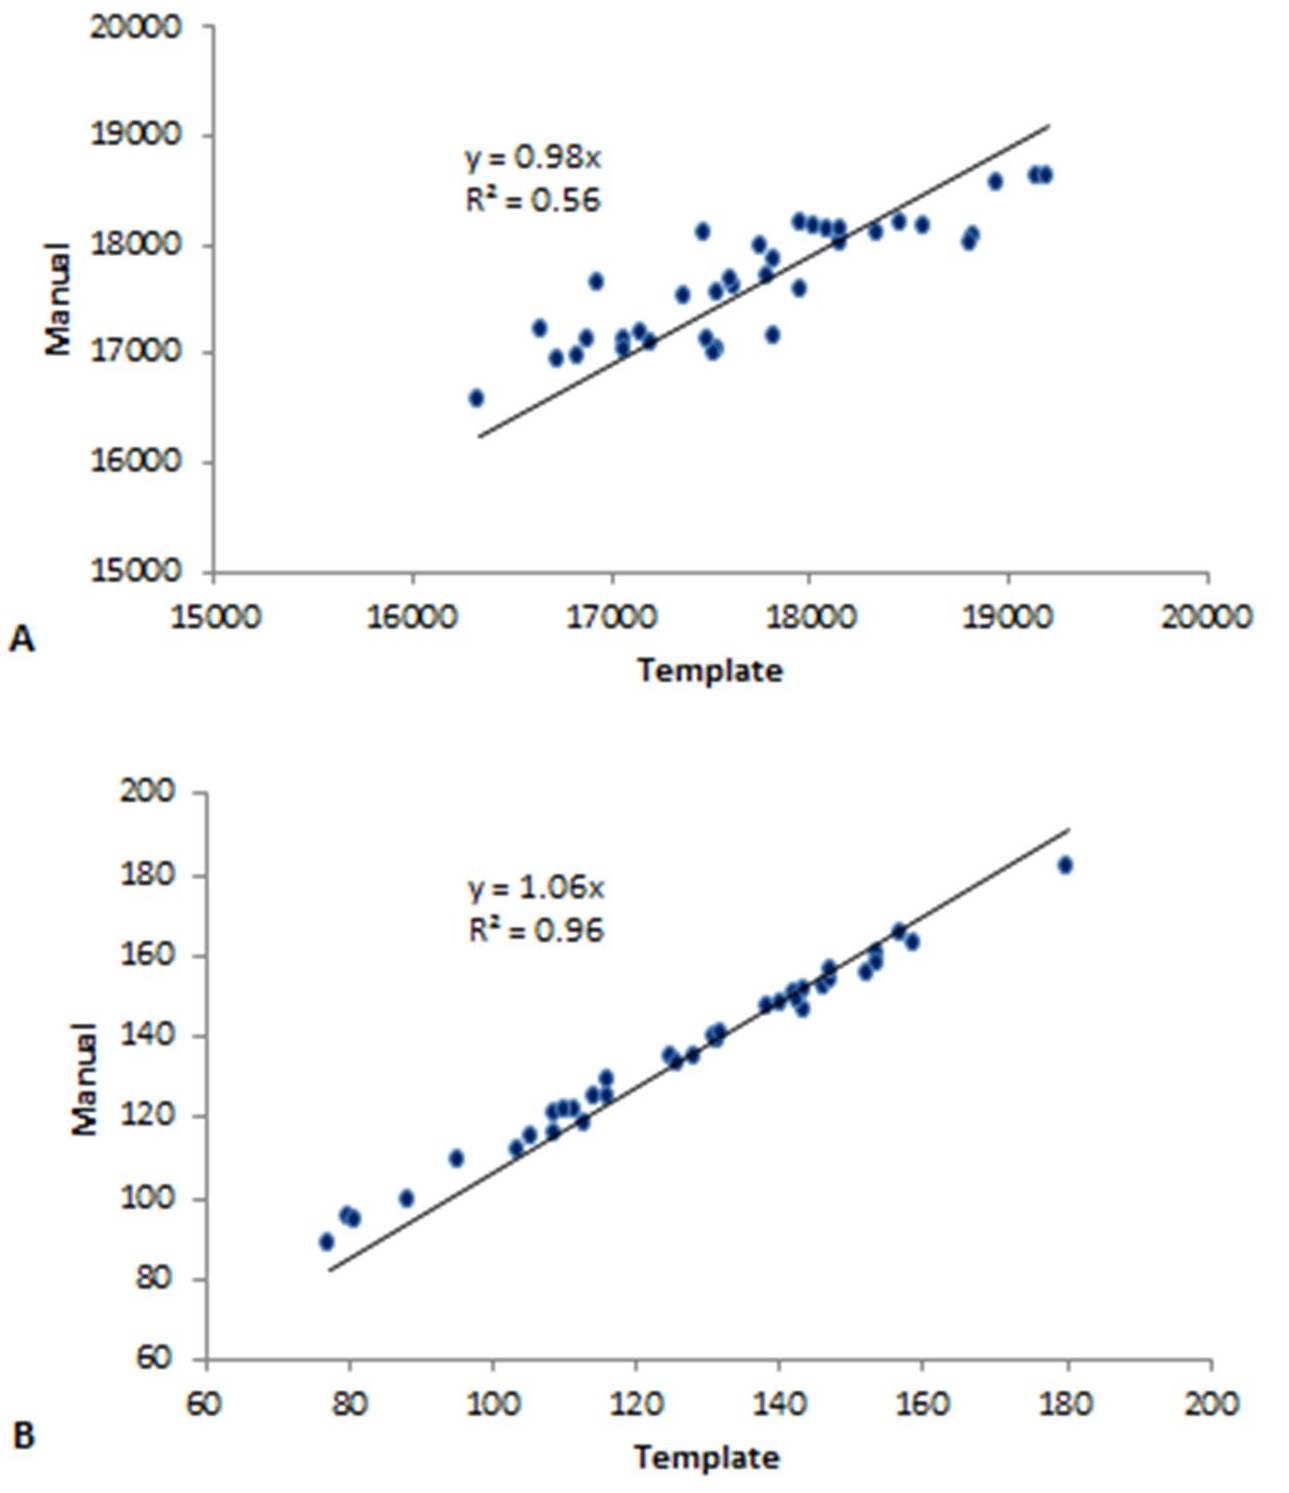
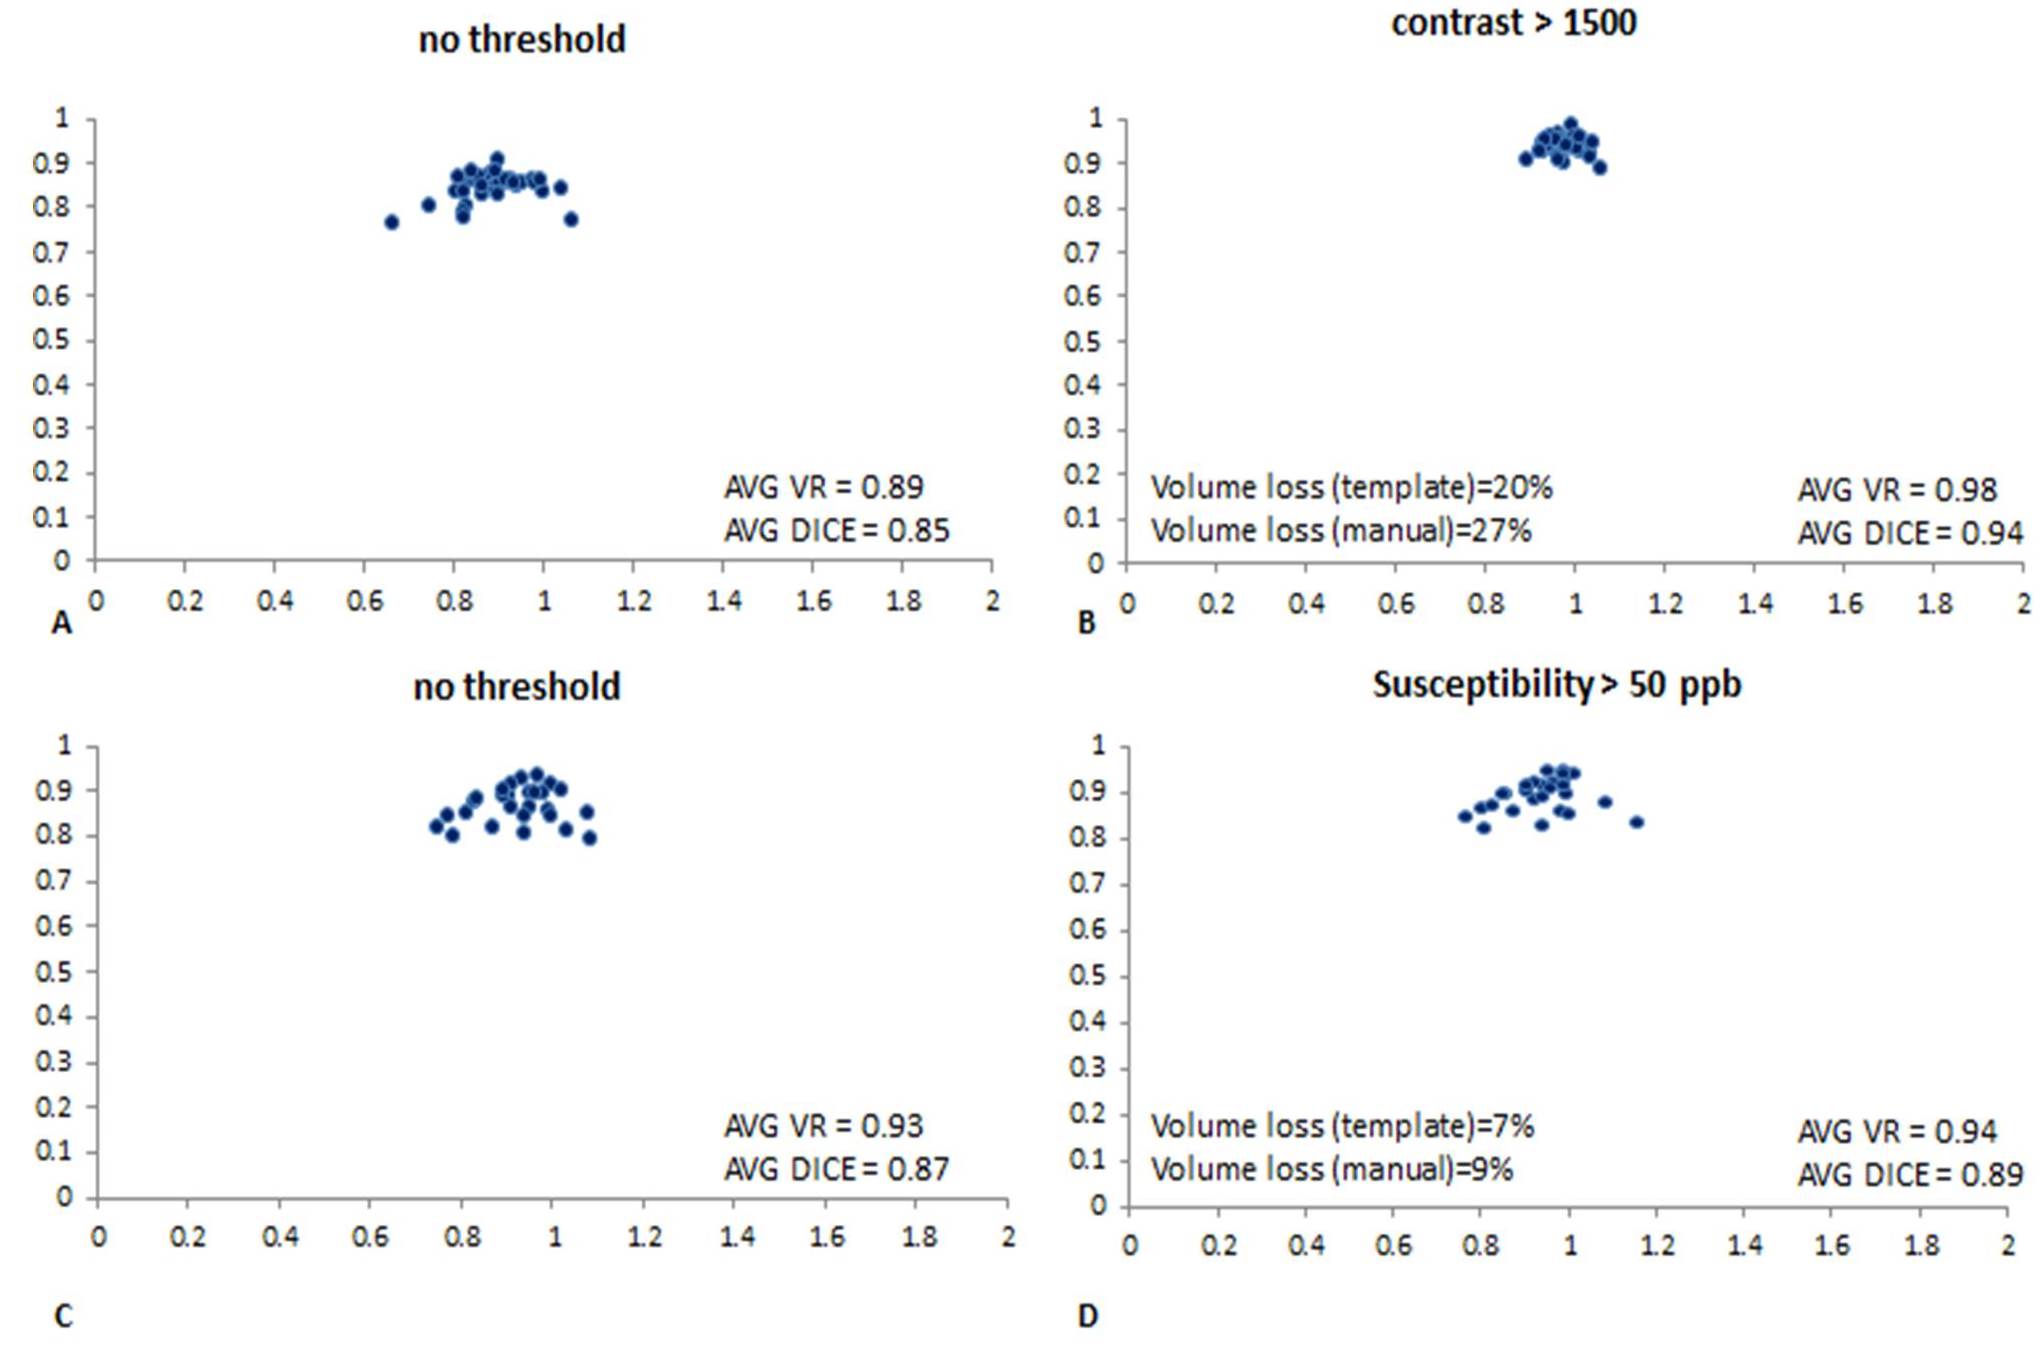
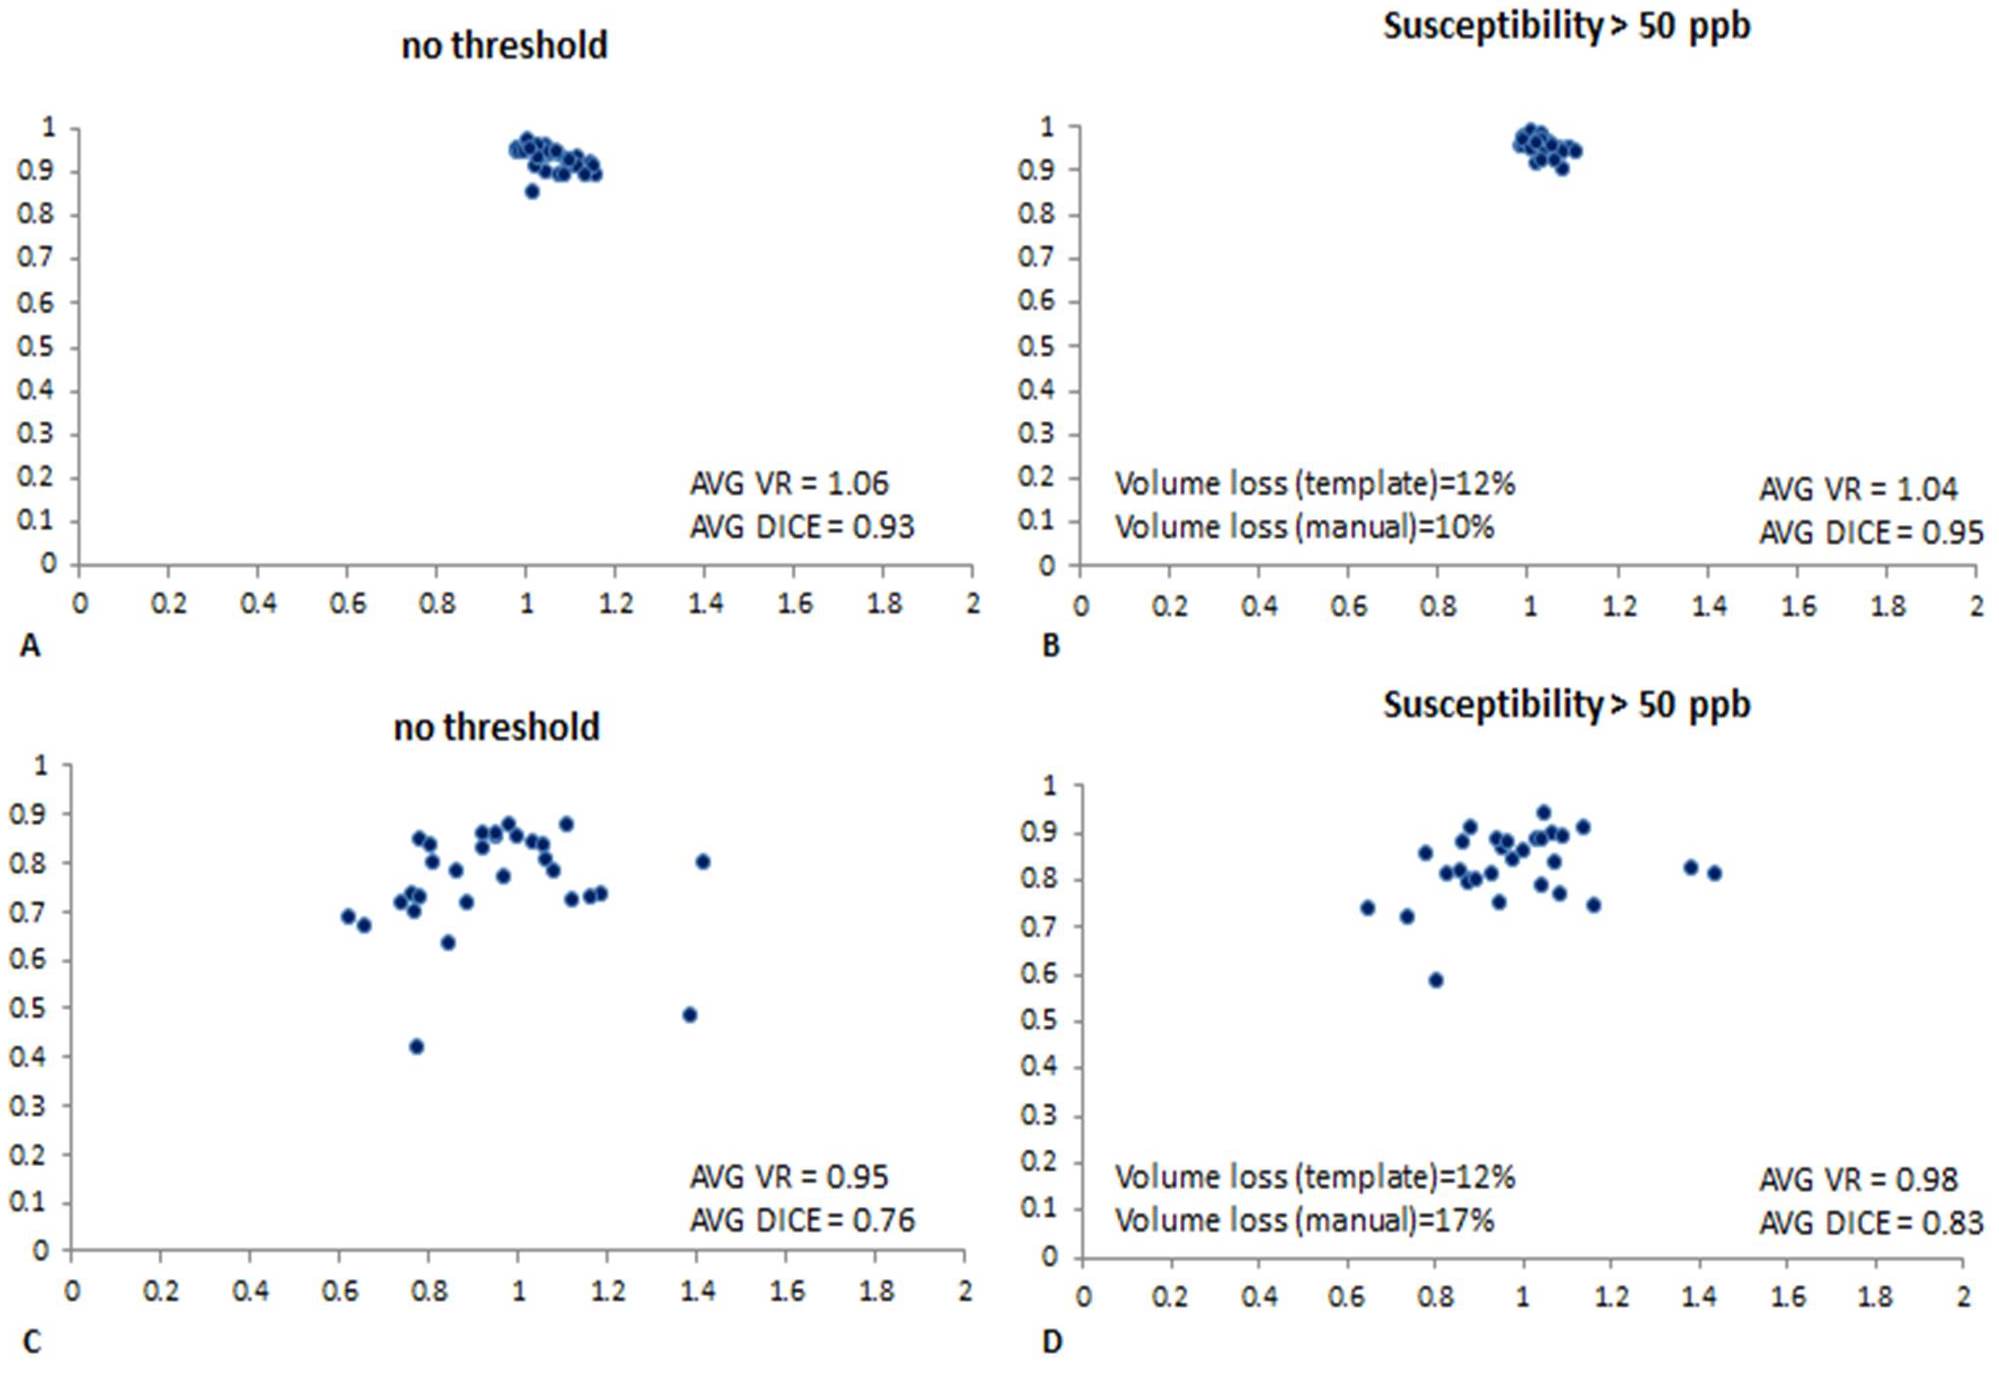
The slices from the original and transformed space as well as the boundaries associated with the MTC and QSM data are shown in Figure 1 and 2, respectively. Figure 3A and 3B show the template automatic MTC background intensity and SN iron content measures, respectively. The correlation between the manual and template measures associated with the MTC background shows a slope of 0.98, an R2 of 0.56, and a p-value < 0.001. For the SN iron content, manual versus template measures with a threshold of 50 ppb yielded: a slope of 1.06, an R2 of 0.96 and a p-value < 0.001. The DICE similarity coefficients and VR measures were calculated for different thresholds for both MTC and QSM images, and the data associated with the NM DICE coefficients plotted against the VR are shown in Figures 4A,B. The higher thresholds can improve the DICE and VR but can also cause higher loss in volume. Therefore, there has to be a tradeoff between a satisfactory DICE and volume ratio, and volume loss. For MTC contrast, with a threshold of 1500, the average volume loss for all the cases is about 20% yielded average DICE and VR values of 0.94 and 0.98 respectively. Similarly for the average susceptibility measure for the SN, a threshold of 50 ppb yielded an average volume loss just under 10% with average DICE and VR values of 0.89 and 0.94, respectively (Figure 4D). Figures 5A,B and 5C,D illustrate the DICE similarity coefficient vs. VR for the RN and STN, respectively. The average DICE and volume ratio were 0.93 and 1.06 for the RN; and 0.76 and 0.95 for the STN, respectively. However, applying a threshold of 50 ppb can improve these values with an average volume loss of 12% for both structures.Discussion and conclusion
In this work, we have described and validated a multi-contrast atlas in combination with a dynamic programming algorithm for boundary detection in both the template space and in the original images after transformation back from the template space. The NM, SN, STN and RN structures were evaluated both manually and with the automatic template mapping to the original space for both MTC and QSM data. Both DICE values and estimated volume ratio showed excellent agreement for the volume and iron content measures between the automatic template approach versus the manual drawings.Acknowledgements
No acknowledgement found.References
1. Kowal, S.L., Dall, T.M., Chakrabarti, R., Storm, M.V., and Jain, A. (2013). The current and projected economic burden of Parkinson's disease in the United States. Mov Disord 28, 311-318.
2. Greenfield, J.G., and Bosanquet, F.D. (1953). The brain-stem lesions in Parkinsonism. J Neurol Neurosurg Psychiatry 16, 213-226.
3. Dexter, D.T., Carayon, A., Javoy-Agid, F., Agid, Y., Wells, F.R., Daniel, S.E., Lees, A.J., Jenner, P., and Marsden, C.D. (1991). Alterations in the levels of iron, ferritin and other trace metals in Parkinson's disease and other neurodegenerative diseases affecting the basal ganglia. Brain 114 ( Pt 4), 1953-1975.
4. Jiang, J., Haacke, E.M., Dong, M., 2007. Dependence of vessel area accuracy and precision as a function of MR imaging parameters and boundary detection algorithm. J Magn Reson Imaging 25, 1226-1234.
5. Zhang, T.Y., Suen, C., 1984. A fast parallel algorithm for thinning digital patterns. Communications of the ACM 27.
Figures