3011
Evaluating normative Cerebellum radiomics on FLAIR images1Symbiosis Centre for Medical Image Analysis, Symbiosis International University, Pune, India, 2Department of Radiology, National Institute of Mental Health and Neurosciences, Bengaluru, India, 3Department of Radiology,Fortis Memorial Research Institute, Gurgaon, India
Synopsis
Radiomics in neuroimaging has gained momentum as a noninvasive prediction tool not only to differentiate between types of brain tumors, but also to create phenotypic signatures in neurological/neuropsychiatric disorders. However, there is currently little understating about the robustness and reproducibility of radiomic features in a baseline normative population. Moreover, the radiomics across cerebellum which has a more complex anatomy has not been evaluated This study investigates and demonstrates the intra- and inter-scanner reproducibility and the spatial variations within the regions of the cerebrum and cerebellum. Our findings suggest that care must be taken while interpreting these features for pathological inferences.
Introduction
Radiomics is an emerging field of quantitative analysis of radiographic images through computation of image biomarkers (features) such as intensity, geometric and textures within a region of interest (ROI) which are then used in multivariate predictive framework for prognosis, tracking of disease and treatment evaluation1–3. It has gained momentum as a non-invasive predictive tool, prominently in neuroimaging through its use in classification of different tumour types but also to create phenotypic signatures in neurological and neuropsychiatric disorders4–7. However, there is still little understanding of the robustness and reproducibility of these features in the baseline normative population which is an important step before translating to pathology. Moreover, understanding the spatial heterogeneity of these features is crucial, and a recent study has demonstrated the spatial variability of radiomics across the brain lobes8. However, the radiomics across cerebellum which has a more complex anatomy with microscopic foliations has not been evaluated. To this end, this study utilizes T2-FLAIR images that are routinely used for tumor analysis and investigates the radiomics on a healthy population with focus on the cerebellum. The study evaluates (1) spatial variation across cerebellum, cerebellar lobules and its comparison to cerebral radiomics and (2) assesses intra- and inter- scanner reproducibility of cerebellar radiomics using test-retest scans.Methods
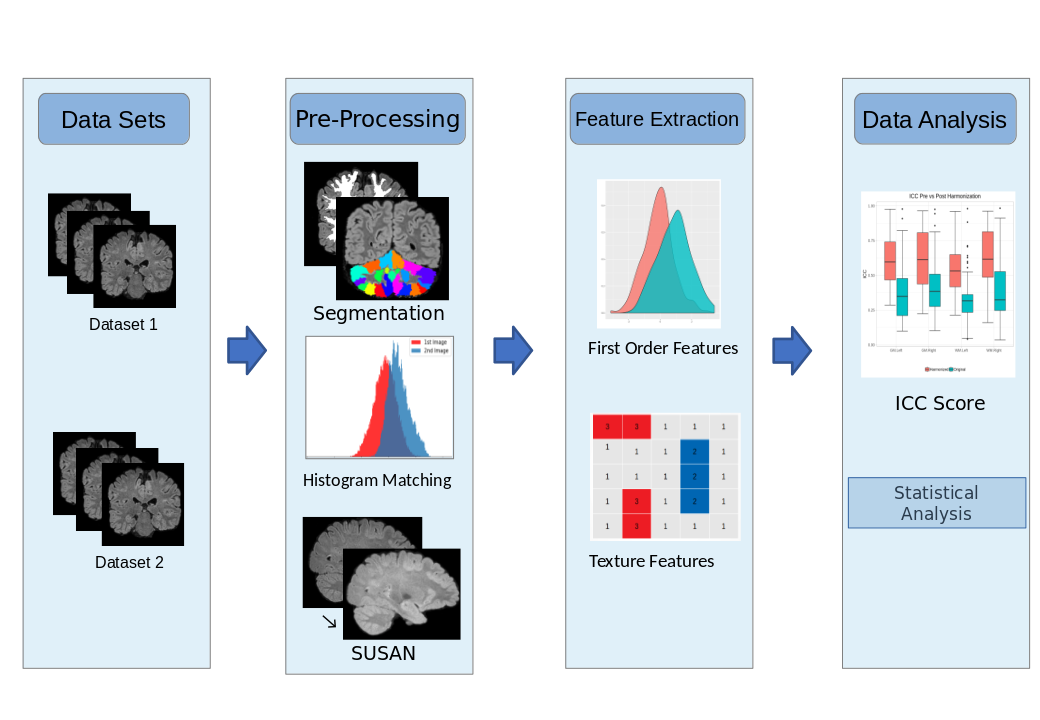
The study consisted of two datasets of healthy subjects that were scanned at 3 different timepoints within a week on the same scanner (4 subjects, mean age 22 ± 1.2 yrs. 2F/3M) to test-retest intra-scanner reproducibility and inter-scanner reproducibility (8 subjects, mean age 21.2 ± 3.5, M/F= 5/3) on three different scanners. For data set 1 (intra-scanner -three timepoints, 4 subjects) imaging was carried on Philips 3T Ingenia scanner with a 15-channel head-coil. FLAIR images were acquired using TR/TE = 4700/284 ms, FOV = 400 x 400 mm2, voxel size of 0.62 x 0.6182 x 0.6182 mm3. For dataset 2, (the inter-scanner test-retest data, 8 subjects), was acquired on 1.5T and 3T Siemens, and 3T Philips MRI scanners, respectively. For the 3 scanning sessions the scanning parameters ranged from; TR/TE = 4800-8000/340-388 ms, inversion time (TI) = 1650-2300 ms, slice thickness = 1-1.12 mm, FOV = 256 × 256 mm2, flip angle = 120°. The dataset was manually checked for presence of any motion or other artifacts. T1 images were used for computing grey matter and white matter masks using the Freesurfer recon-all tool9, while the cerebellum parcellations were extracted by registering the cerebellum gray matter masks with the SUIT atlas10. By considering one of the timepoints (scanner in case of dataset 2) as reference timepoint/scanner, intra-subject registration was performed using Advanced normalization tool (ANTs)11. Linear transformation was used to transfer the regions of interest (ROIs) to the T1-subject space and consequently to the FLAIR space. Further preprocessing steps involved Smallest Univalue Segment Assimilating Nucleus (SUSAN)12, a noise reduction algorithm and histogram matching with one of the reference brains from the reference time point/scanner. Radiomic based feature extraction for the ROIs were performed using pyradiomics 2.2.0 package13(as shown in Figure 1). A total of 93 features that included intensity and statistical features such as, Gray-Level Co-occurrence Matrix (GLCM), Gray-Level Dependence Matrix (GLDM), Gray-level Run Length Matrix (GLRLM), Gray Level Size Zone Matrix (GLSZM) and Neighboring Gray Tone Difference Matrix (NGTDM) were extracted for each region. Inter-class correlation (ICC) was computed to test the reproducibility/spatial variability of radiomic features of the ROIs, with reproducibility threshold set at ICC>0.514. Furthermore, differences between cerebellum and cerebrum were also tested using a two tailed homoscedastic paired t-test. Effect of harmonization on radiomics of Cerebellum parcellations was also investigated using a statistical harmonization tool, namely ‘Combatting batch effects when combining batches of gene expression microarray data’ (ComBat)15.Results
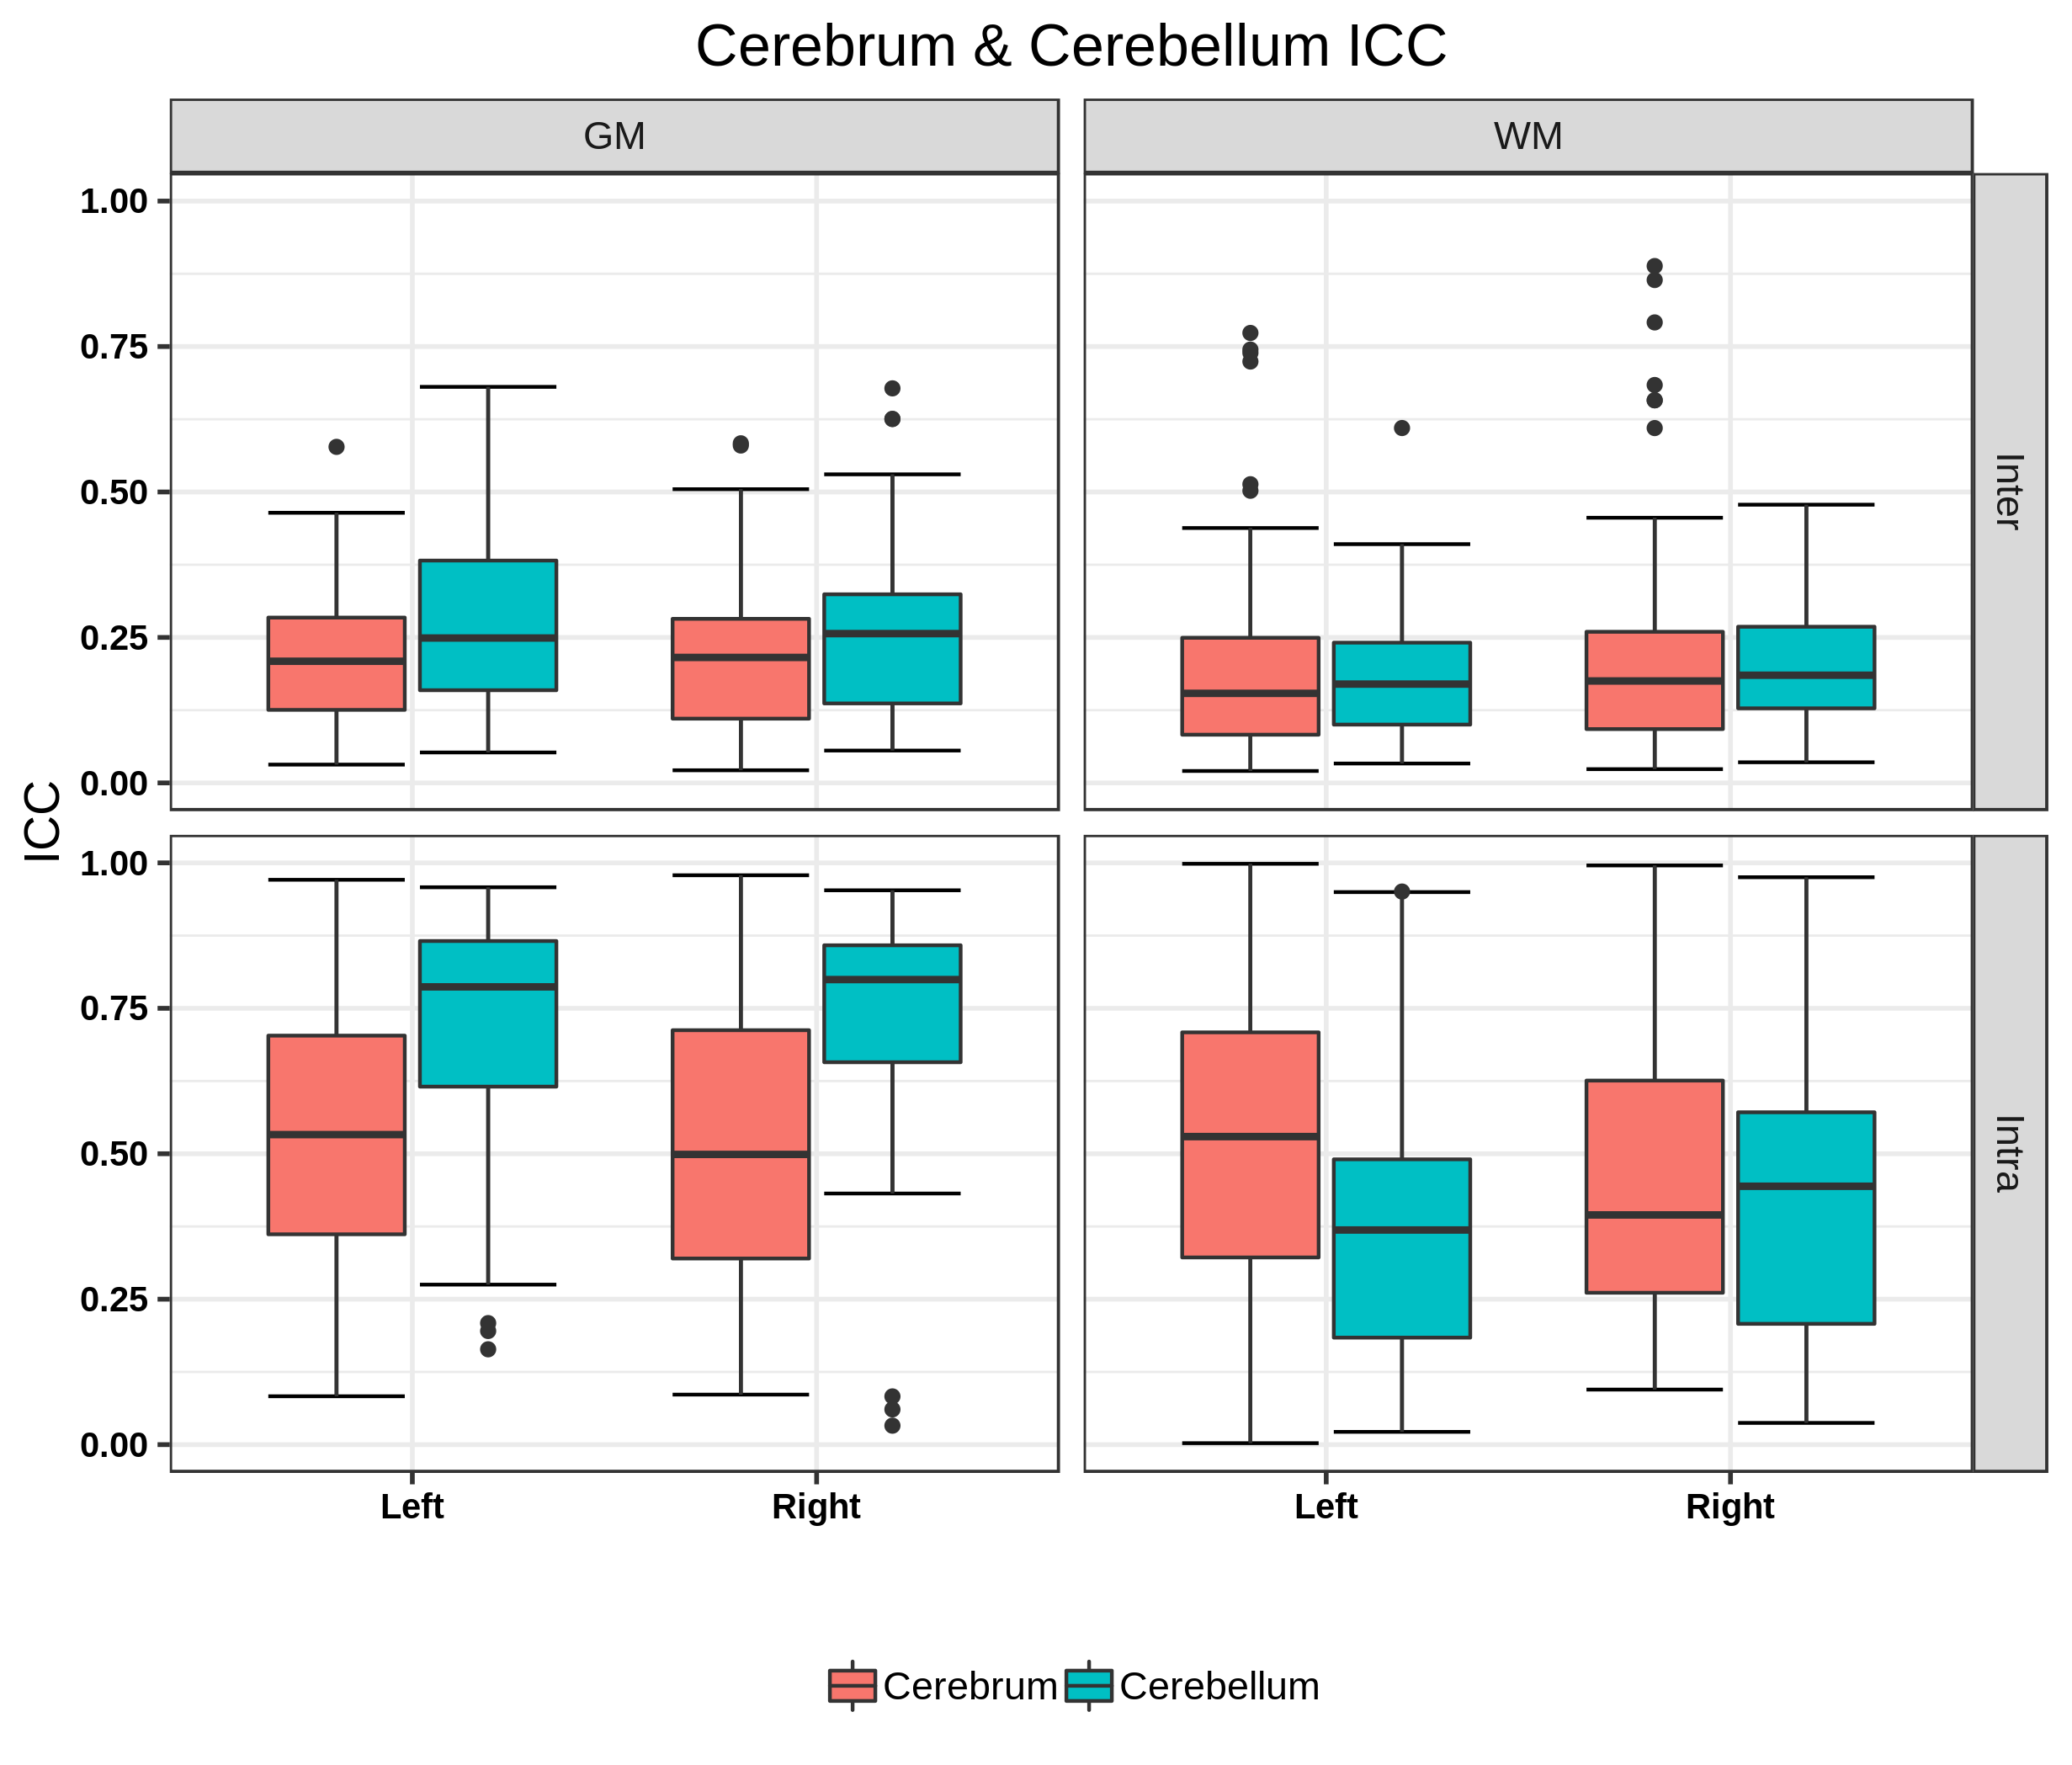
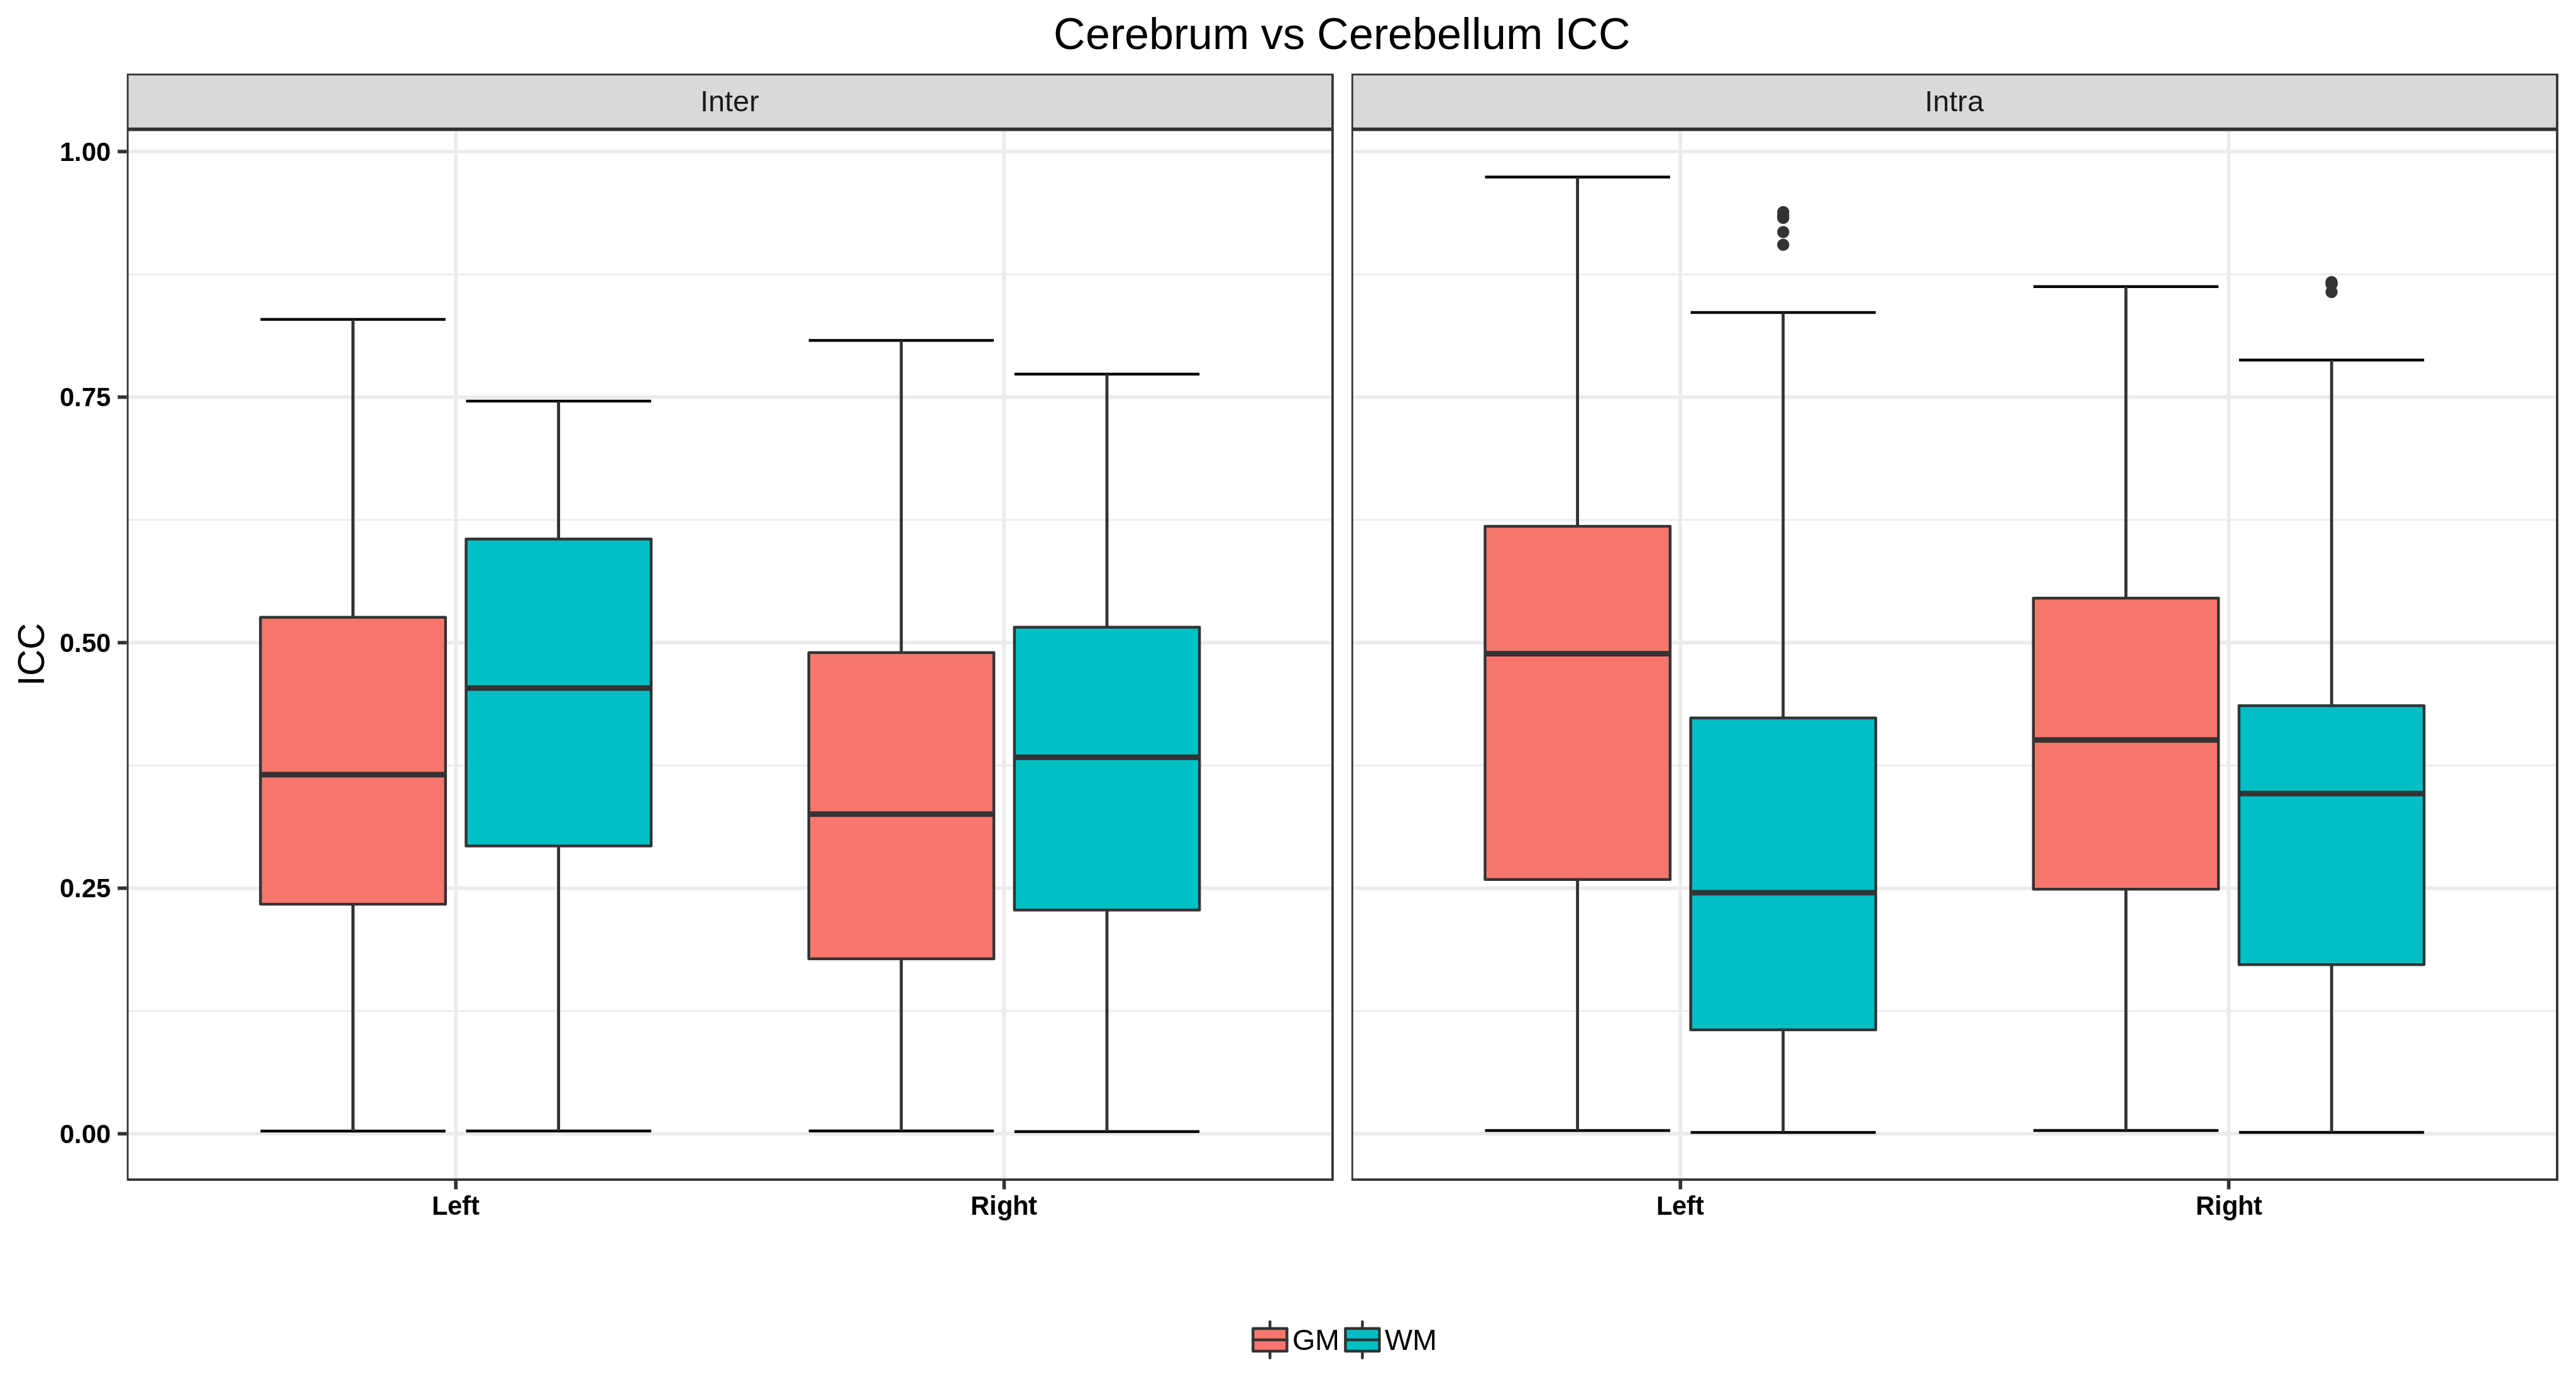
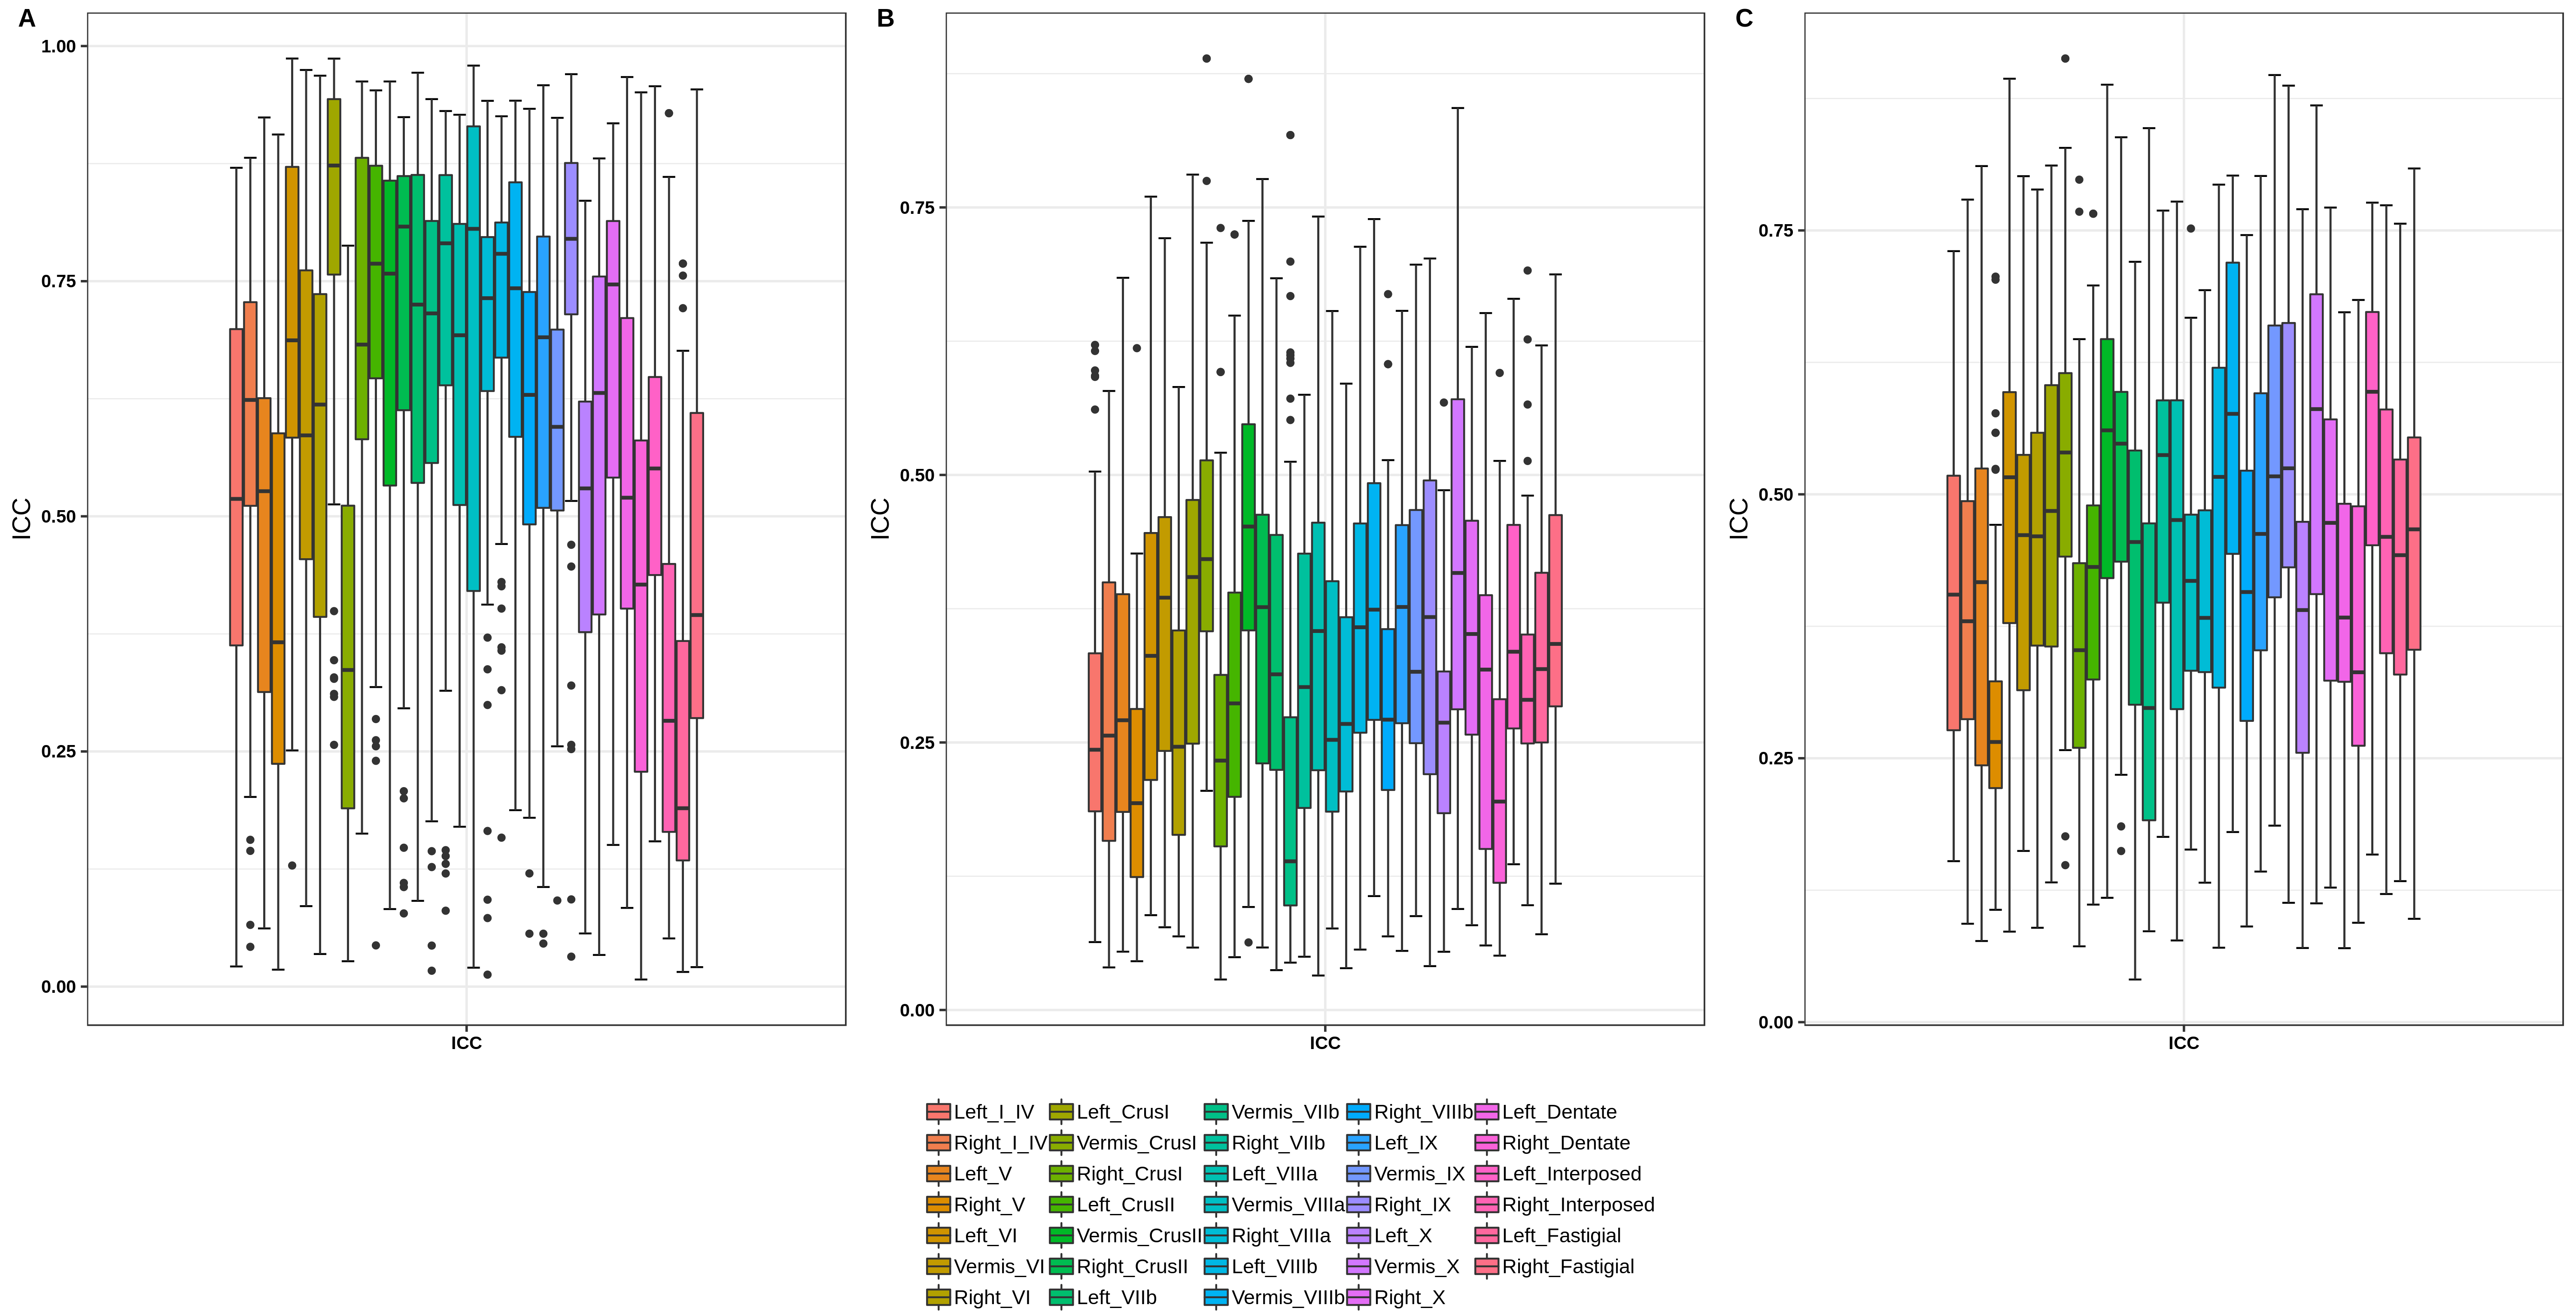
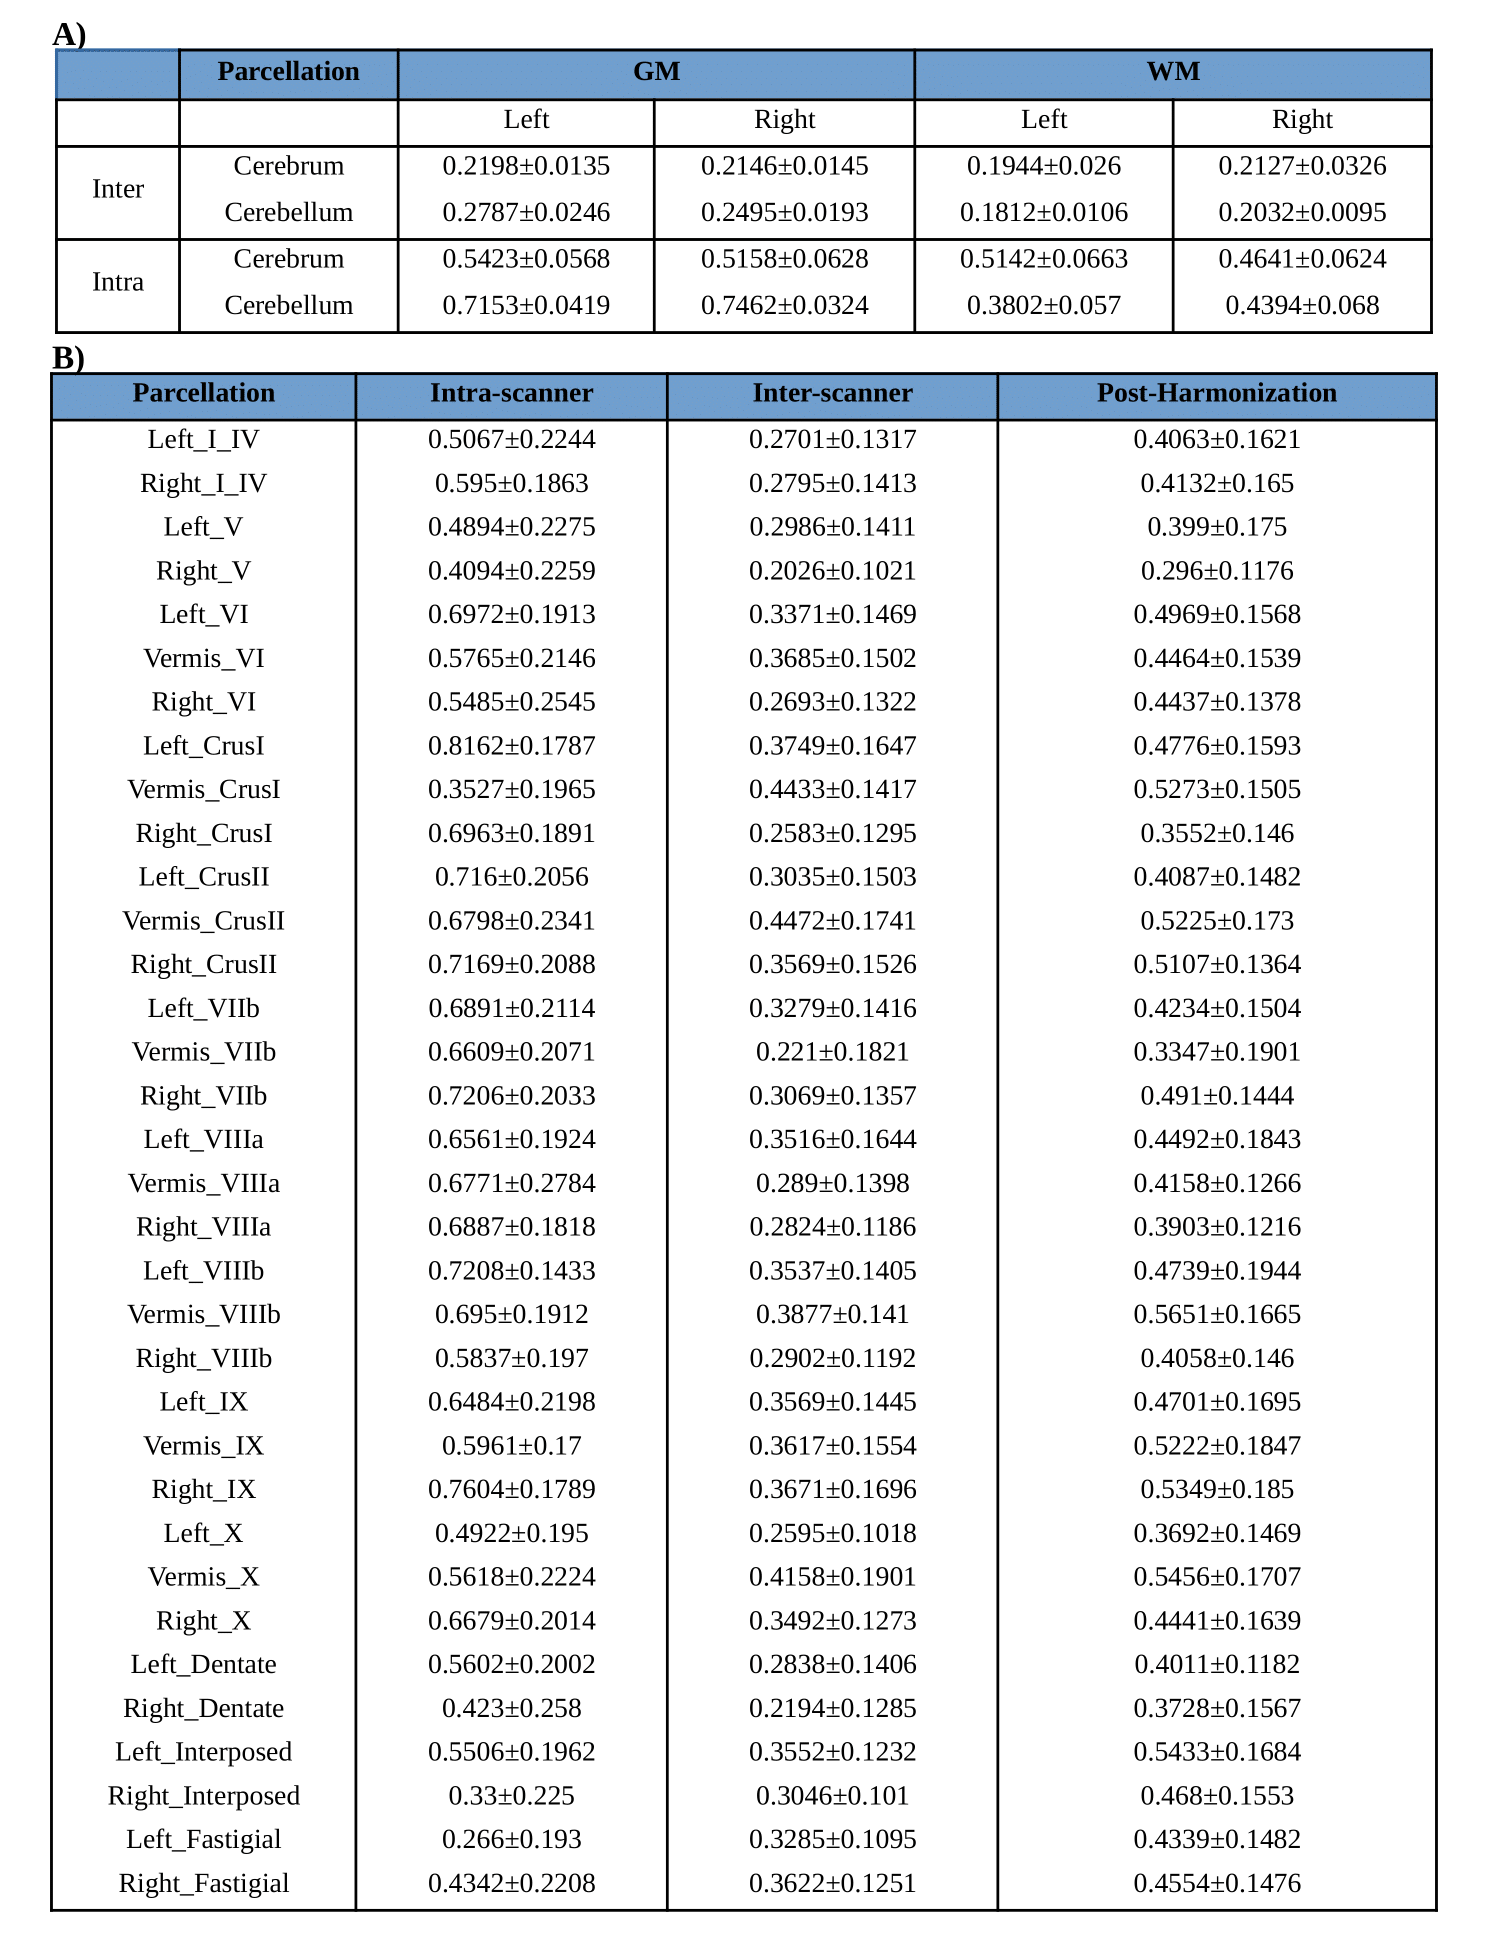
Significant regional differences were observed between cerebellum and cerebrum with p-values of 0.0074/0.082 for GM (L/R) and 0.0001 for WM right. For the cerebrum and cerebellum GM/WM masks for intra and inter-scanner, the ICC scores are also illustrated in Figure 2, while the mean ICC scores are tabulated in Table 1a. Intra-scanner ICC between ROIs of cerebrum and cerebellum are shown in figure 3 and it’s values were GM (L/R) 0.4384±0.0427, 0.3891±0.0316 and WM (L/R) 0.2892±0.2892, 0.3206±0.3206. Whereas, for inter-scanner the values ranged from GM (L/R) 0.3545±0.0351, 0.3384±0.0358 and WM (L/R) 0.4225±0.4225, 0.3643±0.3643. Figure 4 demonstrates the ICC score of cerebellum lobules for intra scanner along with pre-post harmonized values of inter-scanner data, whereas table 1b consists of all the ICC values.Discussions
Despite the promise that radiomics facilitate, the baseline differences across the brain structures have never been evaluated and accounted for in analysis of pathologies. Cerebellum being a complex anatomical structure with micro-foliations illustrated a significantly different radiomics profile when compared to the cerebral regions on FLAIR images. Moreover, radiomics of cerebellum lobules were not reproducible between scanners however improved after site-harmonization. The cerebellum is implicated in many movements disorders and thus its correct interpretation is vital.Acknowledgements
NoneReferences
1. Ferris JK, Chang PD, Chow DS: Radiomics and Machine Learning. 2020.
2. Lu C-F, Hsu F-T, Hsieh KL-C, et al.: Machine Learning–Based Radiomics for Molecular Subtyping of Gliomas. Clin Cancer Res 2018; 24:4429–4436.
3. Gore S, Chougule T, Jagtap J, Saini J, Ingalhalikar M: A Review of Radiomics and Deep Predictive Modeling in Glioma Characterization. Academic Radiology 2020.
4. Mazurowski MA: Radiogenomics: What It Is and Why It Is Important. Journal of the American College of Radiology 2015; 12:862–866.
5. Bodalal Z, Trebeschi S, Nguyen-Kim TDL, Schats W, Beets-Tan R: Radiogenomics: bridging imaging and genomics. Abdom Radiol 2019; 44:1960–1984.
6. Cho H, Lee S, Kim J, Park H: Classification of the glioma grading using radiomics analysis. PeerJ 2018; 6.
7. Shinde S, Prasad S, Saboo Y, et al.: Predictive markers for Parkinson’s disease using deep neural nets on neuromelanin sensitive MRI. NeuroImage: Clinical 2019; 22:101748.
8. Pandey U, Saini J, Kumar M, Gupta R, Ingalhalikar M: Normative Baseline for Radiomics in Brain MRI: Evaluating the Robustness, Regional Variations, and Reproducibility on FLAIR Images. Journal of Magnetic Resonance Imaging 2020; early-view.
9. FreeSurfer [https://surfer.nmr.mgh.harvard.edu/]
10. Diedrichsen J: A spatially unbiased atlas template of the human cerebellum. Neuroimage 2006; 33:127–138.
11. Avants B, Tustison N, Song G: Advanced Normalization Tools: V1.0. The Insight Journal 2009:681. [2009 July-December]
12. Mao Z, Ma L, Zhao M, Xiao X: SUSAN structure preserving filtering for mesh denoising. Vis Comput 2006; 22:276–284.
13. van Griethuysen JJ, Fedorov A, Parmar C, et al.: Computational Radiomics System to Decode the Radiographic Phenotype. Cancer Res 2017; 77:e104–e107.
14. Koo TK, Li MY: A Guideline of Selecting and Reporting Intraclass Correlation Coefficients for Reliability Research. J Chiropr Med 2016; 15:155–163.
15. Fortin J-P, Parker D, Tunç B, et al.: Harmonization of multi-site diffusion tensor imaging data. Neuroimage 2017; 161:149–170.
Figures