3006
Cerebellar changes in Spinocerebellar Ataxia Type 2 and 12 in comparison with healthy controls1NMR, All India Institute of Medical Sciences, New Delhi, India, 2Neurology, All India Institute of Medical Sciences, New Delhi, India
Synopsis
Spinocerebellar Ataxia (SCA), also known as spinocerebellar degeneration, is a degenerative, progressive and genetic disorder that leads to severe disability. On structural morphometrics of isolated cerebellum, we observed significant white matter atrophy in the anterior lobe of the SCA type 2 and 12 patients. Cerebellum atrophy of gray matter in both bilateral anterior and posterior cerebellar lobes, Cerebellar Tonsil, Uvula, Inferior Semi-Lunar Lobule, Declive, Red Nucleus and Substania Nigra was observed in SCA2, with respect to healthy controls. SCA2 patients exhibited more atrophy in comparison to SCA12. Atrophy in the cerebellum suggest deficits in motor and cognition in SCA patients.
Introduction
Spinocerebellar Ataxia (SCA) is categorized as progressive cerebellar ataxia withoculomotor dysfunction, pyramidal signs, peripheral neuropathy, extrapyramidal signs, dysarthria, cognitive impairment,pigmentary retinopathy and other symptoms. Of the 40 classes or types of SCAs categorized (SCA1 to SCA 40), SCA type 2 and 12 are more prevalent in Indian subcontinent (Ruano & Silva, 2014; Van De Warrenburg et al., 2002).Spinocerebellar Ataxia (SCA) is associated with cerebellum and brain-stem atrophy and its slow progressive degeneration. Role of cerebellum in motor control and voluntary activity (viz. balance, speech, posture, etc) has been documented(Leiner, 2010). However, its role in cognitive functions and correlation with other brain areas is unexplored (Leiner et al., 1991). Magnetic resonance Imaging (MRI) has been used to studystructural atrophy of the degenerative brain.Voxel-based morphometry (VBM) is a statistical method for estimating voxeldifferences in the gray and white matter of the brain, mainly for cerebrum(Lindig et al., 2019). We used a human cerebellum and brainstematlas-based template (SUIT template) to isolate and characterize atrophy in SCA2 and SCA12 in comparison with healthy controls.Methodology
The study was carried out in fifteen healthy controls (age=36±14, 6F/9M), fifteen symptomatic SCA2 (mean age 47±10 years; 4F/11M) and fifteen SCA12 (mean age 53±10 years; 5F/10M) patients without head tremor. All SCA patients were recruited after genetic confirmation from the ataxia clinic. They had no history of neurological and psychiatric disorder other than SCA2 or SCA12. All subjects were informed and consent was obtained prior to investigations. MRI was acquired on a 3T whole body MR scanner (Ingenia 3.0 T, M/s. Philips Healthcare, The Netherlands) using circular 32-channel phase array head coil. Tl weighted 3D Turbo Field Echo (TFE) multi-shot spin echo sequence was used with TR/TE: 8.1 ms/3.7 ms; flip angle:8° ; FOV-240*240*180; Slices -360 with no gap, matrix size- 240x220x360. Voxel based morphometryof T1W images using infratentorial template of the SUIT toolbox (Version 3.4, Brain and Mind Institute 2017) and SPM (version 12). Realignment of the data with AC-PC,and reorientation(standard LPI orientation) werecarried out using FSL. SUIT-isolation was used for isolate the brainstem and cerebellum from supratentorial brain. The cropped images were normalized with standard cerebellum-brainstem SUIT template, segmented into gray and white matter and were resliced in SUIT space. Flatmaps were used for visualize the 3D space of cerebellum and brainstem area.Inter-group analyses were performed using one-way ANOVA between the SCA2, SCA12 and HC. The significant correlation was considered in white matter between SCA2 and SCA12 with p-value p<0.05FWE corrected.Result
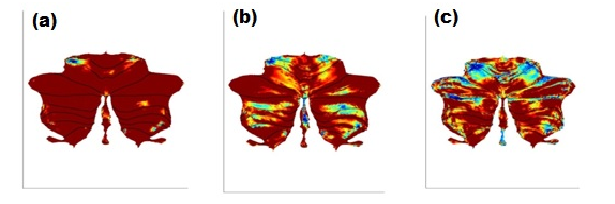
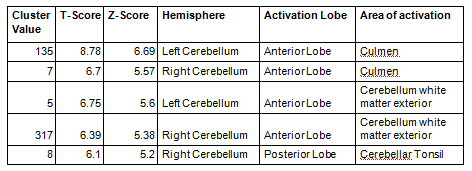
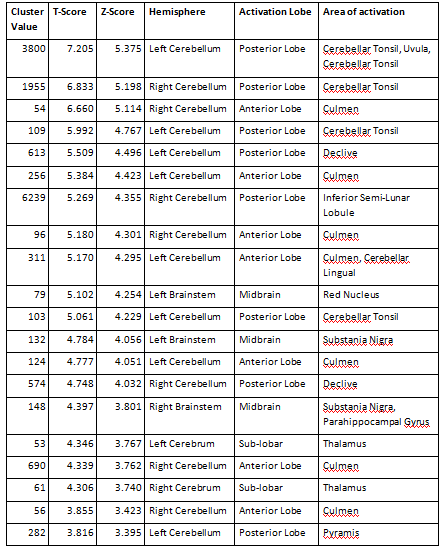
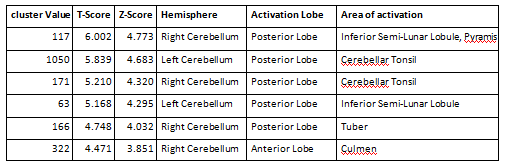
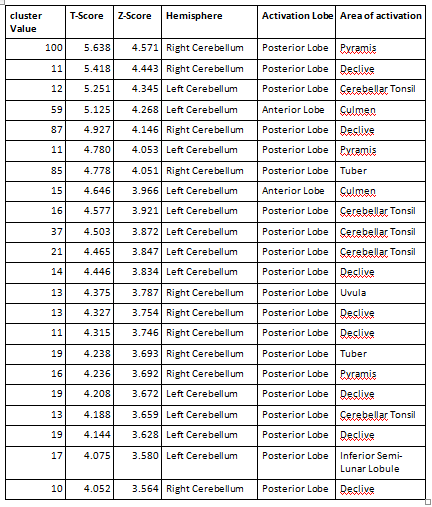
Atrophy in bilateral cerebellum and brainstem was observed in SCA patients.SCA2 group revealed prominent white matter atrophy with significant difference in both bilateral anterior cerebellar lobes (Figure1), Cerebellar TonsilandCulmen in comparison with the SCA12 (Table 1). SCA2 group also revealed gray matter atrophy (at a reduced significant level p<0.001, uncorr) in both bilateral anterior and posterior cerebellar lobes, Cerebellar Tonsil, Uvula, Inferior Semi-Lunar Lobule, Declive, Red Nucleus and Substania Nigrain comparison with the controls (Table 2).SCA12 group revealed atrophy in Inferior Semi-Lunar Lobule, Cerebellar Tonsil and Culmenwith respect to the control group (Table 3). We also observed significant difference between SCA2 and SCA12 atrophy in cerebellum Pyramis, Cerebellar Tonsil, Uvula, and Inferior Semi-Lunar Lobule (both anterior and posterior lobes) and the brainstem (Table 4).Discussion
Motor control and voluntary activity such as balance, speech and posture are controlled predominantly by cerebellum. Structural MRI studies have reported atrophy in the cerebellum, brainstem, basal ganglia, thalamus areas in SCA (Klockgether et al., 1998; Tokumaru et al., 2003).Alterations of structural and functional MR connectivity and BOLD hemodynamic responses has been reported in the cerebellar cortex indicating neurodegenerative processes beyond the dentate nucleus(Lindig et al., 2019)(Ackermann & Brendel, 2016). Cerebellum atrophy is correlatedwith the severity of dysarthria and other gait ataxia(Sun et al., 2016). Cerebellar atrophy was evident on significantly higher white matter changes, and some Gray matter changes (significant at reduced threshold) in SCA2 and SCA12, more reflected on the anterior lobe, similar to earlier BOLD studies (Ackermann & Brendel, 2016).The results exhibited more atrophy in SCA2 in comparison with SCA12, correlating withmore tremor and gait abnormality in SCA2 patientsConclusion
Structural changes in cerebellum, especially posterior lobe in SCA patients may be attributed to the motor and cognitive dysfunctions. Increased atrophy in SCA2 (with respect to SCA12) suggest more tremor and dyskinesia.Acknowledgements
We sincerely thank the Deparment of Science and Technology-Science and EngineeringResearch Board (DST-SERB) New Delhi, India for providing fellowship [Project No:EMR/2017/002294 & 03rd October, 2018]References
1. Ackermann, H., & Brendel, B. (2016). Cerebellar Contributions to Speech and Language. In Neurobiology of Language (pp. 73–84). Elsevier.
2. Klockgether, T., Skalej, M., Wedekind, D., Luft, A. R., Welte, D., Schulz, J. B., Abele, M., Bürk, K., Laccone, F., Brice, A., & Dichgans, J. (1998). Autosomal dominant cerebellar ataxia type I. MRI-based volumetry of posterior fossa structures and basal ganglia in spinocerebellar ataxia types 1, 2 and 3. Brain, 121(9), 1687–1693.
3. Lindig, T., Bender, B., Kumar, V. J., Hauser, T.-K., Grodd, W., Brendel, B., Just, J., Synofzik, M., Klose, U., Scheffler, K., Ernemann, U., & Schöls, L. (2019). Pattern of Cerebellar Atrophy in Friedreich’s Ataxia—Using the SUIT Template. The Cerebellum, 18(3), 435–447.
4. Ruano, L., & Silva, M. C. (2014). The Global Epidemiology of Hereditary Ataxia and Spastic Paraplegia: A Systematic Review of Prevalence Studies. 174–183.
5. Sun, Y.-M., Lu, C., & Wu, Z.-Y. (2016). Spinocerebellar ataxia: Relationship between phenotype and genotype - a review: Spinocerebellar ataxia: relationship between phenotype and genotype. Clinical Genetics, 90(4), 305–314.
6. Tokumaru, A. M., Kamakura, K., Maki, T., Murayama, S., Sakata, I., Kaji, T., Kohyama, S., Kusano, S., & Hasegawa, S. (2003). Magnetic Resonance Imaging Findings of Machado–Joseph Disease: Histopathologic Correlation. Journal of Computer Assisted Tomography, 27(2), 241–248.
7. Van De Warrenburg, B. P. C., Sinke, R. J., Bemelmans, C. C. V., & Scheffer, H. (2002). Spinocerebellar ataxias in the Netherlands. Neurology.
8. Stefanescu MR, Dohnalek M, Maderwald S, Thürling M, Minnerop M, Beck A, Schlamann M, Diedrichsen J, Ladd ME, Timmann D. Structural and functional MRI abnormalities of cerebellar cortex and nuclei in SCA3, SCA6 and Friedreich’s ataxia. Brain. 2015 May 1;138(5):1182-97.
9. Olivito G, Cercignani M, Lupo M, et al. Neural substrates of motor and cognitive dysfunctions in SCA2 patients: a network based statistics analysis. NeuroImage: Clinical. 2017;14:719-25.
10. Giocondo F, Curcio G. Spinocerebellar ataxia: a critical review of cognitive and socio-cognitive deficits. International Journal of Neuroscience. 2018;128:182-91.
11. Friston KJ. Statistical parametric mapping. In Neuroscience databases 2003 (pp. 237-250), Springer, Boston, MA. Reetz K, RodríguezLabrada R, Dogan I, et al. Brain atrophy measures in preclinical and manifest spinocerebellar ataxia type 2. Annals of Clinical and Translational Neurology. 2018;5:128-37
Figures