3004
Breast MRI radiomic shape features for the prediction of neoadjuvant therapy response
Wen Li1, Rohan Nadkarni1, David C Newitt1, Bo La Yun1,2, Deep Hathi1, Alex Nguyen1, Natsuko Onishi1, Lisa J Wilmes1, Ella F Jones1, Jessica Gibbs1, Teffany Joy Bareng1, Bonnie N Joe1, Elissa Price1, Rita Mukhtar1, John Kornak1, Efstathios Gennatos1, I-SPY 2 Consortium3, Laura J Esserman1, and Nola M Hylton1
1University of California, San Francisco, San Francisco, CA, United States, 2Seoul National University Bundang Hospital, Seoul, Korea, Republic of, 3Quantum Leap Healthcare Collaborative, San Francisco, CA, United States
1University of California, San Francisco, San Francisco, CA, United States, 2Seoul National University Bundang Hospital, Seoul, Korea, Republic of, 3Quantum Leap Healthcare Collaborative, San Francisco, CA, United States
Synopsis
A previous study demonstrated that tumor sphericity, measured from breast DCE-MRI during neoadjuvant therapy, is predictive of pathologic complete response and adds value to a predictive model based on functional tumor volume (FTV) alone. This study further explores the additive value of alternative radiomic shape features by breast cancer subtype. A subset of shape features were selected using visually assessed MRI morphological patterns as guidance. The analysis of treatment response prediction was conducted retrospectively using data from the multi-center neoadjuvant I-SPY 2 TRIAL. Improved predictive performance when adding shape features was observed at both pre-treatment and early treatment time points.
Introduction
Functional tumor volume (FTV) measured from DCE-MRI can predict pCR as early as after the first cycle of anthracycline-cyclophosphamide neoadjuvant chemotherapy (NCT)1. Previous studies demonstrated that tumor sphericity, measured from breast DCE-MRI during neoadjuvant therapy, is predictive of pathologic complete response and adds value to a predictive model based on functional tumor volume (FTV) alone2,3. Studies also showed that tumor morphologic phenotype visually assessed from DCE-MRI is associated with response to NCT4,5. However, visual assessment is time consuming and subjective. In this study, we explored radiomic shape features for primary tumors extracted automatically from breast MRI using the existing tumor masks generated for FTV and compared predictive performances of FTV, shape features, and the combination of the two in the prediction of pCR in the multi-center clinical trial I-SPY 2 TRIAL6.Methods
A total of 990 patients enrolled in the I-SPY 2 TRIAL and randomized to receive one of the 11 drug arms completed by October, 2016 were included. DCE-MRI exams acquired before (T0) and at the early treatment time point (T1, after one cycle of NCT) were analyzed. Axial T1-weighted images were acquired once before and at least twice after the administration of a gadolinium-based contrast agent. MRI morphological pattern at T0 was visually assessed in a subset of 220 patients using score 1—5 for tumor containment (1 being well-defined single mass and 5 being septal spreading). Tumor masks were generated by thresholding voxels inside a 3D ROI based on early percent enhancement (PE) and signal enhancement ratio (SER). PE=100*(S1-S0)/S0 and SER=(S1-S0)/(S2-S0), where S0, S1, and S2 are pixel intensity from pre-contrast, early, and late post-contrast phases, respectively. A PE threshold of 70% and SER threshold of 0 were used to generate tumor masks, and FTV was calculated by summing voxel volumes within the generated tumor mask7. Radiomic shape features were extracted from DCE-MRI at T0 and T1 using PyRadiomics8, following the preprocessing steps shown in Fig.1. A total of 17 shape features were extracted and a series of strategies were used to reduce the number of features: 1) feature importance generated by ordinal forest9 for classifying MRI morphological patterns 1—5; 2) Spearman’s correlation among shape features; 3) Spearman’s correlation between shape features and FTV. Baseline MRI predictors (FTV or shape features) measured at T0 and their changes from T0 to T1 were considered in this study. Logistic regression models were used to assess the value of MRI independent variables for the prediction of pCR (binary outcome defined as no residual disease in the breast and lymph nodes at the time of surgery). The predictive performance of different models was compared using estimated area under the ROC curve, applying 10-fold cross validation to avoid overfitting. Likelihood ratio p-value less than 0.05 was considered statistically significant.Results
The number of patients with FTV, shape features, and pCR outcome available at T0 and T1 were 941 and 904, with pCR rates of 35% and 34% respectively. Fig. 2 shows the variable importance as ranked by ordinal forest. Fig.3 shows the correlation map among 15 shape features and FTV at T0, after the bottom 2 features in Fig.2 were eliminated from analysis. Among 17 shape features extracted by PyRadiomics, five remained after the implementation of the feature selection strategy — sphericity, major axis length, minor axis length, least axis length, and flatness. These features were tested in the logistic regression model for predicting pCR at T0 and T1 with and without FTV. AUCs for models containing predictors from FTV only, shape only, and FTV + shape, are shown in Fig.4. Estimates of coefficients for predictors included in the FTV + shape models and their p-values are listed in Table 1. Additive predictive value for shape features (increase in AUC for FTV + shape models compared to FTV only) were observed in HR+/HER2- cancer subtype and in all subtypes at T1. At T0, major axis length showed statistically significant contribution to the prediction of pCR. At T1, baseline major axis length, minor axis length change and least axis length change showed statistically significant contribution for HR+/HER2-. Similarly, baseline least axis length and flatness for HR+/HER2+, and baseline least axis length and change of flatness for HR-/HER2-, were found to be statistically significant.Discussion
Our results showed additive value of radiomic shape features that differed by breast cancer subtypes and by time-point. Shape features may be especially helpful for HR+/HER2- subtype, where size measurement such as FTV is less accurate. This study suggests that a combination of radiomic features capturing tumor morphologic has greater additive benefit than sphericity alone in a multi-feature predictive model.Conclusion
Radiomic shape features can be used to measure tumor response to neoadjuvant therapy and provide additional predictive value to FTV in the prediction of pCR early in breast cancer treatment.Acknowledgements
This work was supported in part by NIH grants: R01 CA132870, U01 CA225427, and P01 CA210961.References
- Hylton, N. M. et al. Locally advanced breast cancer: MR imaging for prediction of response to neoadjuvant chemotherapy--results from ACRIN 6657/I-SPY TRIAL. Radiology 263, 663–72 (2012).
- Li, W. et al. Tumor sphericity predicts response in neoadjuvant chemotherapy for invasive breast cancer. Tomography (2020).
- Li, W. et al. Predicting breast cancer response to neoadjuvant treatment using multi-feature MRI: results from the I-SPY 2 TRIAL. npj Breast Cancer (2020).
- Esserman, L. et al. MRI phenotype is associated with response to doxorubicin and cyclophosphamide neoadjuvant chemotherapy in stage III breast cancer. Ann. Surg. Oncol. 8, 549–59 (2001).
- Mukhtar, R. A. et al. Clinically meaningful tumor reduction rates vary by prechemotherapy MRI phenotype and tumor subtype in the I-SPY 1 TRIAL (CALGB 150007/150012; ACRIN 6657). Ann. Surg. Oncol. 20, 3823–30 (2013).
- Park, J. W. et al. Adaptive Randomization of Neratinib in Early Breast Cancer. N. Engl. J. Med. 375, 11–22 (2016).
- Newitt, D. C. et al. Real-Time Measurement of Functional Tumor Volume by MRI to Assess Treatment Response in Breast Cancer Neoadjuvant Clinical Trials: Validation of the Aegis SER Software Platform. Transl. Oncol. 7, 94–100 (2014).
- van Griethuysen, J. J. M. et al. Computational Radiomics System to Decode the Radiographic Phenotype. Cancer Res. 77, e104–e107 (2017).
- Hornung, R. Ordinal Forests. J. Classif. 37, 4–17 (2020).
Figures
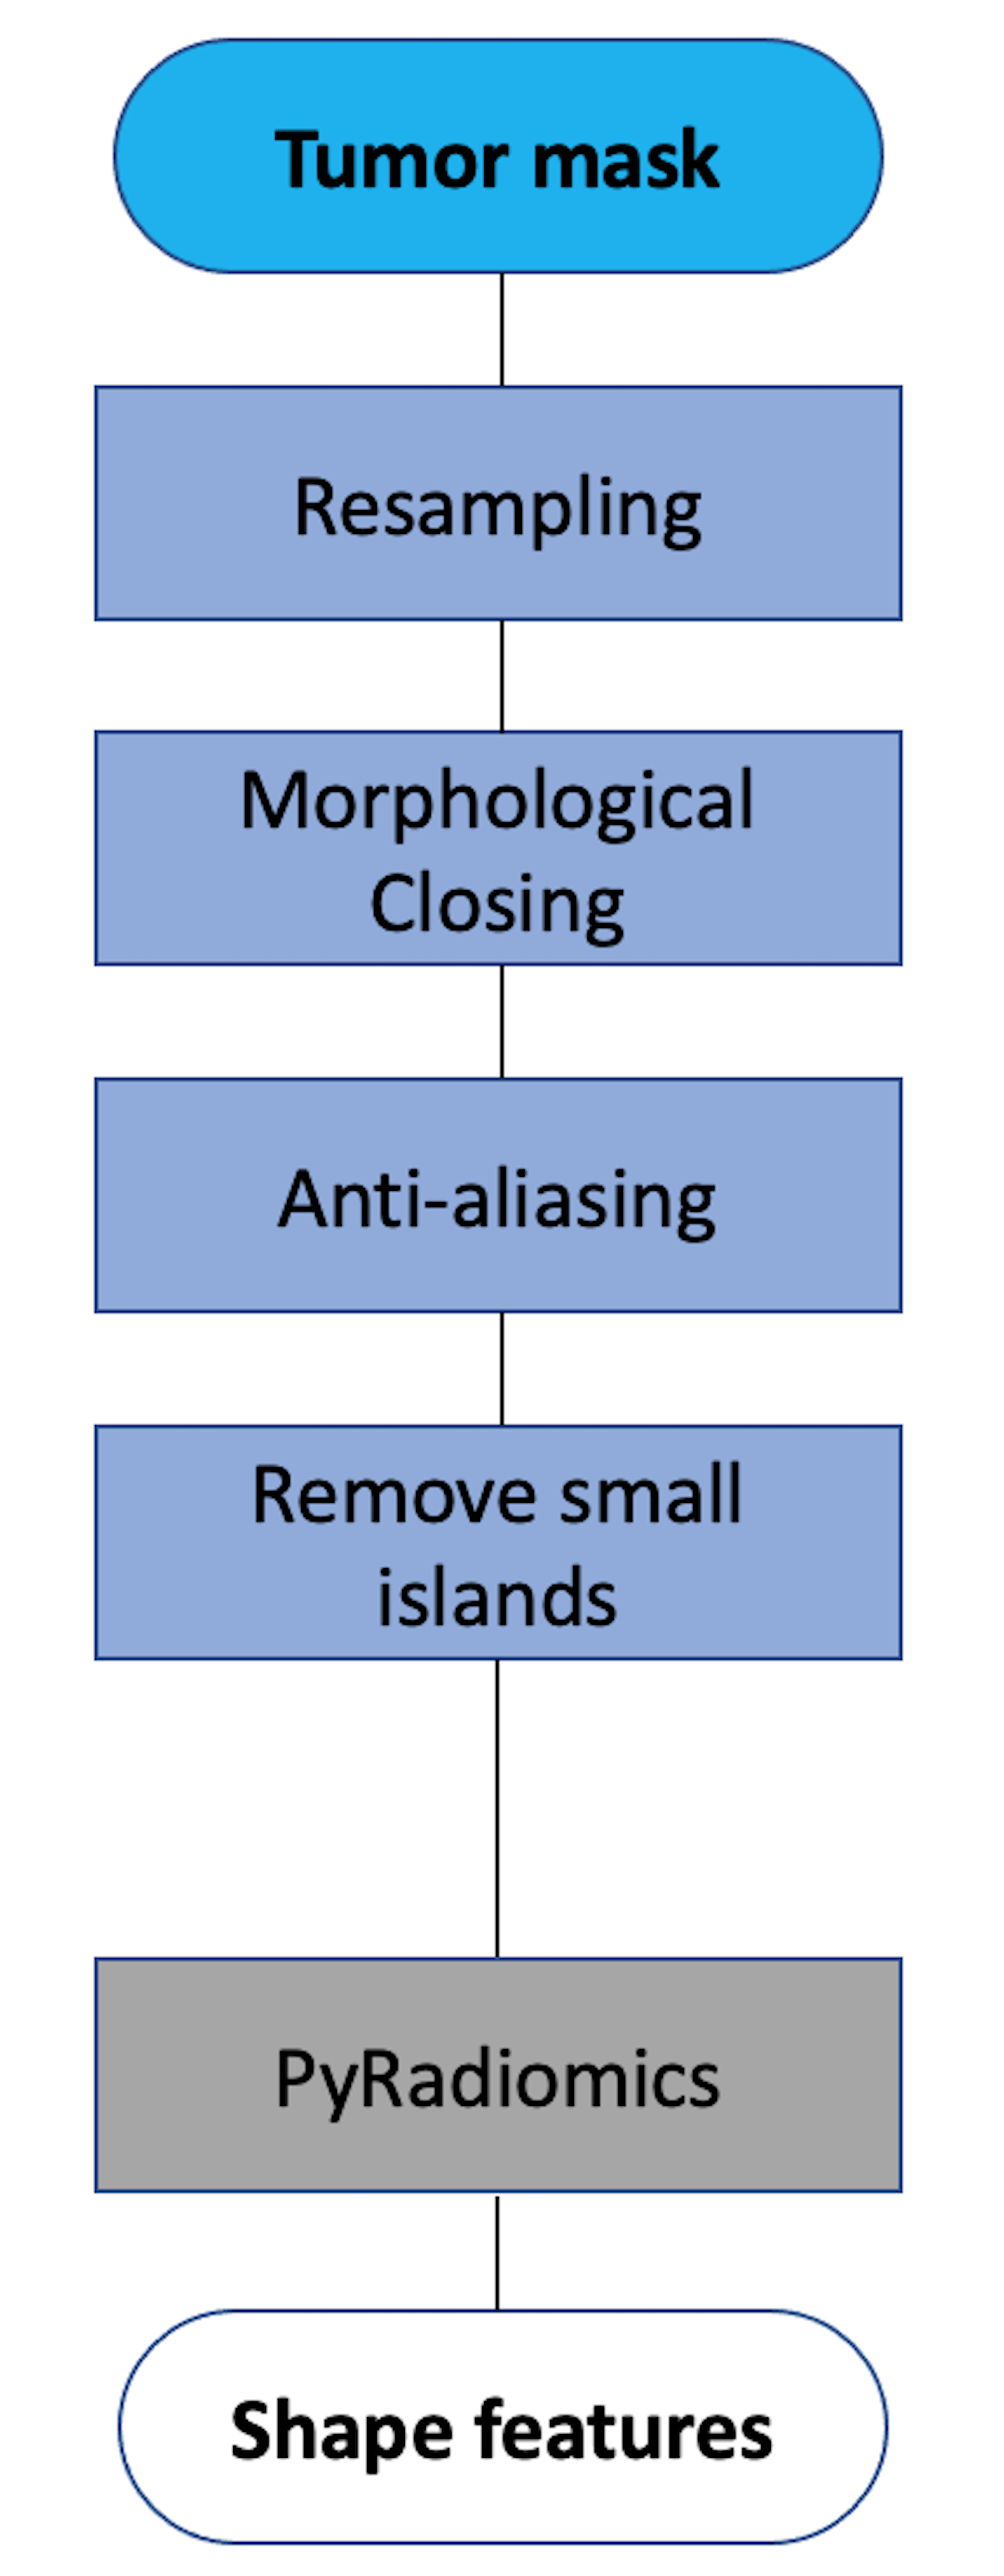
Fig. 1 Preprocessing steps for shape feature extraction.
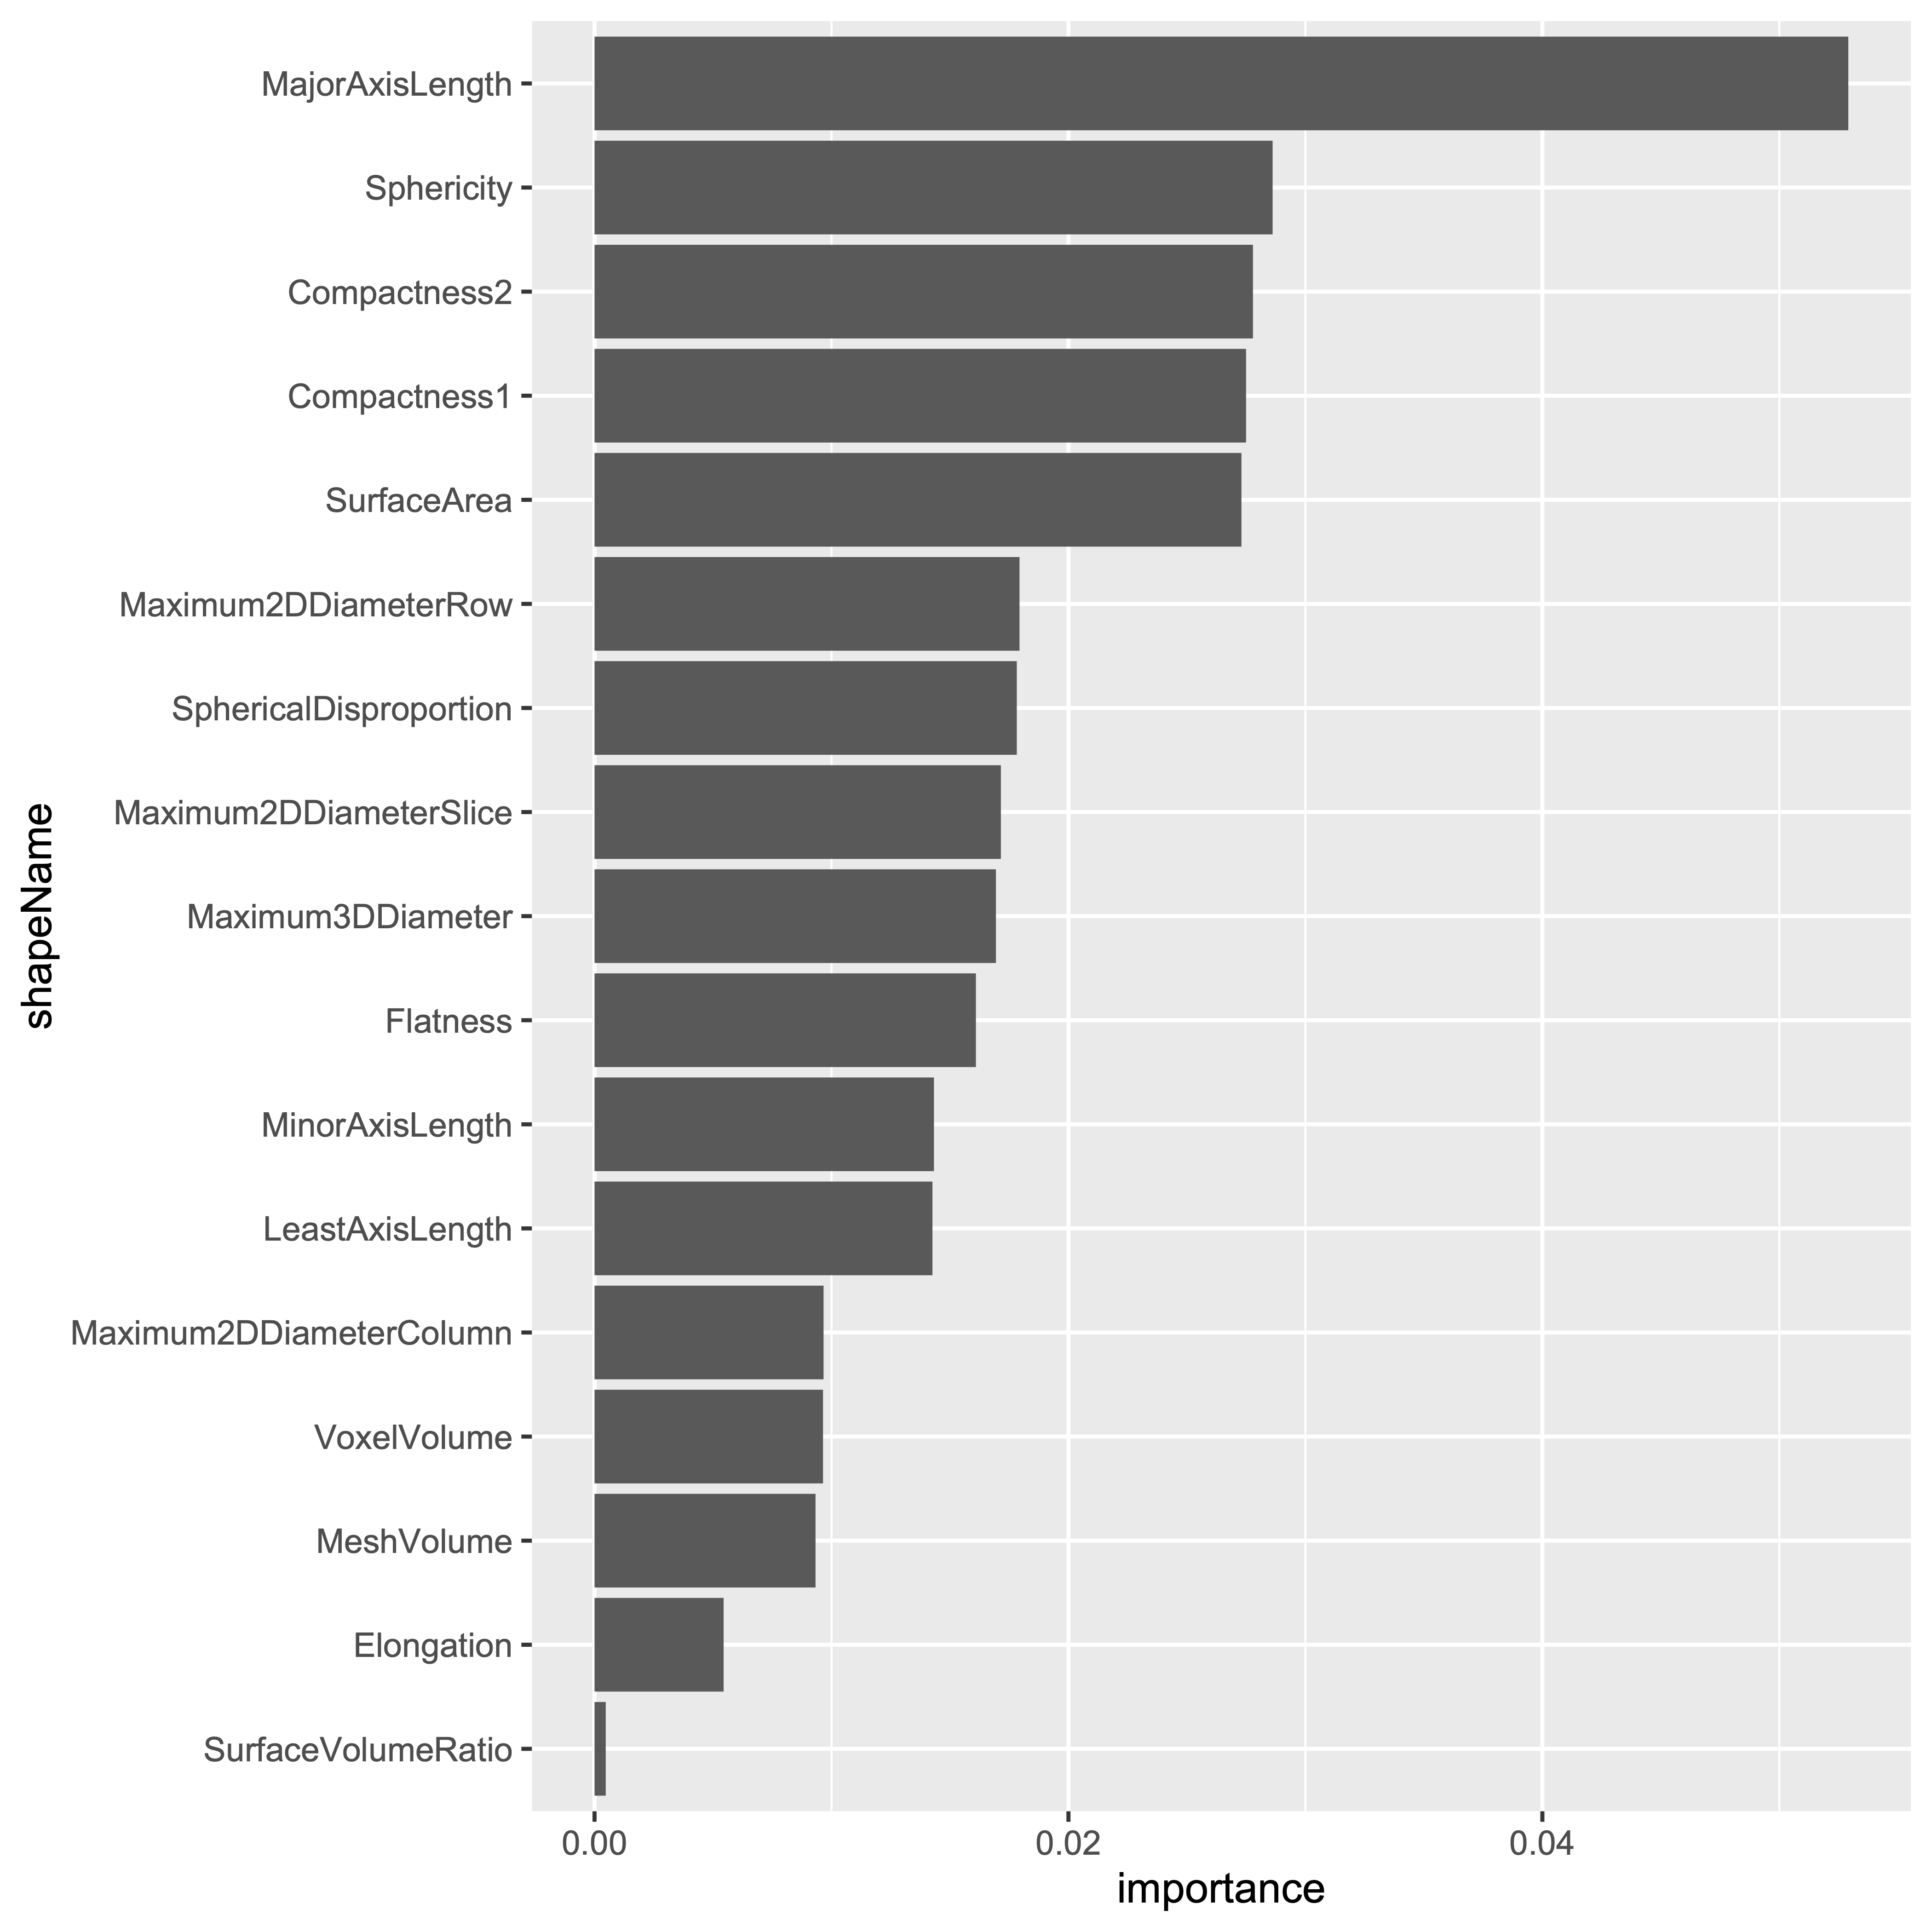
Fig. 2 Variable importance for 17 shape features to classify visually-assessed morphological patterns.
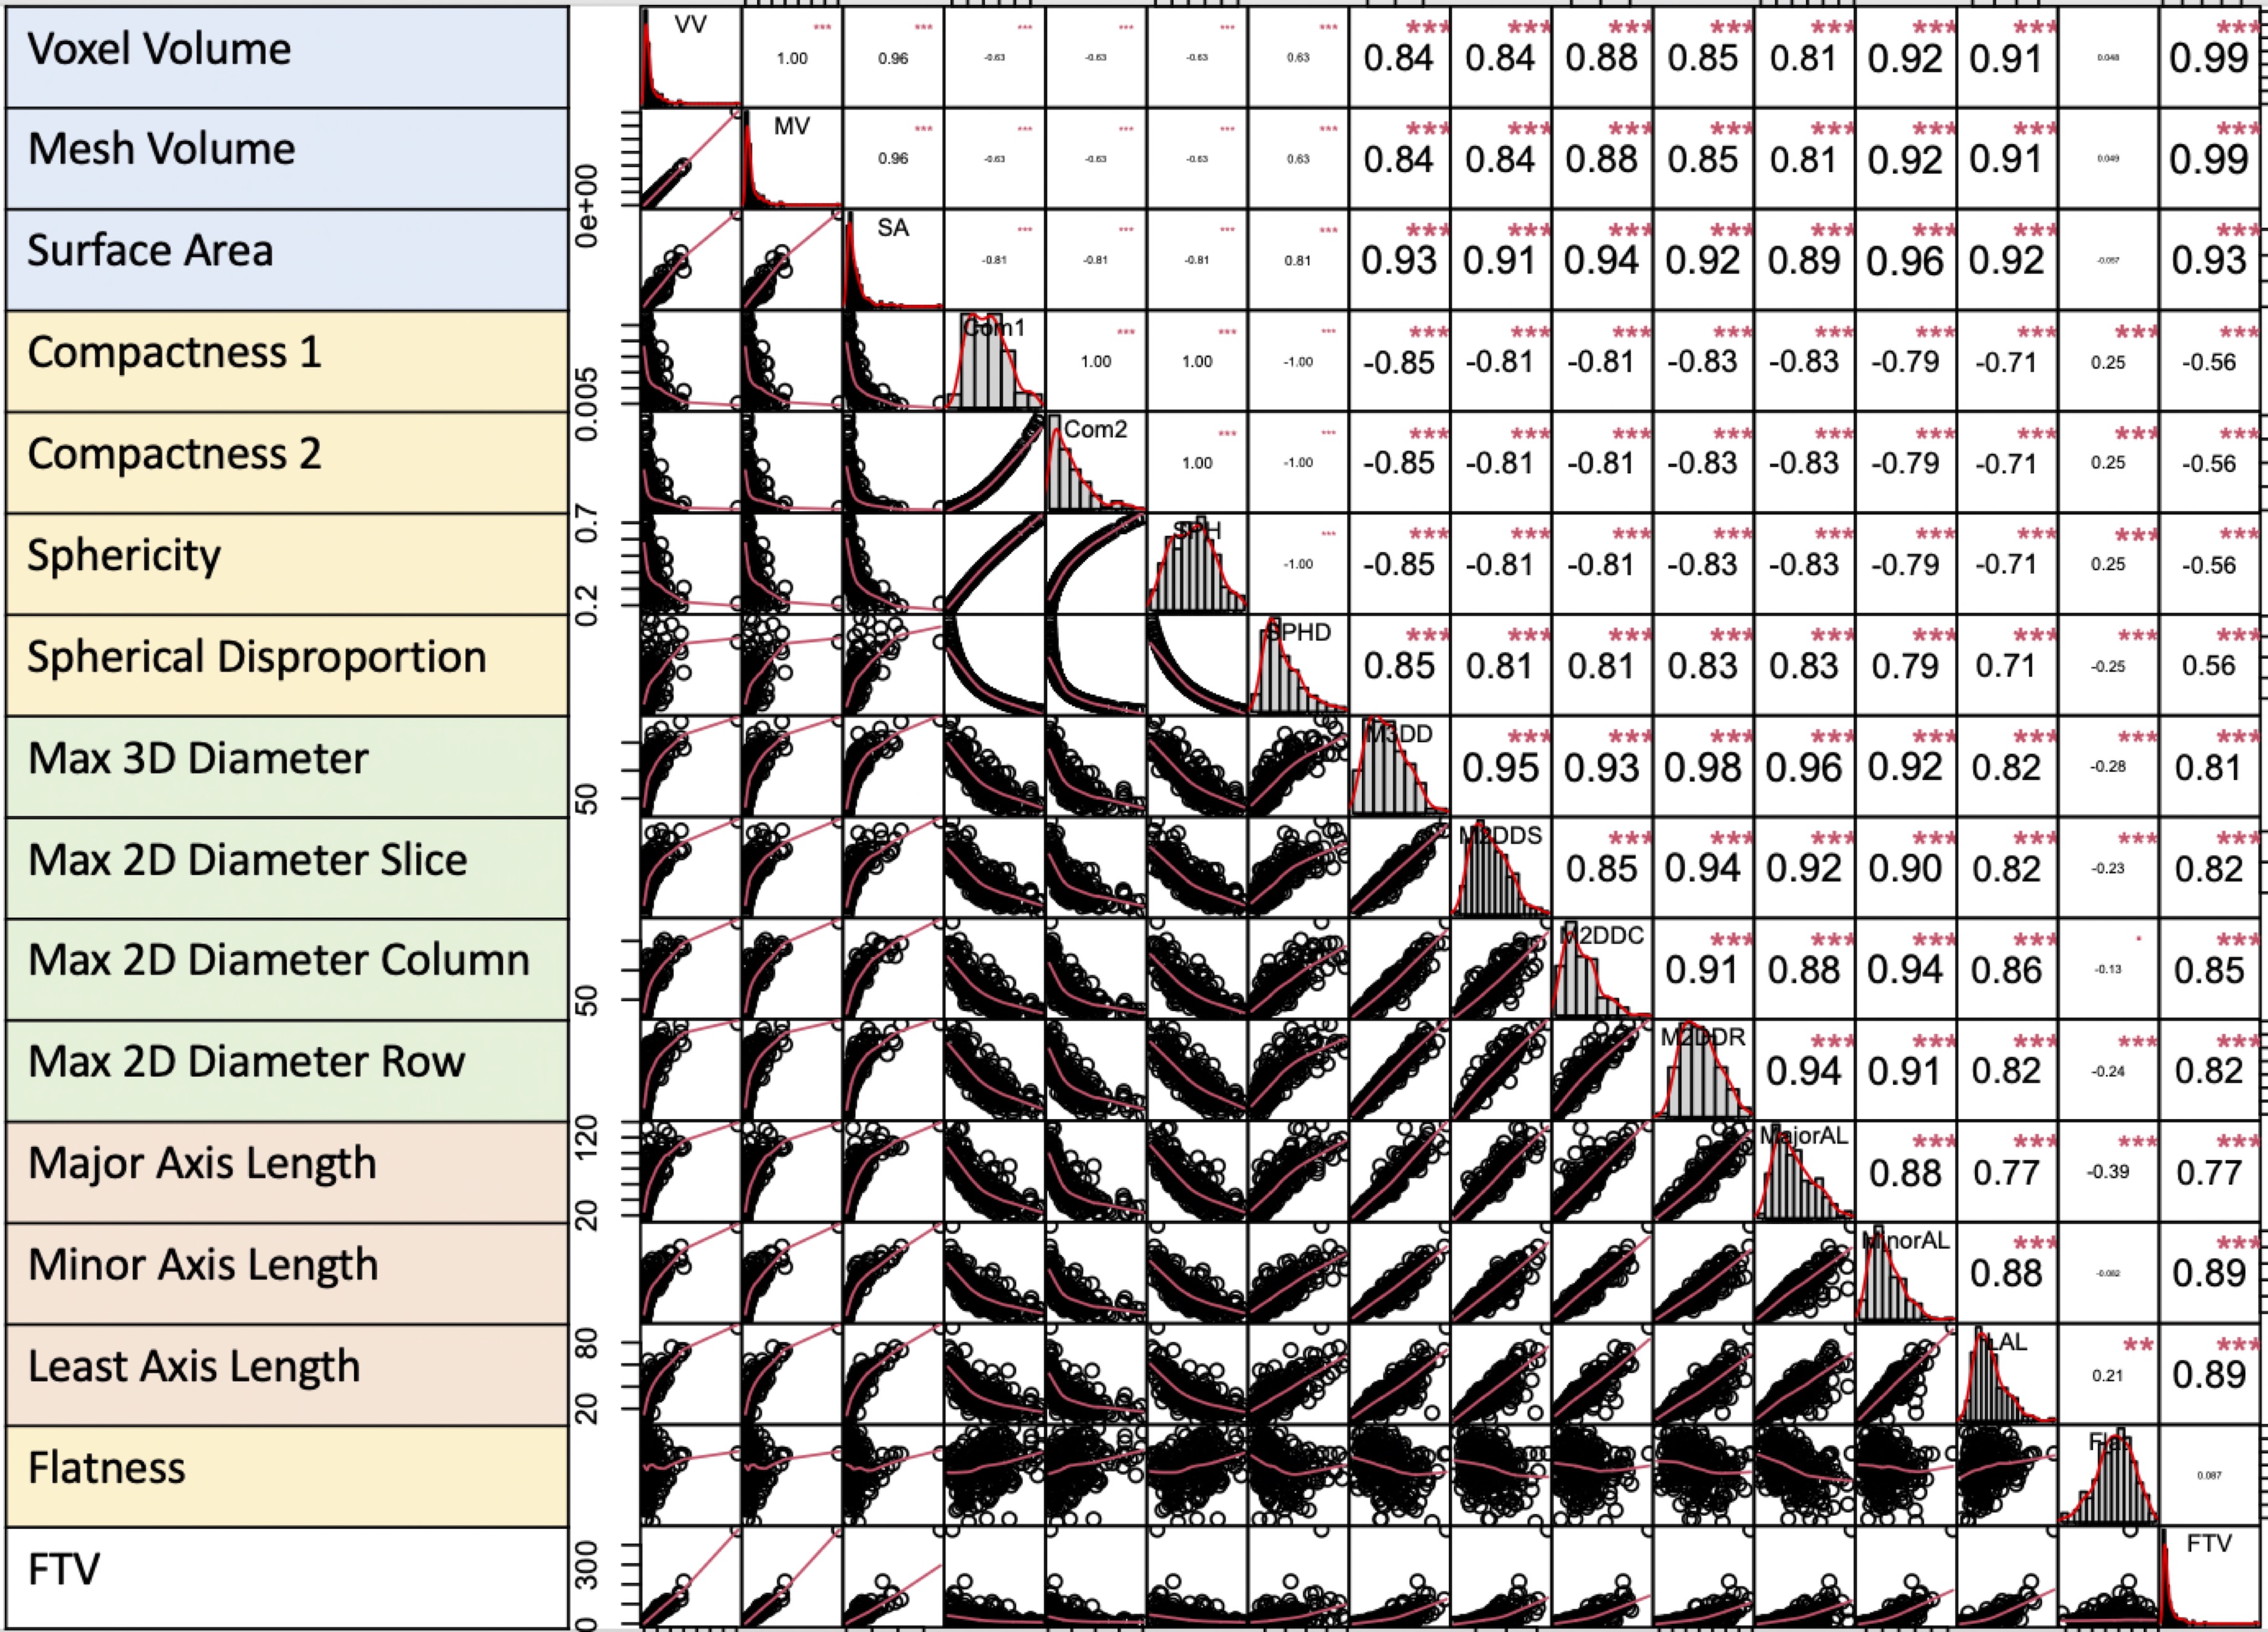
Fig. 3 Correlation map among FTV and shape features at T0.
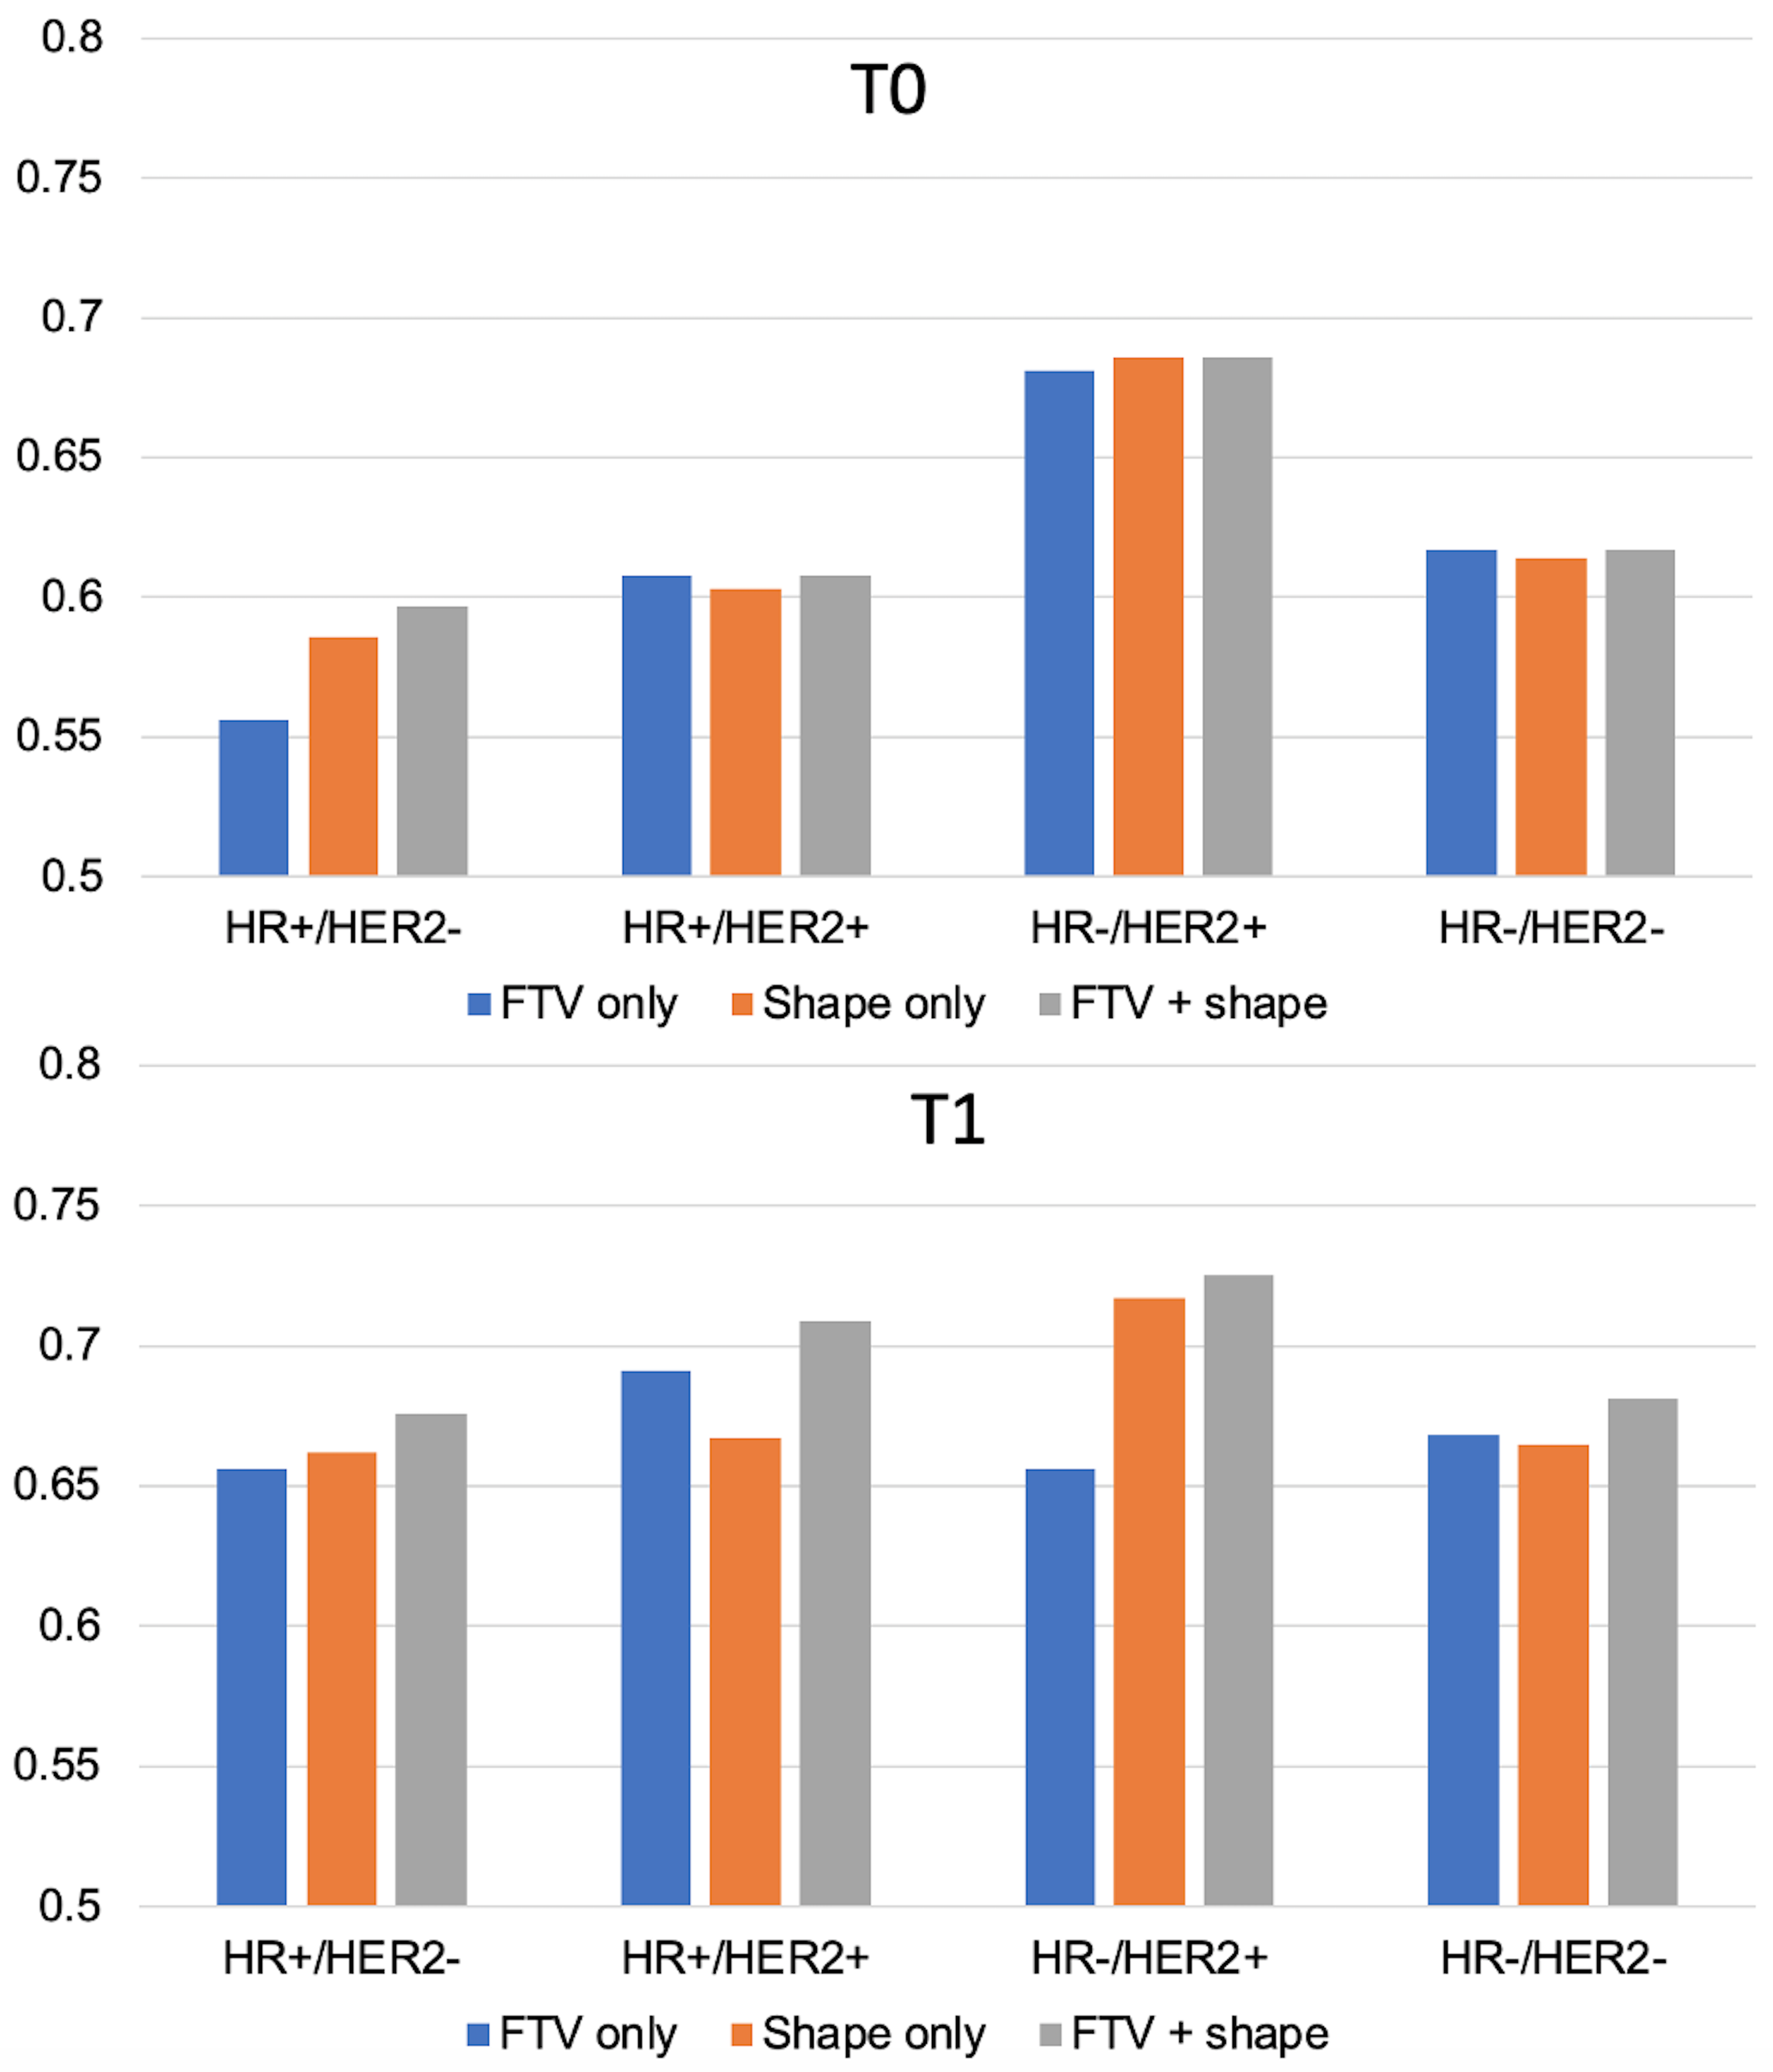
Fig. 4 AUCs for predicting pCR using logistic regression model at T0 (top) and T1 (bottom). The number of patients and pCR rate included in analysis at T0 were: 941 (35%), 368 (18%), 149 (39%), 81 (68%), 343 (43%) for full, HR+/HER2-, HR+/HER2+, HR-/HER2+, HR-/HER2- respectively. The numbers at T1 were: 904 (34%), 357 (18%), 142 (39%), 74 (66%), 331 (42%). FTV – functional tumor volume, HR – hormone receptor, HER2 – human epidermal growth factor receptor 2.
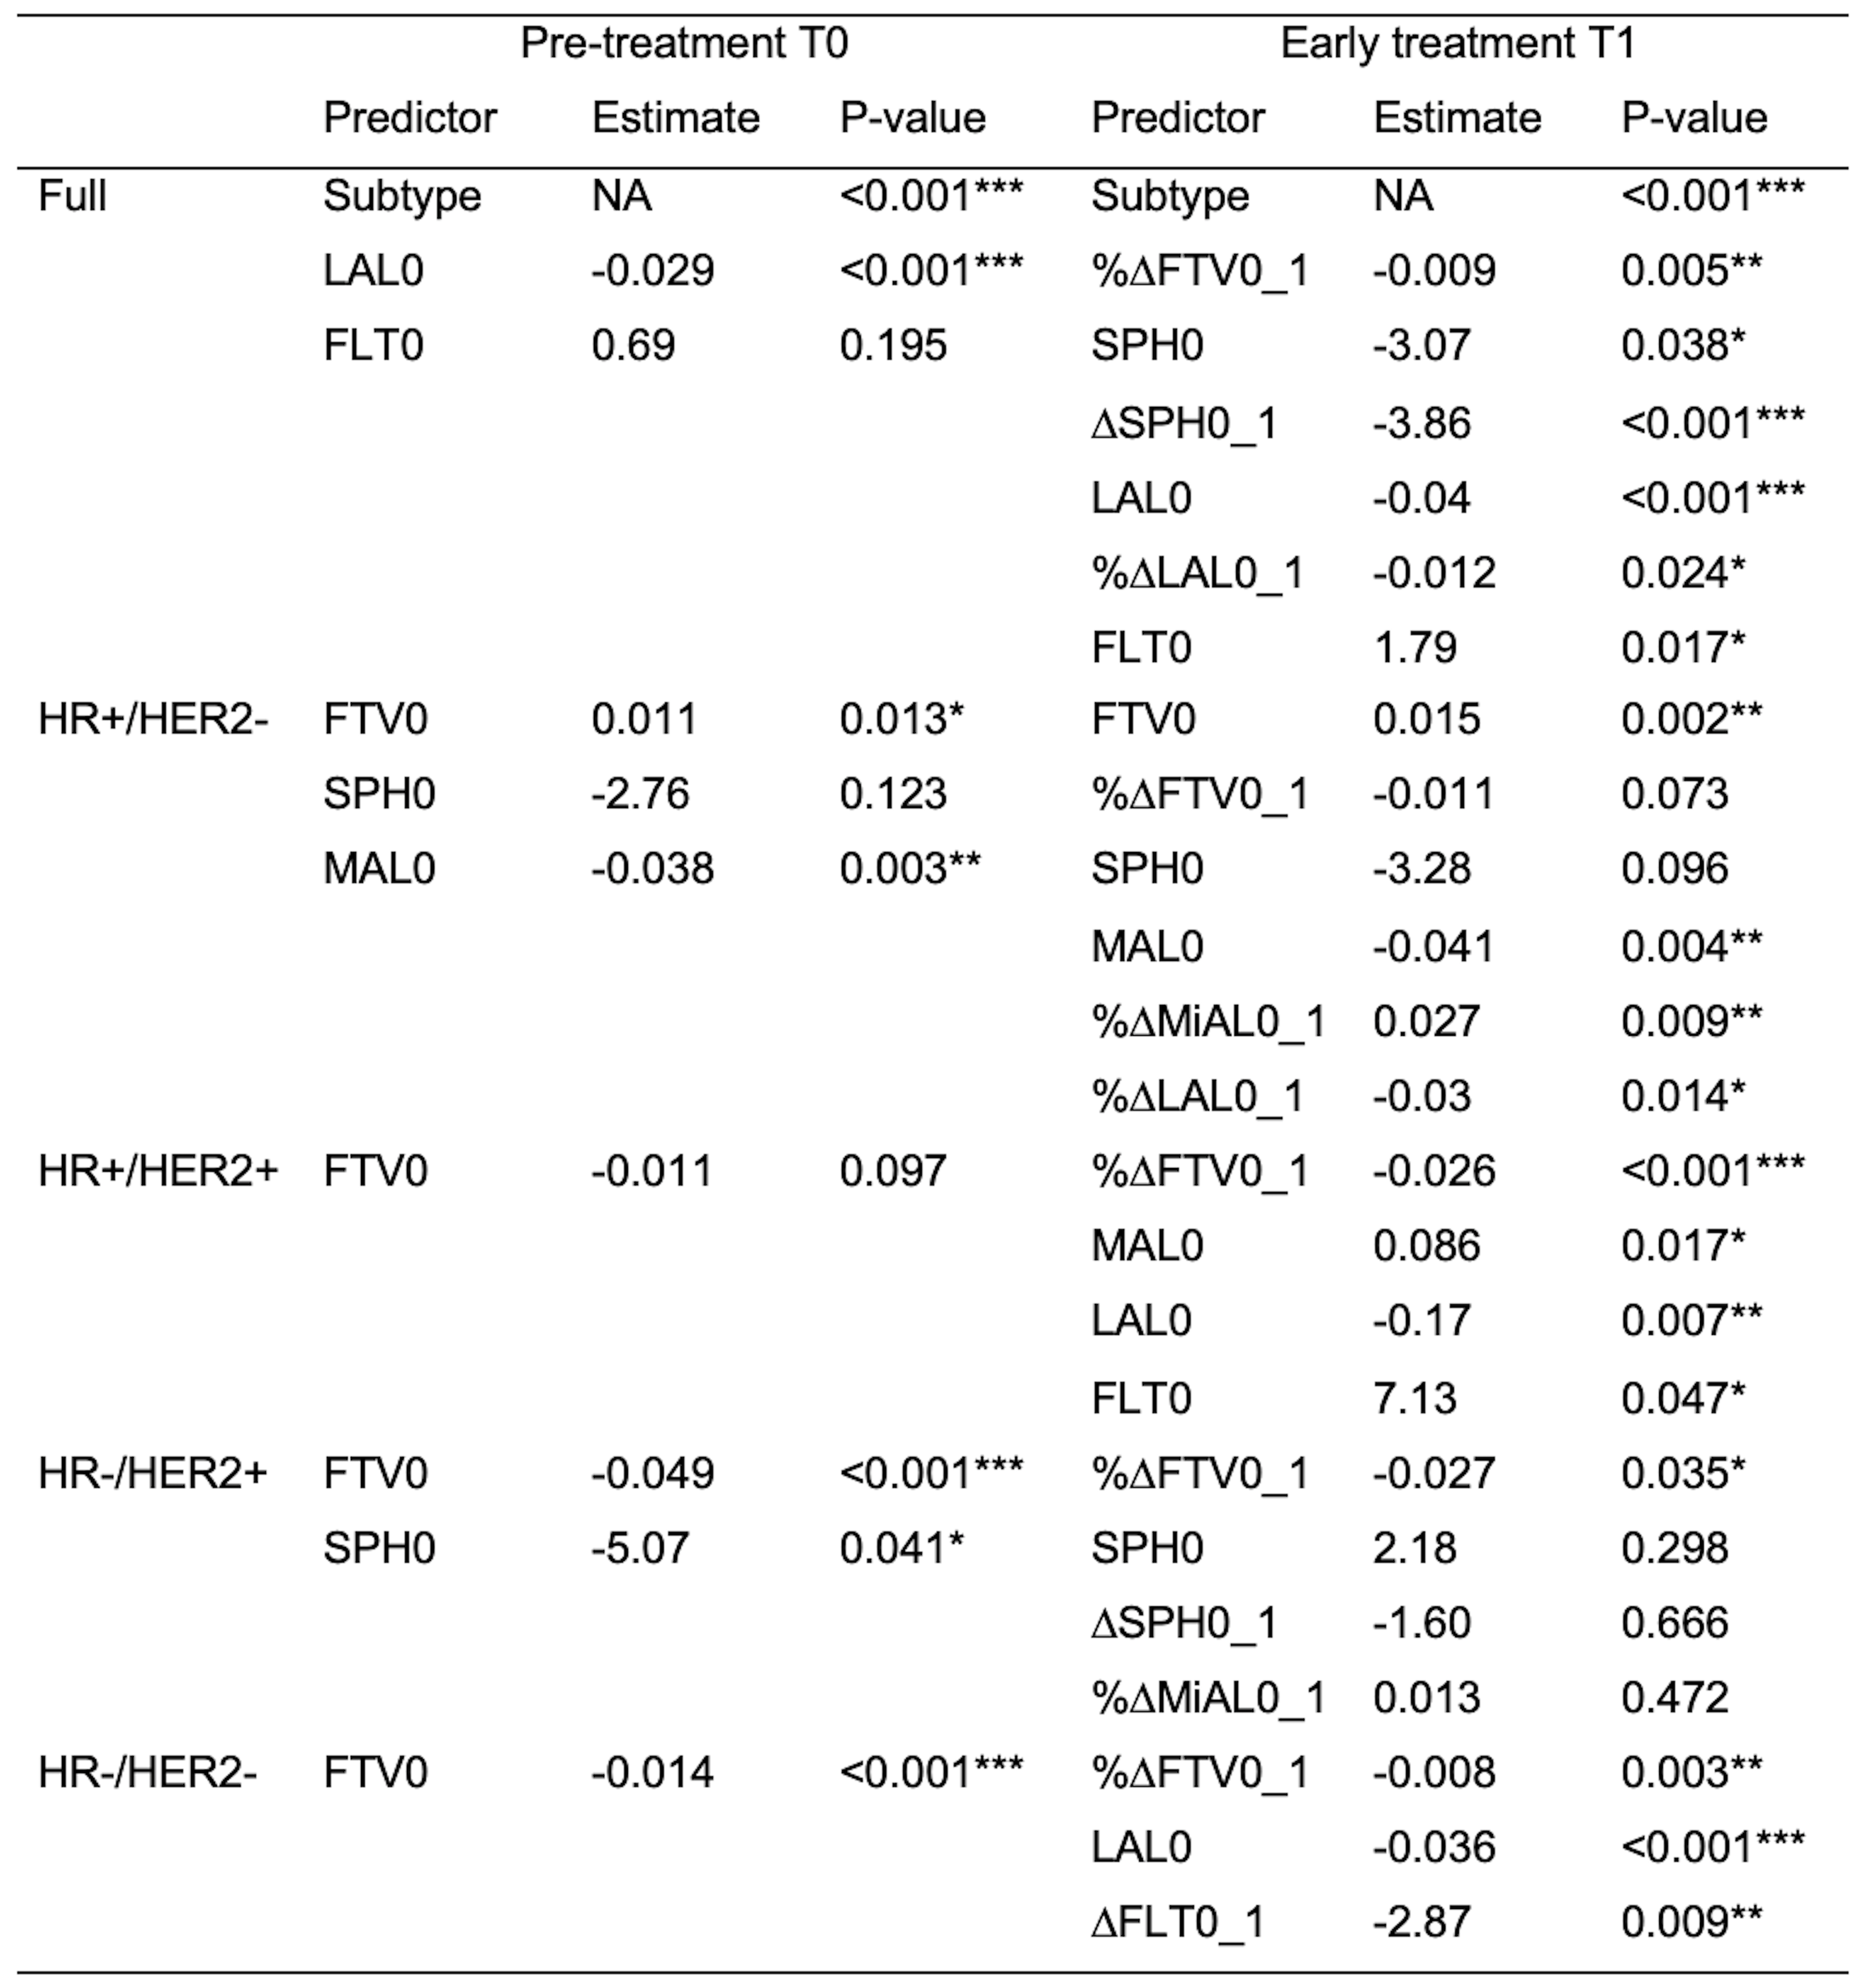
Table 1 Predictors included in each prediction model at pre-treatment T0 and early treatment T1. FTV0, %∆FTV0_1: baseline and change of functional tumor volume; SPH0, ∆SPH0_1: Baseline and change of sphericity; MAL0, %∆MAL0_1: baseline and change of major axis length; MiAL0, %∆MiAL0_1: baseline and change of minor axis length; LAL0, %∆LAL0_1: baseline and change of least axis length; FLT0, ∆FLT0_1: baseline and change of flatness; HR: hormone receptor; HER2: human epidermal growth factor receptor 2. ***: p<0.001, **: 0.001 p <0.01, *: 0.01 p < 0.05.