3001
Quantifying Efficiency and Variability of Clinical MRI Exams with Advanced Analytics Tools
Sheena Y Chu1, Scott B Reeder1,2,3,4,5, and John W Garrett1,3
1Department of Medical Physics, University of Wisconsin-Madison, Madison, WI, United States, 2Department of Medicine, University of Wisconsin-Madison, Madison, WI, United States, 3Department of Radiology, University of Wisconsin-Madison, Madison, WI, United States, 4Department of Biomedical Engineering, University of Wisconsin-Madison, Madison, WI, United States, 5Department of Emergency Medicine, University of Wisconsin-Madison, Madison, WI, United States
1Department of Medical Physics, University of Wisconsin-Madison, Madison, WI, United States, 2Department of Medicine, University of Wisconsin-Madison, Madison, WI, United States, 3Department of Radiology, University of Wisconsin-Madison, Madison, WI, United States, 4Department of Biomedical Engineering, University of Wisconsin-Madison, Madison, WI, United States, 5Department of Emergency Medicine, University of Wisconsin-Madison, Madison, WI, United States
Synopsis
By quantifying the efficiency and variability of clinic MRI exams, sources of potential improvement can be identified. An increase in efficiency and decrease in variability of MRI exams are essential to plan appropriate exam slot lengths, which can contribute to better patient access and reduced cost. Analytics are also essential to measure the impact on interventions to improve workflow. In this work we demonstrate the utility of analytics to identify inefficiencies in clinical MRI protocol in the context of MR enterography, a common abdominal MRI exam.
Introduction
The cost of MRI is determined primarily by the overall scheduled exam time which is determined by an exam slot that can accommodate the majority of exams for a specific protocol. Overall exam time includes image acquisition time, time between acquisitions, room turnaround time, and time for procedures such as the administration of medications and contrast. Both exam and room time variability are essential data to determine appropriate exam slot length, and to plan protocol refinements aimed at improving efficiency and variability.With increasing financial pressures and efforts to improve access to MRI there is a need for shorter and more efficient clinical MRI exams. Sources of inefficiency and variability can be identified by tracking and analyzing all aspects of the MRI exam. Metrics include total acquisition times, time between acquisitions, repeated acquisitions, time for related procedures, and room turnaround time.
Advanced analytics solutions can be used to measure utilization and variability to identify areas for potential improvement. Once workflow opportunities are identified, data derived from analytics tools can be used to facilitate to measure the impact of these changes on utilization and variability.
Thus, the purpose of this work is to develop analytics tools to measure the utilization of clinical MRI exams and demonstrate their utility to quantify exam efficiency and variability, as well as guide decision making to modify protocols. The utility and impact of these tools are demonstrated with a common abdominal MRI exam, MR enterography, used to evaluate patients with known or suspecting inflammatory bowel disease.
Methods
MRI Analytics ToolA Clarity extract in Epic (Verona, WI) was used to identify the relevant studies. Only patient scan time was accounted for, secondary reconstructions were not included. The resulting study list was loaded into PerformanceBridge (Philips, Best, Netherlands) and aggregated with the preloaded indexed DICOM header fields: Accession Number, Protocol Name, and DICOM Series Begin. The DICOM Series Begin is defined by the earliest acquisition time of an image in microseconds. The resulting study information was analyzed in Microsoft Excel and Python.
IRB Approval
Data were acquired retrospectively from the electronic health record (EHR) using PerformanceBridge after obtaining approval from the Institutional Review Board (IRB), which provided a waiver of informed consent.
MR Enterography Protocol Prior to Intervention
As outlined in Table 1, the one-hour MR enterography exam had nine series and two glucagon IV injections. Glucagon is used to reduce motion artifact from peristalsis, dosed at 0.5-1.0mg IV (weight based, split over two injections), and is injected over one minute. Additionally, 0.1 mmol/kg of gadobenate dimeglumine (Bracco Diagnostics) is used via injection at a rate of 2mL/sec followed by 20 mL of saline flush at the same rate.
Series data were acquired over a 1-year period (11/1/2018 to 10/30/2019) prior to intervention. Any data from incomplete exams were not included.
Intervention
Based on initial data collected, the glucagon injections were identified as a major source of inefficiency and variability. To address this, the two glucagon injections were consolidated to one, and the order of the sequences adjusted accordingly (Table 1). The new protocol also involved reordering the exam to acquire T1 weighted imaging immediately after glucagon, followed by T2 weighted imaging. The 3D SSFP acquisition was removed.
MR Enterography Protocol After Intervention
The MR enterography protocol workflow was changed in November 2019. Post-intervention data were collected over a second 1-year period (12/1/2019 to 11/30/2020). Data from November 2019 were not included to allow for the technologists to gain familiarity with the new protocol.
Statistical Analysis
At a protocol level, analysis included a variety of data shown in Table 2. The change in study duration was used to measure exam efficiency. The change in the standard deviation of the exam time was used to measure exam length variability.
Results
MRI Utilization of MR Enterography Prior to InterventionPrior to intervention, an MR enterography study required time from first image to last image, was 39 minutes with a standard deviation of 8 minutes. The two glucagon injections required on average 7 minutes each, and they had respective standard deviations of 3 minutes and 4 minutes.
MRI Utilization of MR Enterography After Intervention
After intervention, the study duration, on average, decreased by four minutes to 34 minutes, with the standard deviation remaining at 8 minutes. Total glucagon injection time decreased to an average of 9 minutes with a standard deviation of 5 minutes.
Discussion and Conclusion
In this work we developed an advanced analytics tool to quantitatively assess the utilization of clinical MRI exams. By tracking the overall exam efficiency and variability, we were able to assess sources of exam inefficiency and variability that contribute to the need for a long exam slot. In this study, we identified the use of two split glucagon injections as a major source of inefficiency and variability for clinical MR enterography exams. Through redesign of the enterography protocol, including migration to a single glucagon injection, we were able to reduce average exam time by 10%. While variability remained unchanged, we conclude that the application of analytics tools for assessment of MRI utilization is an objective strategy to make data driven decisions to improve efficiency and access.Acknowledgements
We wish to acknowledge support from GE Healthcare who provides research support to the University of Wisconsin. Dr. Reeder is a Romnes Faculty Fellow and has received an award provided by the University of Wisconsin-Madison Office of the Vice Chancellor for Research and Graduate Education with funding from the Wisconsin Alumni Research Foundation.References
No reference found.Figures
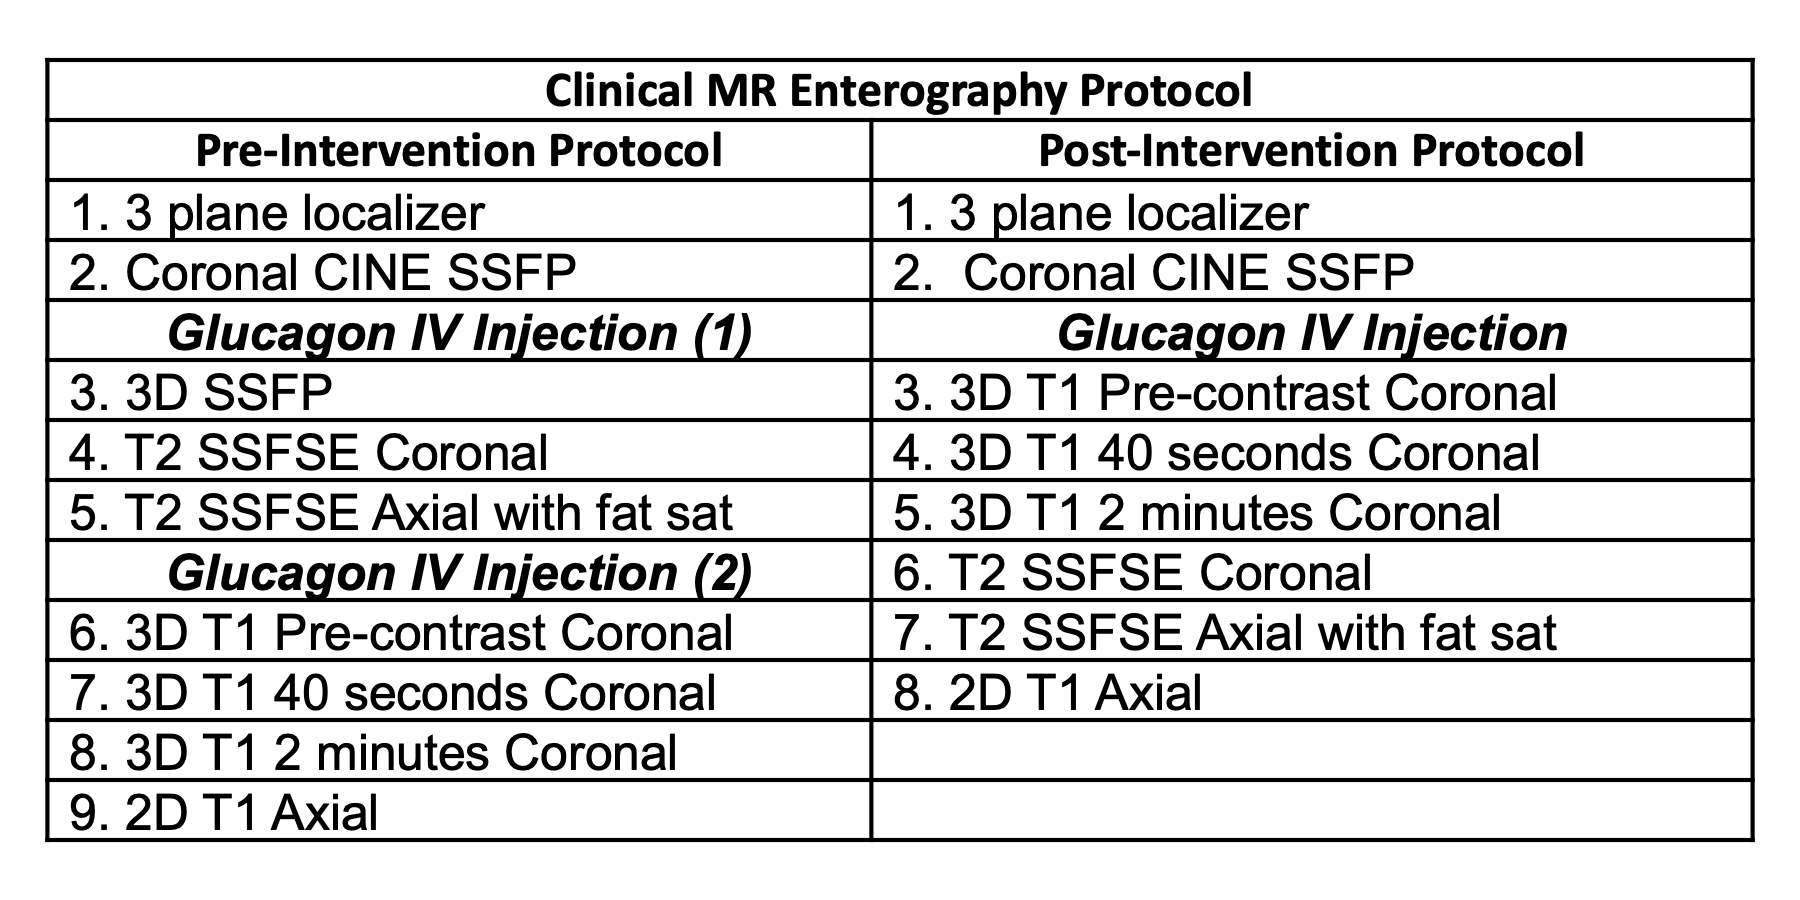
Table 1: MR enterography protocol before and after intervention
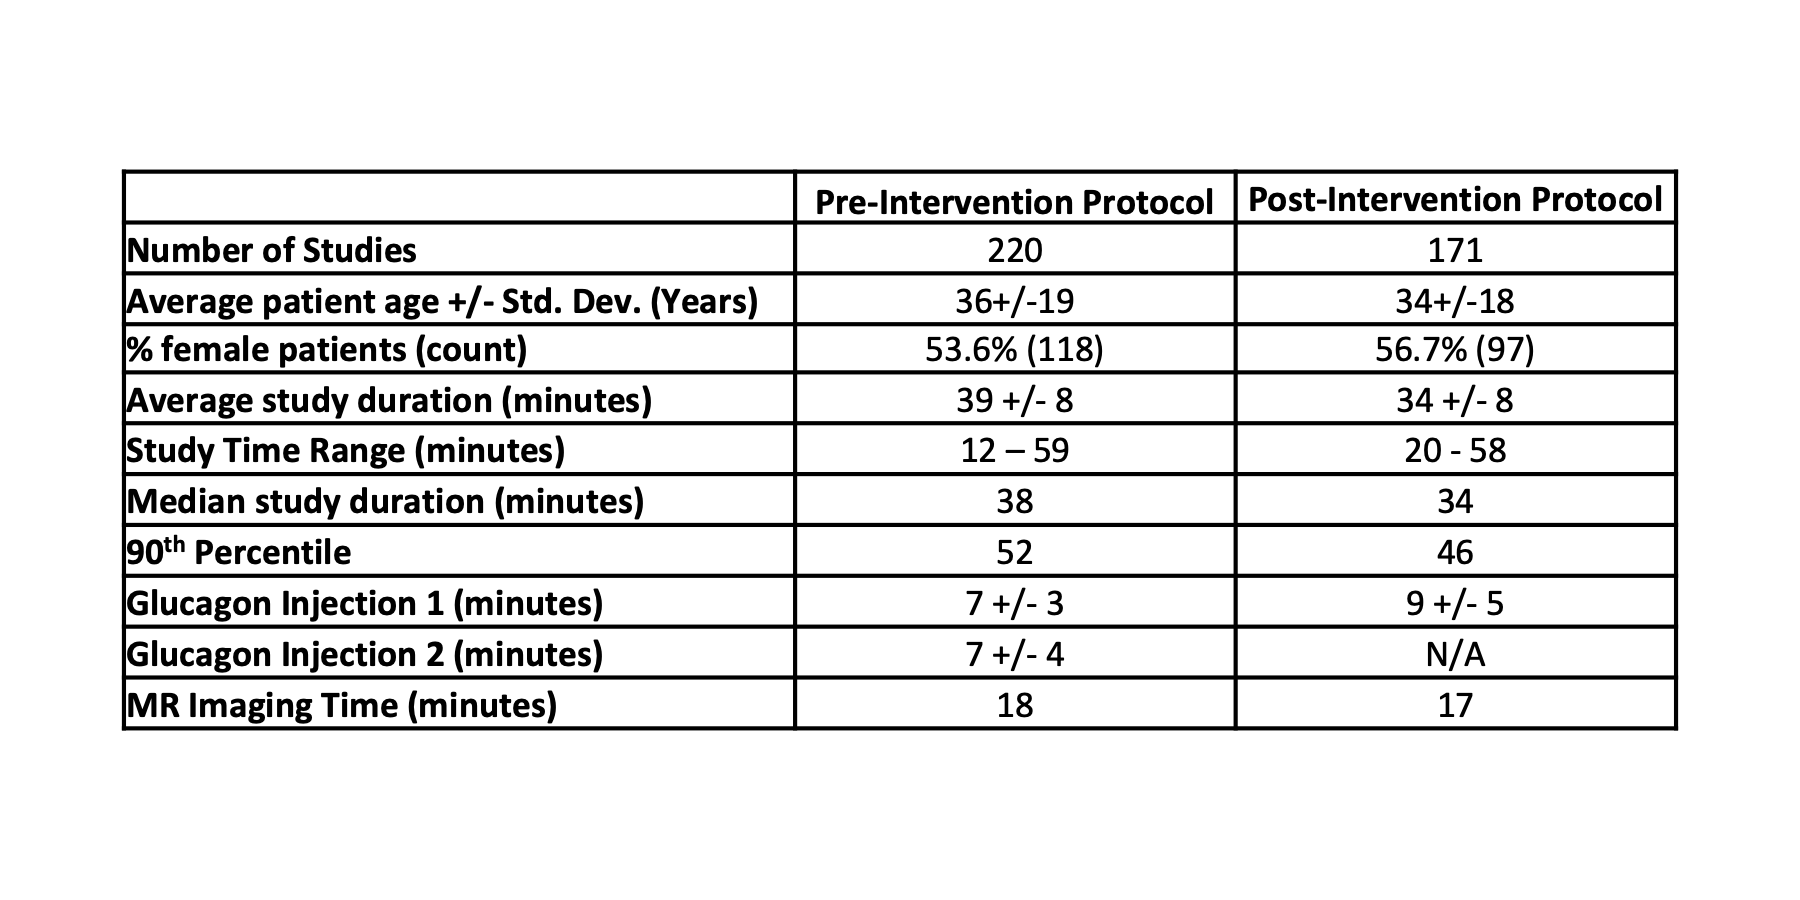
Table 2: The intervention led to an overall decrease in exam length and standard deviation, with a resulting increase in efficiency.