2995
Deep learning based kidney segmentation for high temporal resolution tracking renal size changes during sequential gas challenges1School of Biomedical Engineering, Southern Medical University, Guangzhou, China, 2Berlin Ultrahigh Field Facility (B.U.F.F.), Max Delbruck Center for Molecular Medicine in the Helmholtz Association, Berlin, Germany, 3Institute of Physiology, Charité - Universitätsmedizin Berlin, Berlin, Germany, 4Experimental and Clinical Research Center, a joint cooperation between the Charité Medical Faculty and the Max Delbrück Center for Molecular Medicine in the Helmholtz Association, Berlin, Germany
Synopsis
Fast renal volume changes during sequential gas challenges might indicate the dynamic balance between renal filtration and reabsorption. In the present work, a deep learning based semantic segmentation method is employed to monitor renal size changes.
Introduction
Renal size plays an important role in indicating renal disease progression, for example, in renal transplantation(1,2) and chronic kidney disease(3). Our previous work(4)demonstrated rapid T2* changes during hyperoxia-hypoxia-hyperoxia challenges which were accompanied by alterations in renal size. These fast renal size changes might indicate the dynamic balance between renal filtration and reabsorption under different renal oxygenation levels, which is connected with renal function(5). Recognizing this link detailing dynamic changes in renal size might provide additional information about renal function, and provide added value to physiological kidney system analysis(4). To approach this goal this work uses deep learning based semantic segmentation of the kidney to track changes in renal size using high-temporal-resolution T2* data sets.Method
MR experimentAll experimental details are provided in (4). In brief, anesthetized SD rats underwent 2 minutes hyperoxia(100%O2), followed by 10 minutes hypoxia(10%O2+90%N2) and finally by 10 minutes hyperoxia(100%O2). High temporal resolution T2* mapping (t=9 s) was applied to monitor renal T2* and anatomical information with 140 frames of T2* maps being obtained for each rat (n=10) were during the sequential gas challenge (total=22 min).
Kidney segmentation
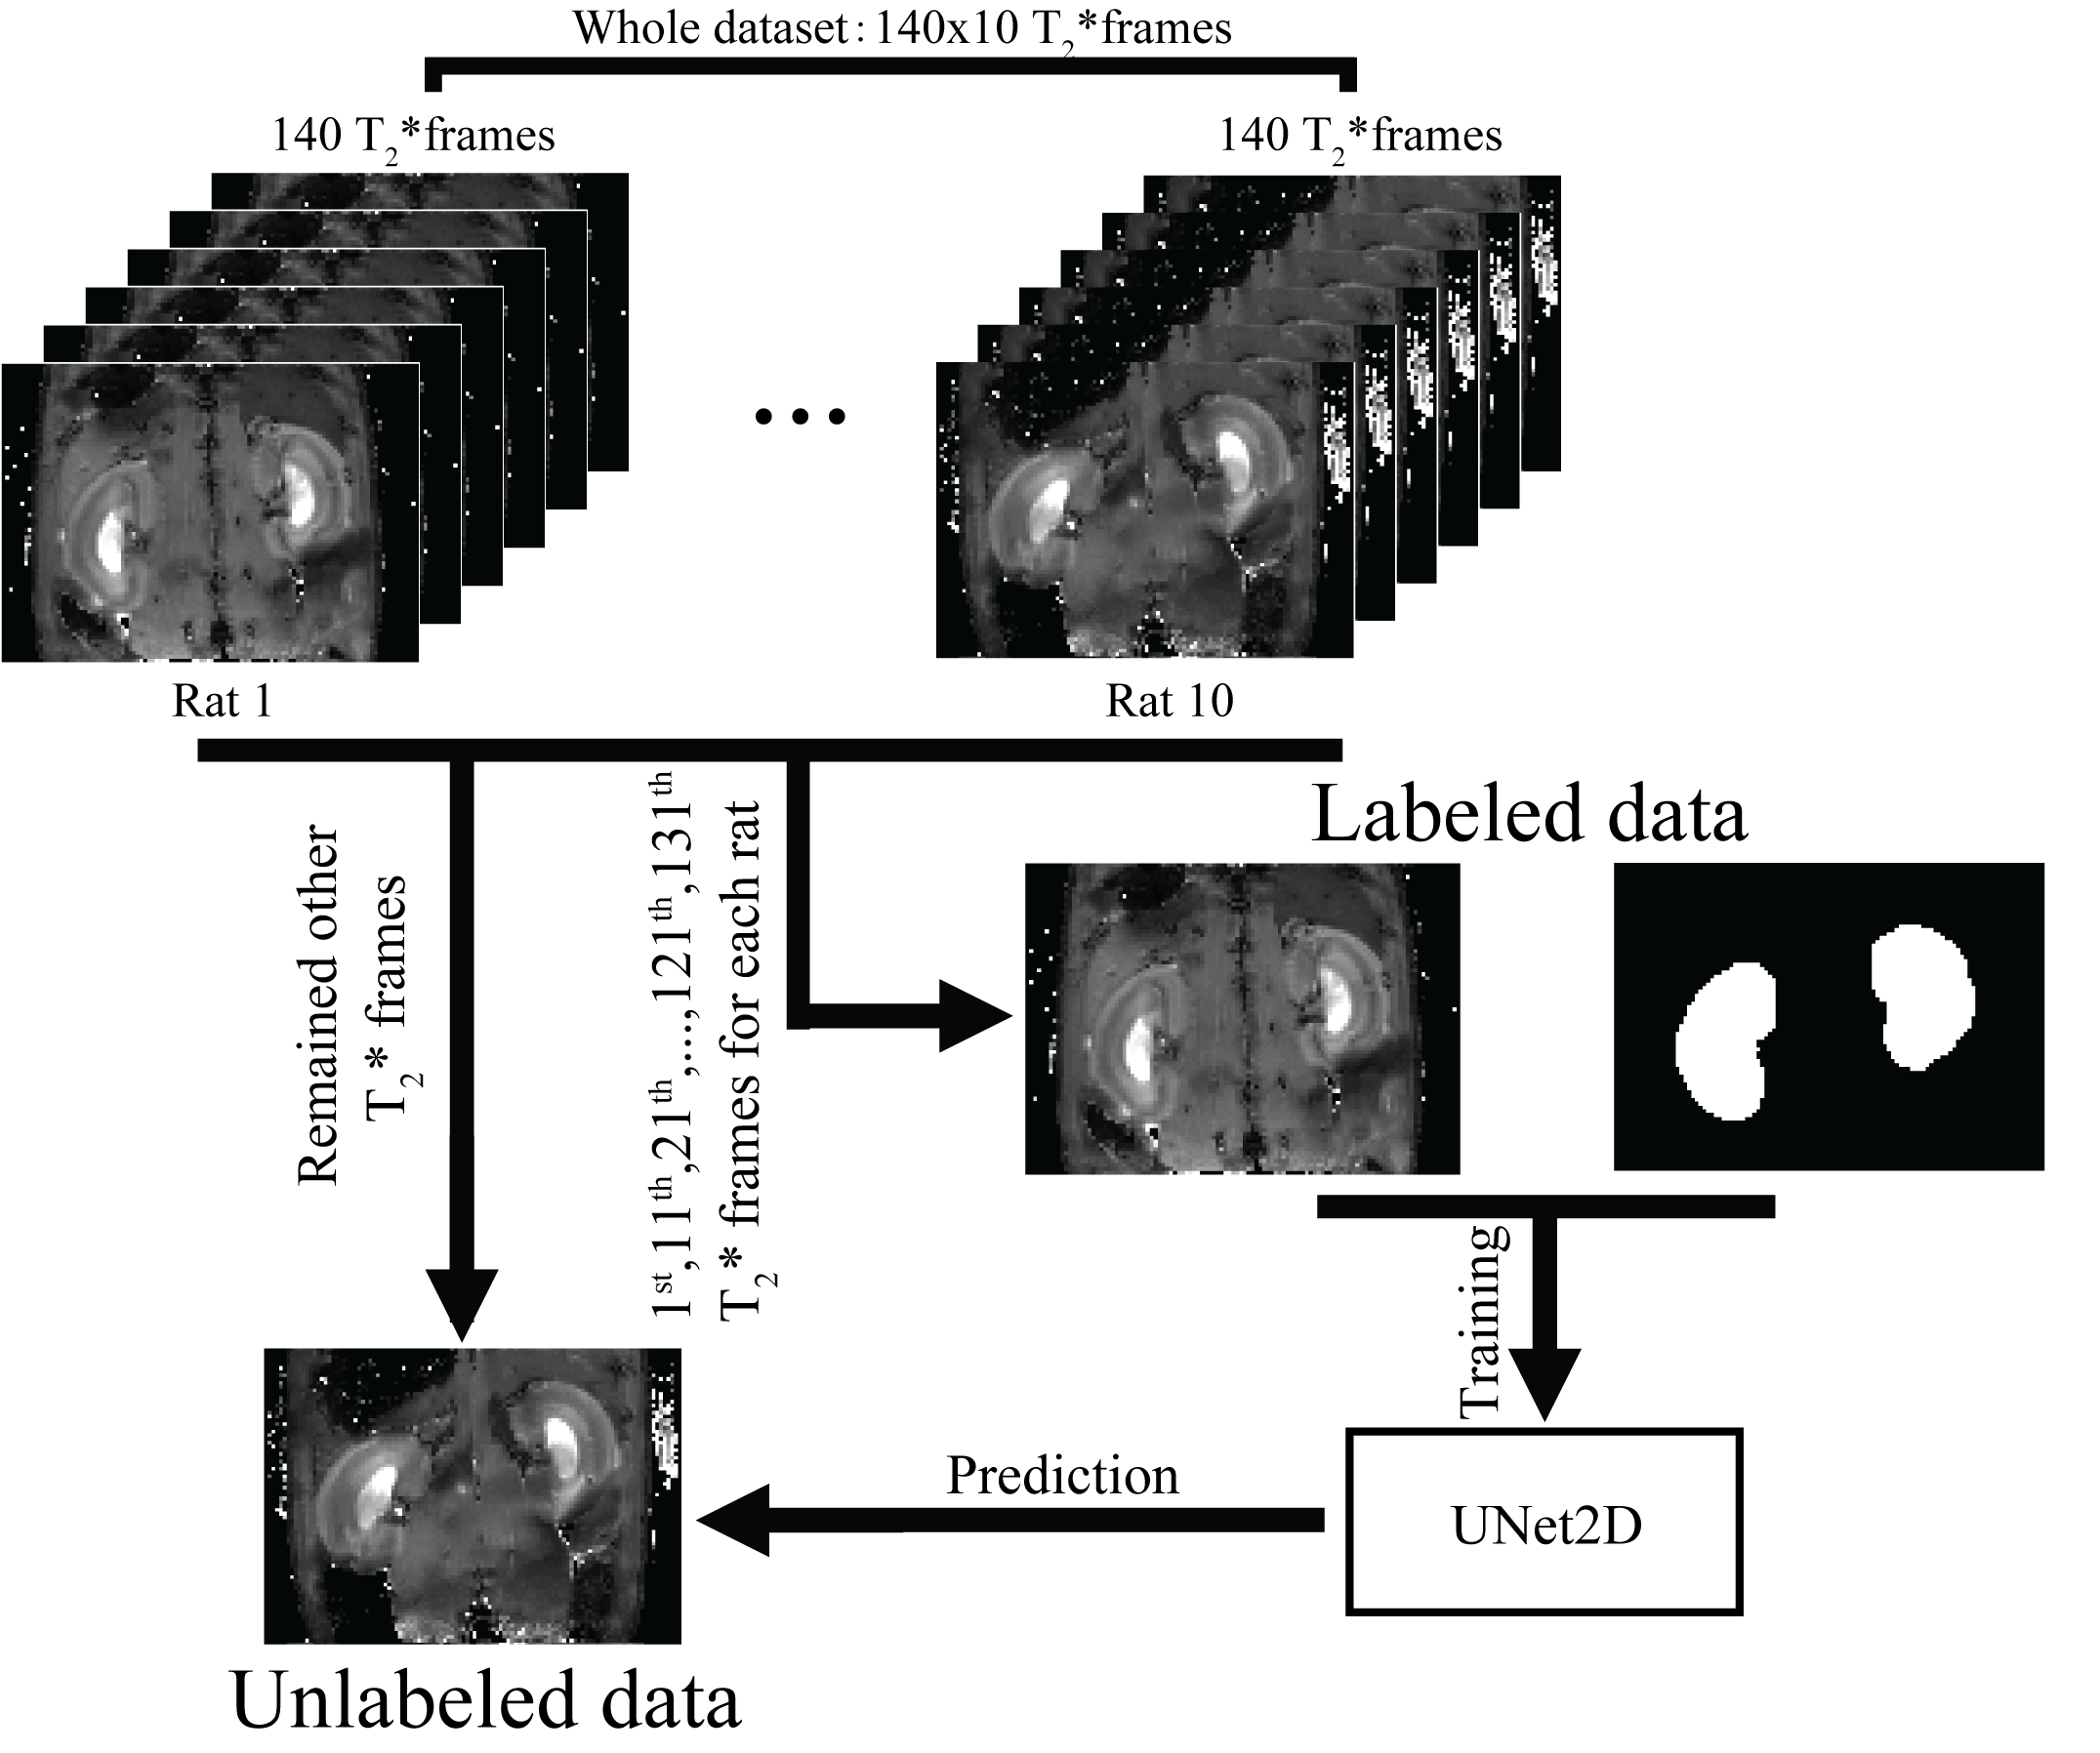
The flow chart of the present experiment is shown in Figure 1. A deep learning based semantic segmentation method, UNet2D(6) was employed for the segmentation of a mid-slice of the kidney.
Dataset-The 1st,11th,21th…,121th,131th frames of T2* map for each rat were enrolled for model training, and the remained frames kept for prediction. Finally, the whole dataset is separated into a 140 (=14 frames*10 rat) “labeled” T2* maps which were used for model training and 1260 (=126*10) “unlabeled” T2* maps which were used for prediction.
Model training- The model training is implemented by using the Tensorflow framework (Tensorflow 2.0) on a GPU(TITAN X). Before model training, all the data were first normalized to zero-mean and standard deviation (i.e. $$$\frac{x-mean}{std.}$$$). In the training process, Adam optimizer(7)with cosine decay(8) learning rate schedule(initial learning rate = 0.05) was employed to optimize the Dice loss(9), the training epochs = 2000, dropout rate = 0.5, standard data augmentation, such as random horizontal flip, random rotation, random horizontal and vertical shift, random brightness changes, random shearing, random zoom-in or zoom-out and add Gaussian noise (zero-mean and 0.1 of standard deviation).
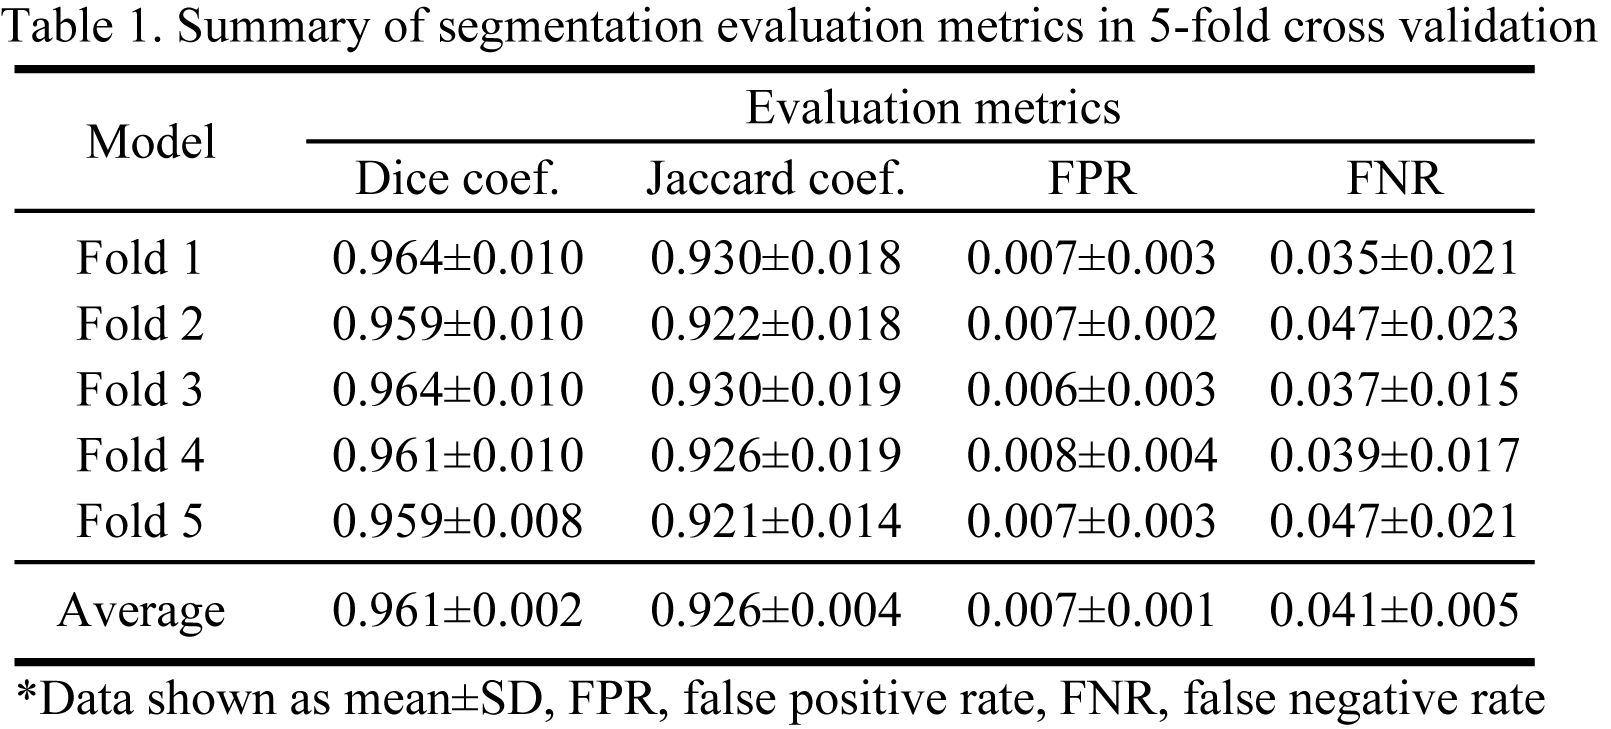
Model evaluation-To evaluate the segmentation performance of the UNet, 5-fold cross-validation (separation based on the rat) was performed and the metrics of Dice coefficient, Jaccard coefficient, false positive rate and false negative rate were measured.
Mask prediction-All 5 models from the 5-fold cross-validation were employed on the prediction of masks on “unlabeled” T2* maps and the mean predictions of the 5 models were considered as final mask. Renal size was calculated as the sum over the final mask.
Results
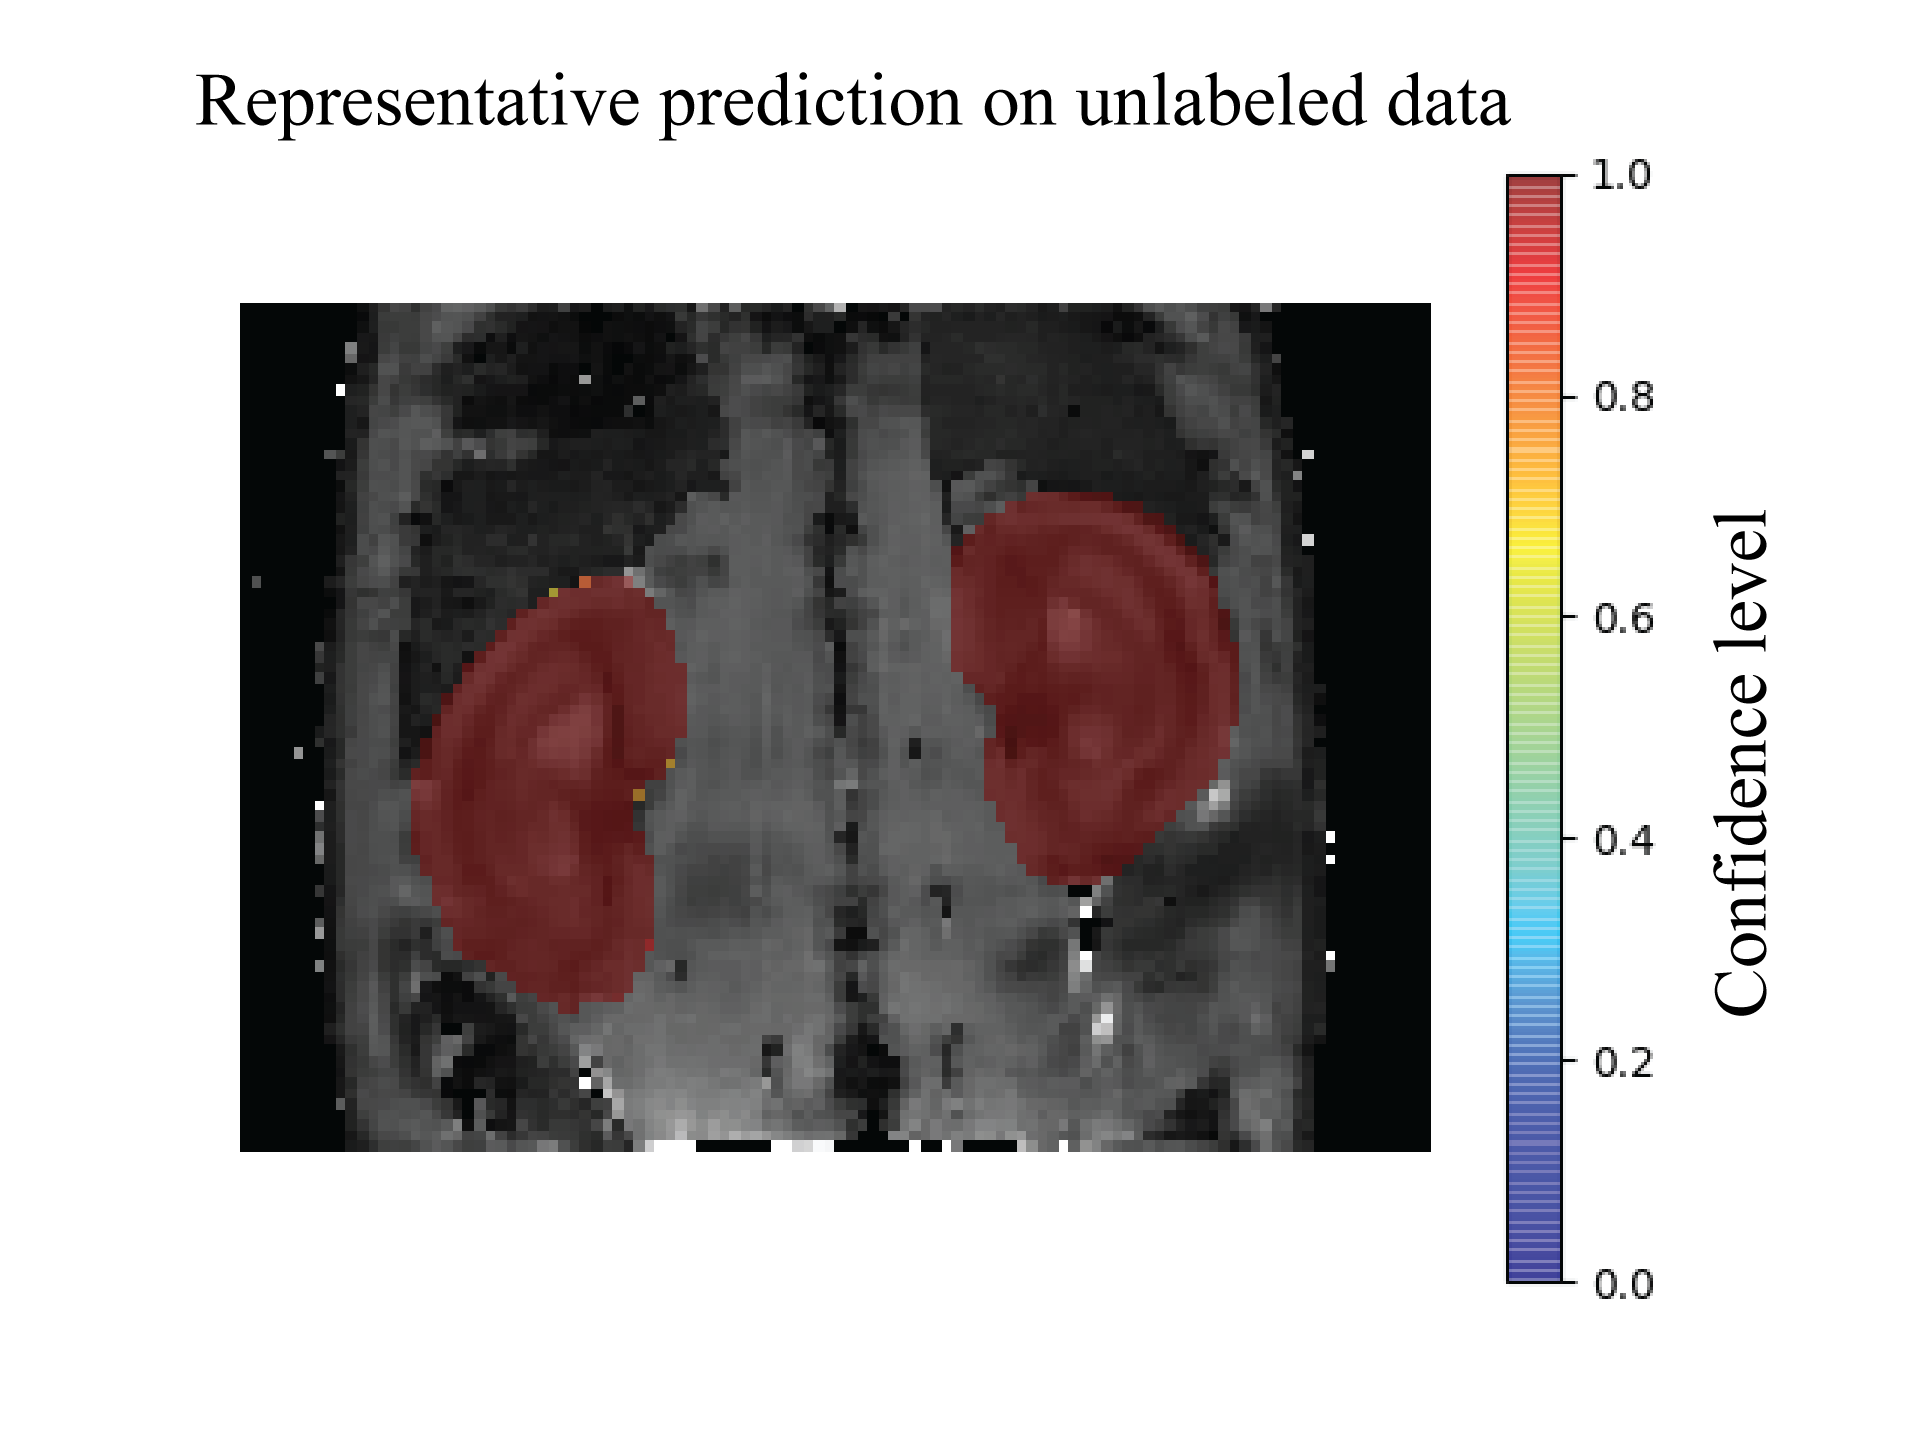
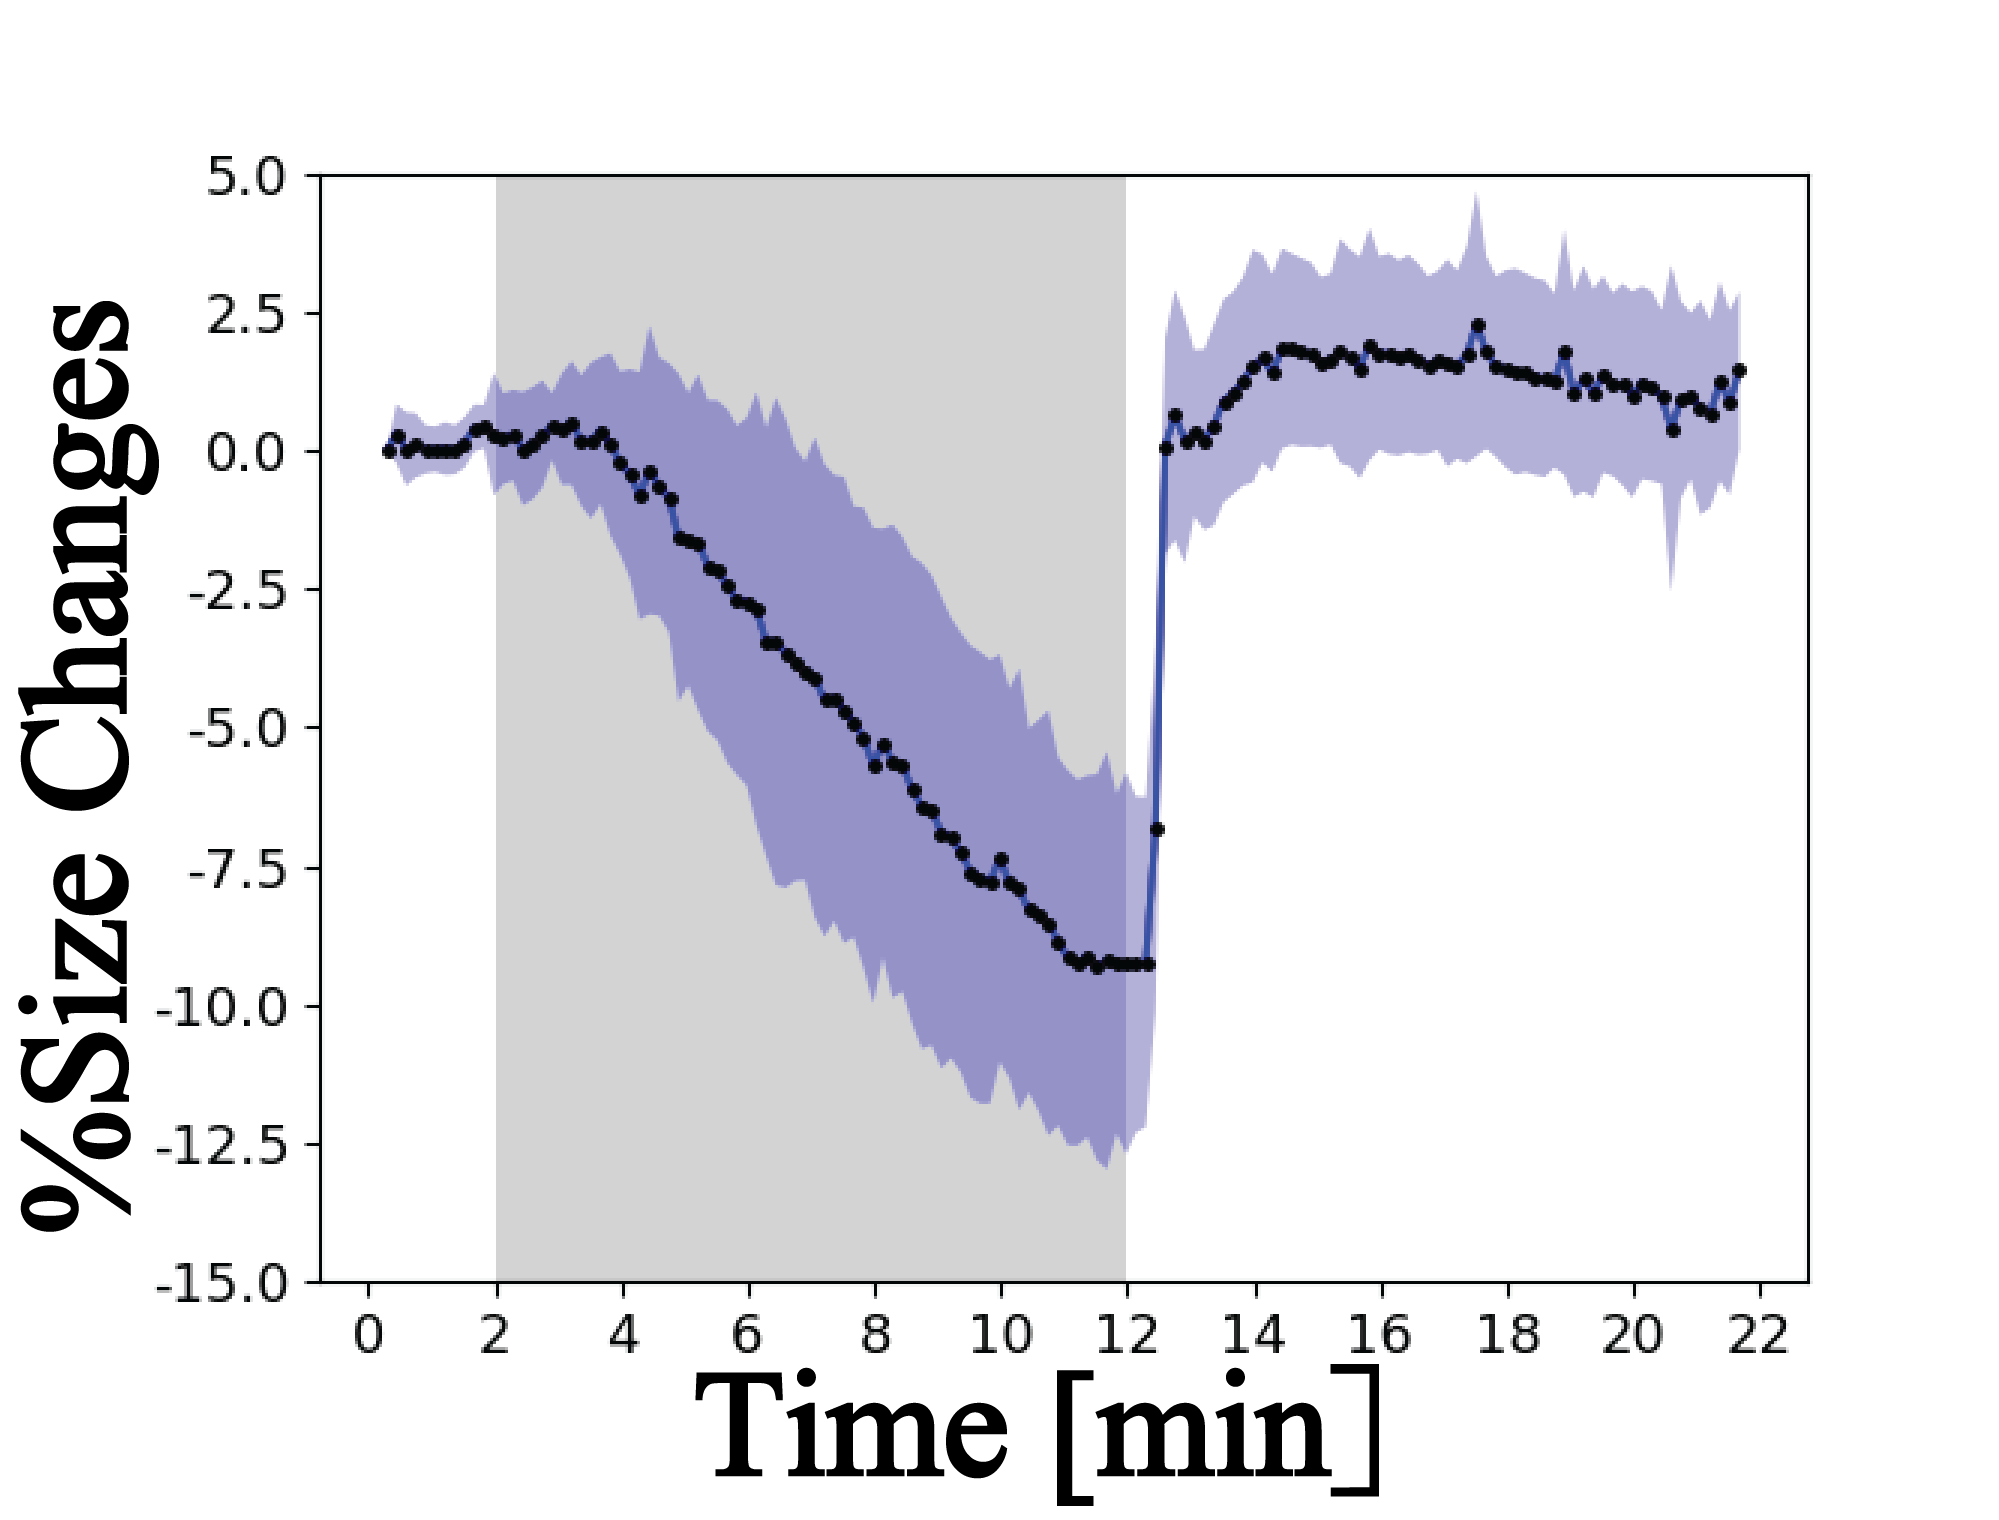
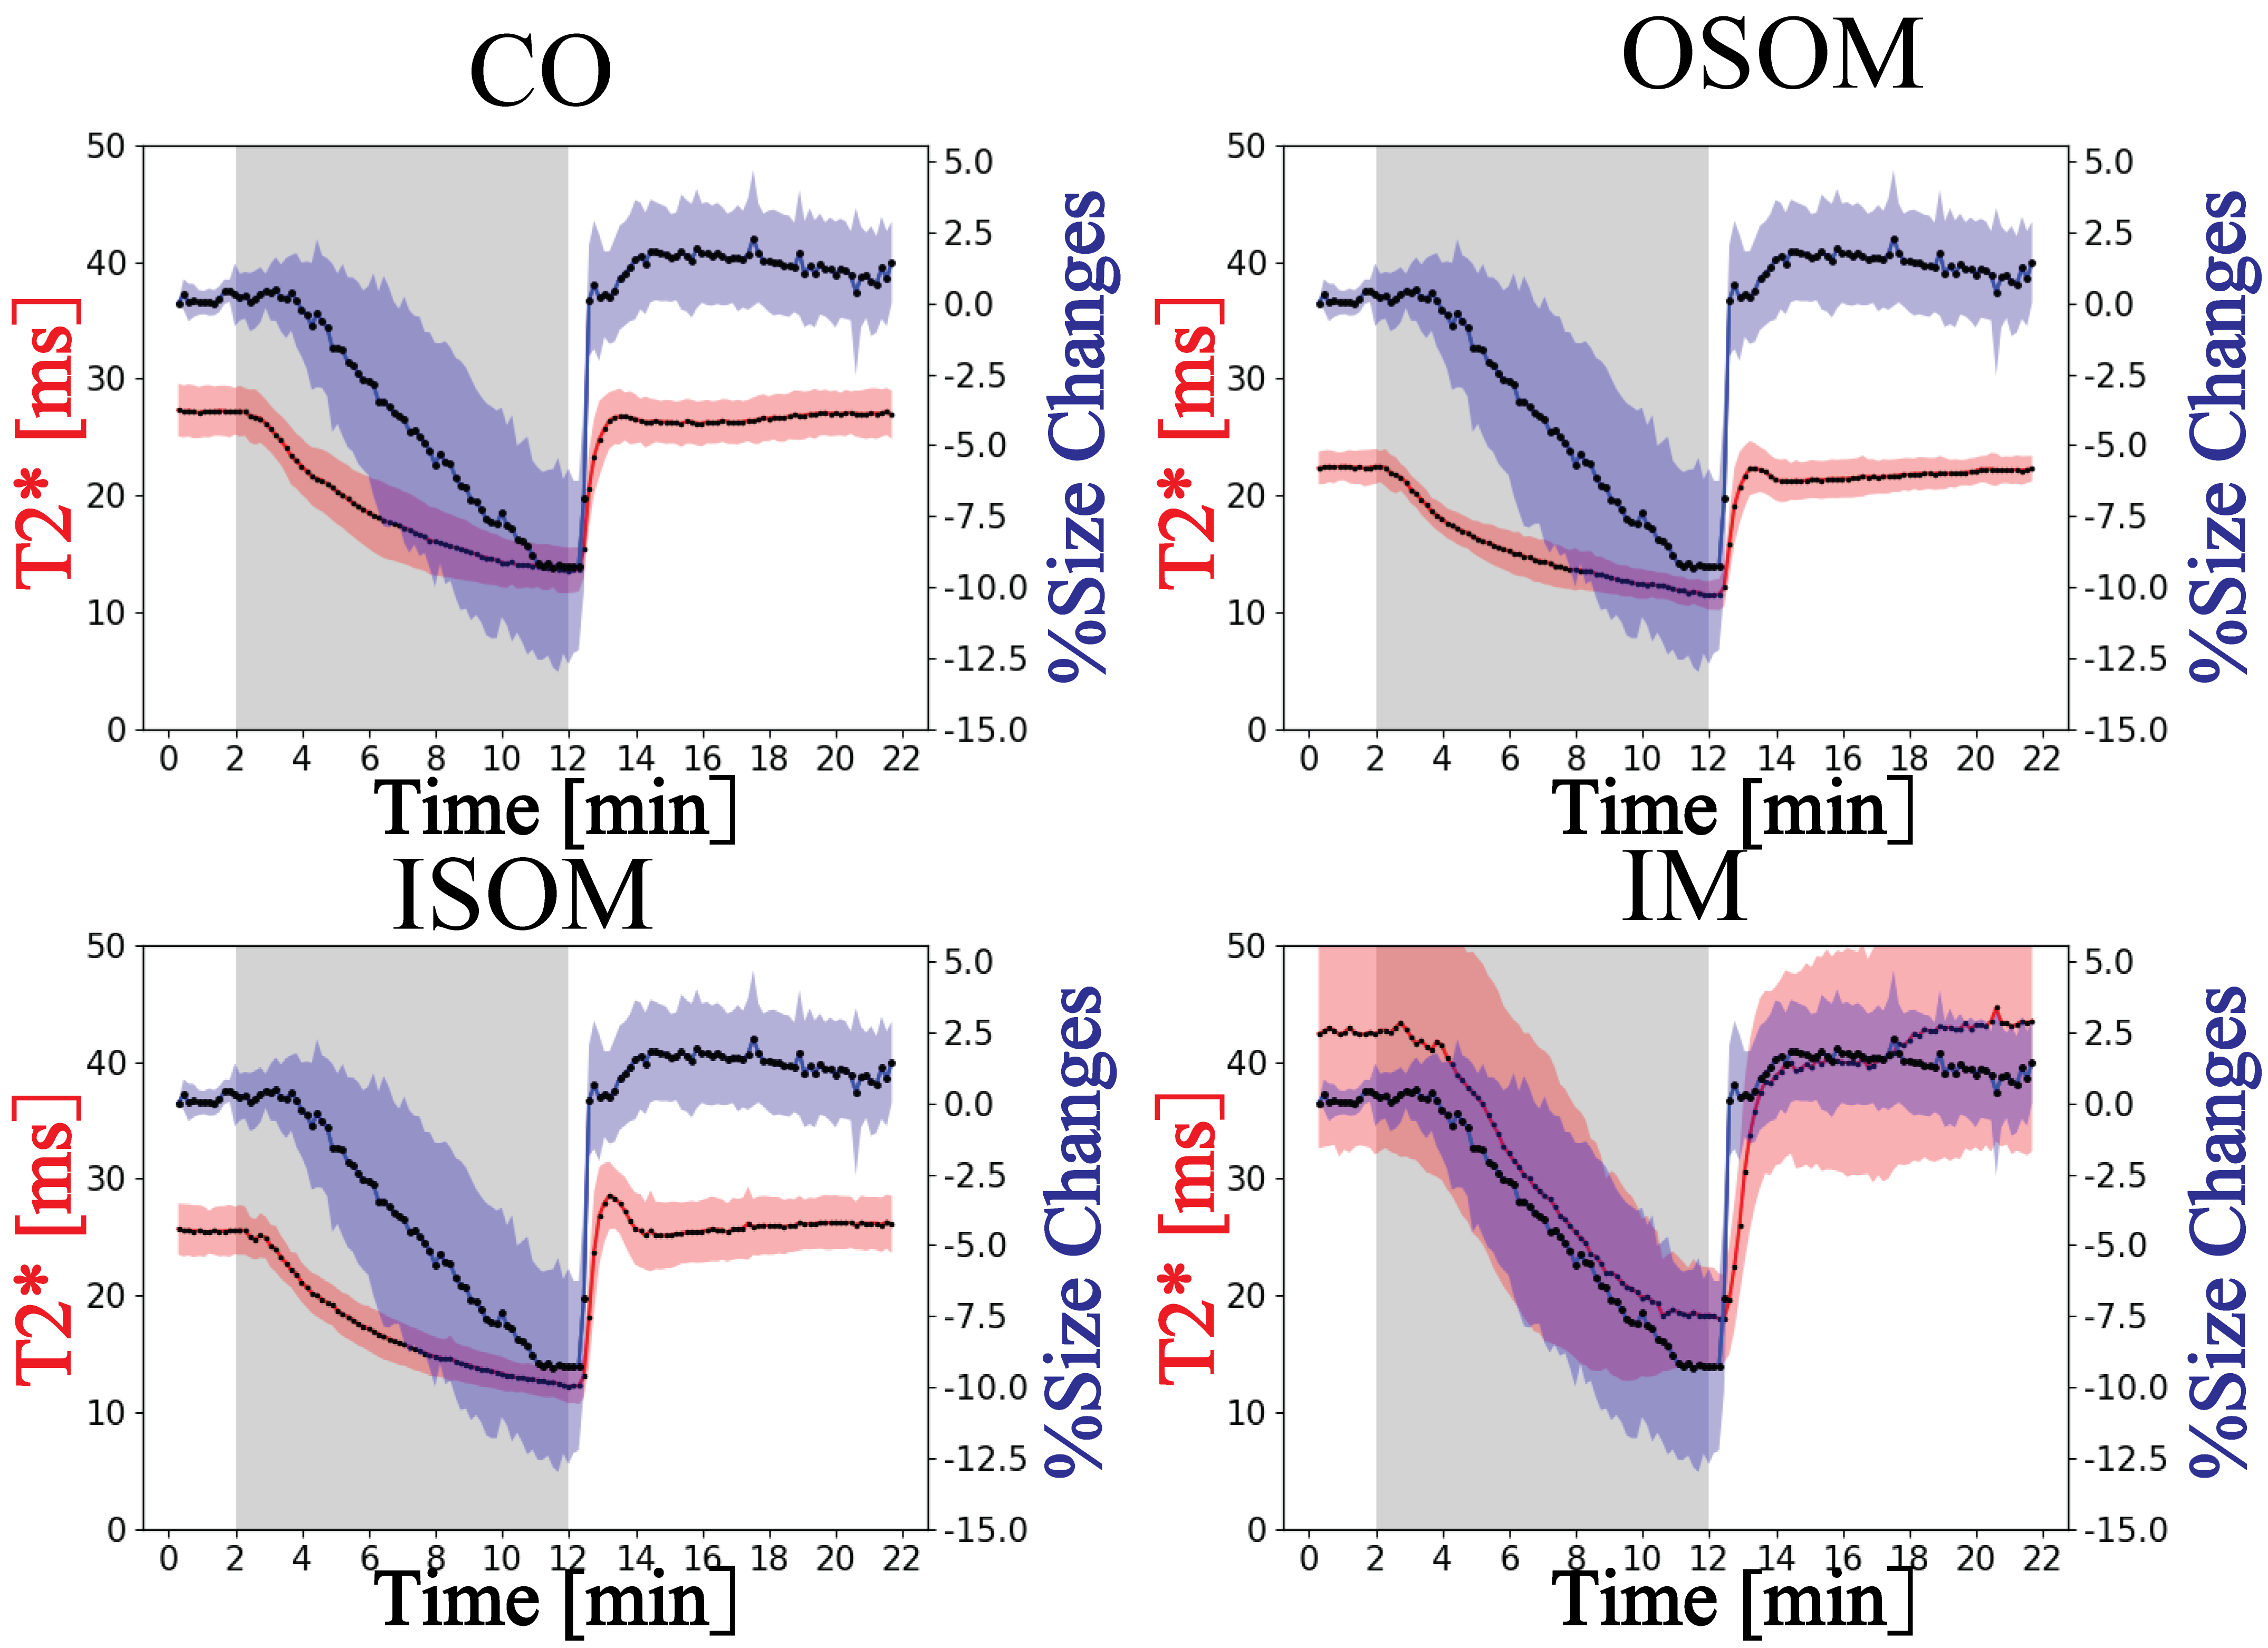
A representative predicted mask is shown in Figure 2. Table 1 summarizes the results of the evaluation metrics derived from the segmentation model after 5-fold cross-validation. An average Dice coefficient of 0.961±0.002, Jaccard coefficient of 0.926±0.004, false positive rate of 0.007±0.001, false negative rate of 0.041±0.005 were achieved. Figure 3 shows alterations in renal size (mean±SD) which were obtained with the trained model from dynamic T2* mapping during hypoxia and reoxygenation. With the progression of hypoxia, renal size decreased by ~10%. During the reoxygenation phase renal size rapidly recovered to baseline. A comparison between renal size and renal T2* is provided for all renal layers in Figure 4 and demonstrates that rapid renal size recovery is paralleled by T2* recovery.Discussion and Conclusion
This work demonstrates dynamic changes in renal size derived from deep learning based sematic segmentation of the kidney during gas challenges. Probing renal size changes offers a viable approach for monitoring the renal response to oxygenation challenges and might provide a potential biomarker for renal disease diagnosis.Acknowledgements
This work was supported by National Natural Science Foundation of China (81871349, 61671228, and 61728107), Science and Technology Program of Guangdong (2018B030333001, and 2017B090912006), and a grant from Hong Kong Research Grant Council (RGC C7048-16G). This work was funded in part (Thoralf Niendorf, Erdmann Seeliger) by the German Research Foundation (Gefoerdert durch die Deutsche Forschungsgemeinschaft (DFG), Projektnummer 394046635, SFB 1365, RENOPROTECTION. Funded by the Deutsche Forschungsgemeinschaft (DFG, German Research Foundation), Project number 394046635, SFB 1365, RENOPROTECTION).References
1. Al-Adra DP, Lambadaris M, Barbas A, Li Y, Selzner M, Singh SK, Famure O, Kim SJ, Ghanekar A. Donor kidney volume measured by computed tomography is a strong predictor of recipient eGFR in living donor kidney transplantation. World journal of urology 2019;37(9):1965-1972.
2. Coruh AG, Uzun C, Akkaya Z, Gulpinar B, Elhan A, Tuzuner A. Is There a Correlation with Pre-donation Kidney Volume and Renal Function in the Renal Transplant Recipient?: A Volumetric Computed Tomography Study. Transplantation proceedings 2019;51(7):2312-2317.
3. Vegar Zubović S, Kristić S, Sefić Pašić I. Relationship between ultrasonographically determined kidney volume and progression of chronic kidney disease. Medicinski glasnik : official publication of the Medical Association of Zenica-Doboj Canton, Bosnia and Herzegovina 2016;13(2):90-94.
4. Zhao K, Pohlmann A, Feng Q, Mei Y, Yang G, Yi P, Feng Q, Chen W, Zhou L, Wu EX, Seeliger E, Niendorf T, Feng Y. Physiological system analysis of the kidney by high-temporal-resolution T2∗ monitoring of an oxygenation step response. Magnetic resonance in medicine 2021;85(1):334-345.
5. Edwards JC. Chloride transport. Comprehensive Physiology 2012;2(2):1061-1092.
6. Ronneberger O, Fischer P, Brox T. U-Net: Convolutional Networks for Biomedical Image Segmentation. 2015.
7. Kingma DP, Ba J. Adam: A Method for Stochastic Optimization. CoRR 2015;abs/1412.6980. 8. You K, Long M, Jordan MI, Wang J. Learning Stages: Phenomenon, Root Cause, Mechanism Hypothesis, and Implications. ArXiv 2019;abs/1908.01878.
9. Milletari F, Navab N, Ahmadi S-A. V-Net: Fully Convolutional Neural Networks for Volumetric Medical Image Segmentation. 2016 Fourth International Conference on 3D Vision (3DV) 2016:565-571.
Figures