2993
The value of Radiomics combined with Machine Learning in the staging of liver Fibrosis1LanZhou University Second Hospital, LanZhou, China, 2LanZhou University, LanZhou, China, 3GE Healthcare, Shanghai, China
Synopsis
The purpose of this study is to develop radiomics models by using T1WI for staging liver fibrosis. Two hundred twenty-four patients had available pathologic reports of liver fibrosis and liver MRI were divided into training (n=179) and testing (n=45) cohorts to develop and validate the radiomics models. The results showed that the T1WI-based radiomics models had a powerful ability to stage liver fibrosis.
Introduction and purpose
Early diagnosis and treatment of liver fibrosis is the key to prevent the progression of chronic liver disease to liver cirrhosis and hepatocellular carcinoma. Although liver biopsy is the current reference standard for staging liver fibrosis, it has many limitations, such as invasive, sampling errors and a series of complications. Radiomics is a promising method to characterizing tumor phenotypes, evaluating prognosis, and guiding clinical decision [1]. Park et al [2] had developed a radiomics model of gadoxetic acid-enhanced hepatobiliary phase images for accurate diagnosis of liver fibrosis. This study aims to develop and validate radiomics models based routine T1WI for staging liver fibrosis.Materials and Methods
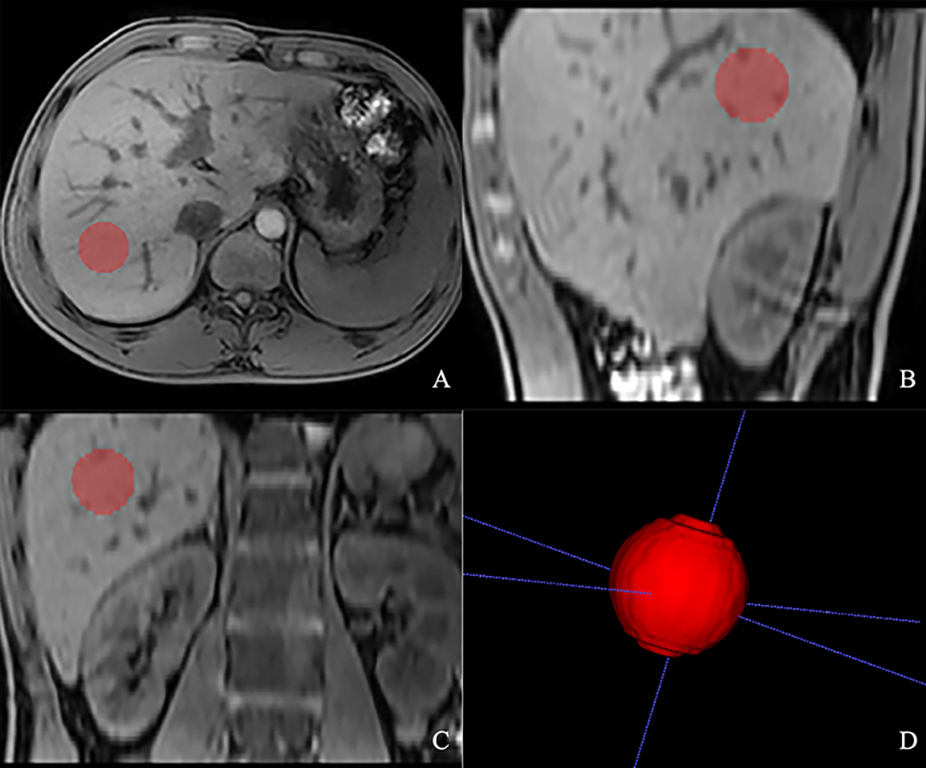
Two hundred twenty-four patients had available pathologic reports of liver fibrosis within 3 months of MRI on a 3T scanner (Ingenia, Philips Healthcare, the Netherlands) were included. An axial mDIXON sequence was performed with the following parameters: TR/TE = 3.7/1.31ms; FOV = 400×357mm2; slice thickness = 4 mm; scan matrix =244×193; voxel size = 1.65×1.85×4mm3, no. of slices = 101. The participants were randomized in a four-to-one ratio into training (n=179) and testing (n=45) cohorts, respectively. Spherical VOI on Water images in the liver were drawn along the margin of the right lobe, at the level of the right portal vein, avoiding artifacts, masses and large vessels, and VOI was 1.5cm in diameter (fig 1). Radiomics features were extracted from the VOI by using Artificial Intelligence Kit (AK, v. 3.2.2, GE Healthcare) software, including first order, GLCM, GLSZM, GLRLM, NGTDM, GLDM and transform image features by LoG and Wavelet. Radiomics models were developed to differentiate low-stage (0-2, n=179) from high-stage (3-4, n=45) fibrosis. The original distribution of liver fibrosis between the two groups (low-stage vs. high-stage liver fibrosis) was imbalanced, so we adopted a synthetic minority oversampling technique (SMOTE) algorithm to create new minority data before feature selection. Then the maximum information coefficient (MIC) was used to select the features. Next ,the remaining features were further selected according to the Gini coefficient of the Random forest. Finally, the radiomics models were established by using the Random forest. In the testing cohort, the diagnostic performance of radiomics models were compared with that of Fibroscan, aspartate transaminase-to-platelet ratio index (APRI) and fibrosis 4 index (FIB-4) by area under the receiver operating characteristic curves (AUC).Results
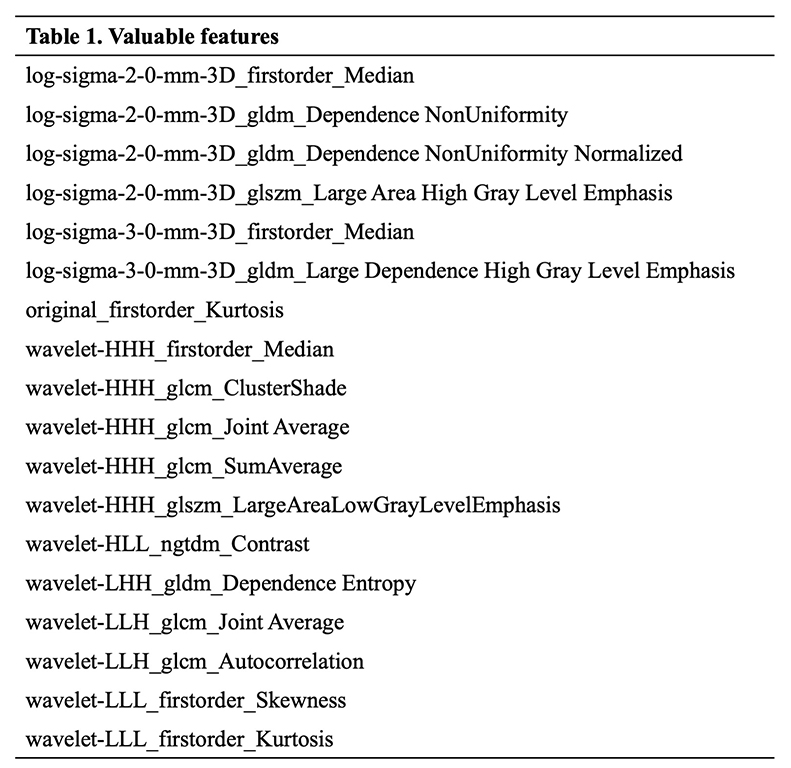
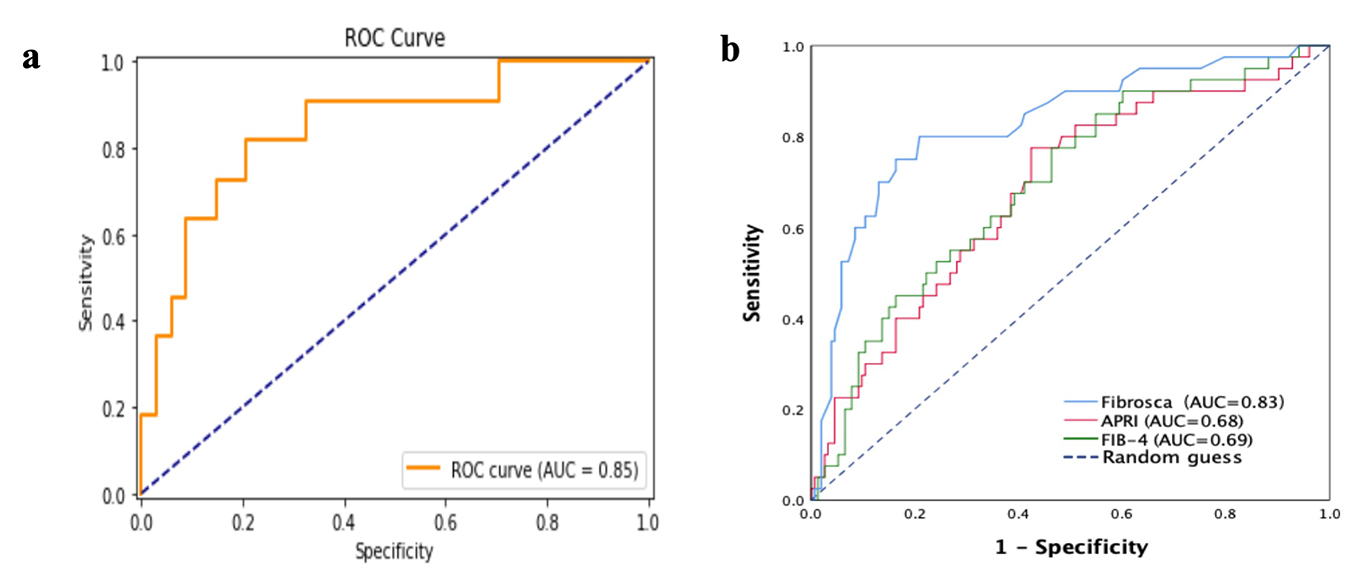
A total of 1023 radiomics features were automatically extracted from VOI of each patient. The eighteen valuable features are summarized in Table 1. In the training cohort, the AUC, sensitivity, specificity and accuracy of the radiomics models were 0.87, 0.76, 0.86, and 0.81, respectively. In the testing cohort, the AUC, sensitivity, specificity and accuracy of the radiomics models were 0.85, 0.79, 0.82, and 0.80, respectively. The radiomics models outperformed Fibroscan(AUC=0.83, P<0.05), APRI(AUC=0.68, P<0.05), and FIB-4(AUC=0.69, P<0.05)(fig 2).Discussion
Biomedical images contain information that reflects potential pathophysiology and that these relationships can be revealed by quantitative image analyses, while radiomics can converse digital medical images into mineable high-dimensional data. Previous studies explored the feasibility of radiomics in the staging of liver fibrosis [2,3], and histogram or texture analysis on basic T1WI showed better performance than other routine sequence [4,5]. This might because T1WI can better reflect the tissue texture changes related to fibrosis. Also, we used water images to overcome the effect of massive steatosis. Our study demonstrated that the use of higher-order features radiomics analysis combined with machine learning allows for differentiation of low-stage fibrosis (0-2) from high-stage fibrosis (3-4) on basic T1WI without enhancement. With the AUC of 0.85, the radiomics models were superior to that of Fibroscan, which suggests that MRI is superior to ultrasound-based elastography in terms of robustness and technical failure rate.Acknowledgements
This article is supported by the Lanzhou Chengguan District Science and Technology Plan Project (No. 2019SHFZ0037)References
[1] Gillies R J, Kinahan P E, Hricak H. Radiomics: Images Are More than Pictures, They Are Data[J]. Radiology, 2016, 278(2): 563-77.
[2] Park H J, Lee S S, Park B, et al. Radiomics Analysis of Gadoxetic Acid-enhanced MRI for Staging Liver Fibrosis[J]. Radiology, 2019, 292(1): 269.
[3] He L, Li H, Dudley J A, et al. Machine Learning Prediction of Liver Stiffness Using Clinical and T2-Weighted MRI Radiomic Data[J]. AJR Am J Roentgenol, 2019, 213(3): 592-601.
[4] Schawkat K, Ciritsis A, Von Ulmenstein S, et al. Diagnostic accuracy of texture analysis and machine learning for quantification of liver fibrosis in MRI: correlation with MR elastography and histopathology[J]. Eur Radiol, 2020, 30(8): 4675-4685.
[5] Yu H, Touret A S, Li B, et al. Application of texture analysis on parametric T1 and T2 maps for detection of hepatic fibrosis[J]. J Magn Reson Imaging, 2017, 45(1): 250-259.
Figures