2985
ATP Resynthesis after Exercise in Human Skeletal Muscle: Assessment by Phosphocreatine vs. Inorganic Phosphate Recovery in Elderly Subjects1Advanced Imaging Research Center, UT Southwestern Medical Center, Dallas, TX, United States, 2Department of Radiology, UT Southwestern Medical Center, Dallas, TX, United States, 3Department of Internal Medicine, UT Southwestern Medical Center, Dallas, TX, United States
Synopsis
In this study, we investigated both phosphocreatine (PCr) and Pi as biomarkers of ATP resynthesis after exercise. We developed an efficient 1-min protocol of modest exercise, suitable for subjects in a wide range of age (from 20s to 80s), to generate sufficient large (~50%) PCr depletion and minimal pH drop (< 0.1) for quantitative measurement of ATP metabolism. We compared the rate constant for ATP production measured by Pi-based direct ATP synthase reaction (Pi + ADP → ATP) to PCr-based indirect CK-mediated reaction (ATP + Cr ↔ PCr + ADP), in the elderly population (aged 73±5 years).
INTRODUCTION
Adequate energy supply is essential for normal muscle function.1 Deficits in ATP production, either from impaired energetic machinery such as dysfunctional mitochondria or from metabolic inflexibility, may lead to exercise intolerance as people age and potentially contribute to the development of chronic metabolic diseases such as insulin resistance and T2D.1,2 The interaction of aging with skeletal muscle energetics is poorly understood. The 31P NMR signal of PCr has been used as a biomarker to assess ATP synthesis in exercising and recovering muscle.2-6 Although PCr is readily detected, the conventional PCr depletion-recovery method has limitations: 1) It is an indirect way to measure ATP metabolism, based on creatine-kinase reaction (ATP + Cr ↔ PCr + ADP + H+). 2) It assume an instant reaction equilibrium, despite the fact that PCr turnover rate is limited at least in resting muscle.7 3) The intensity of PCr signal may be subject to modulation by varying water signal during recovery after exercise. 4) The dynamic range of PCr depletion/recovery may not be sufficient large during modest exercise suitable for sedentary adults or nonathletes. In this study, we aimed to evaluate inorganic phosphate Pi for direct measurement of the energy production reaction (Pi + ADP → ATP), and compare it with the conventional PCr-based indirect approach. We developed a short 1-min exercise regimen, fit for subjects in a wide range of age (20 – 80 years), to generate sufficient large (~50%) PCr depletion and Pi accumulation (>400%) with minimal pH drop (< 0.1 unit) suitable for quantitative measurement of ATP metabolism. These two aims were evaluated in an elderly population.METHODS
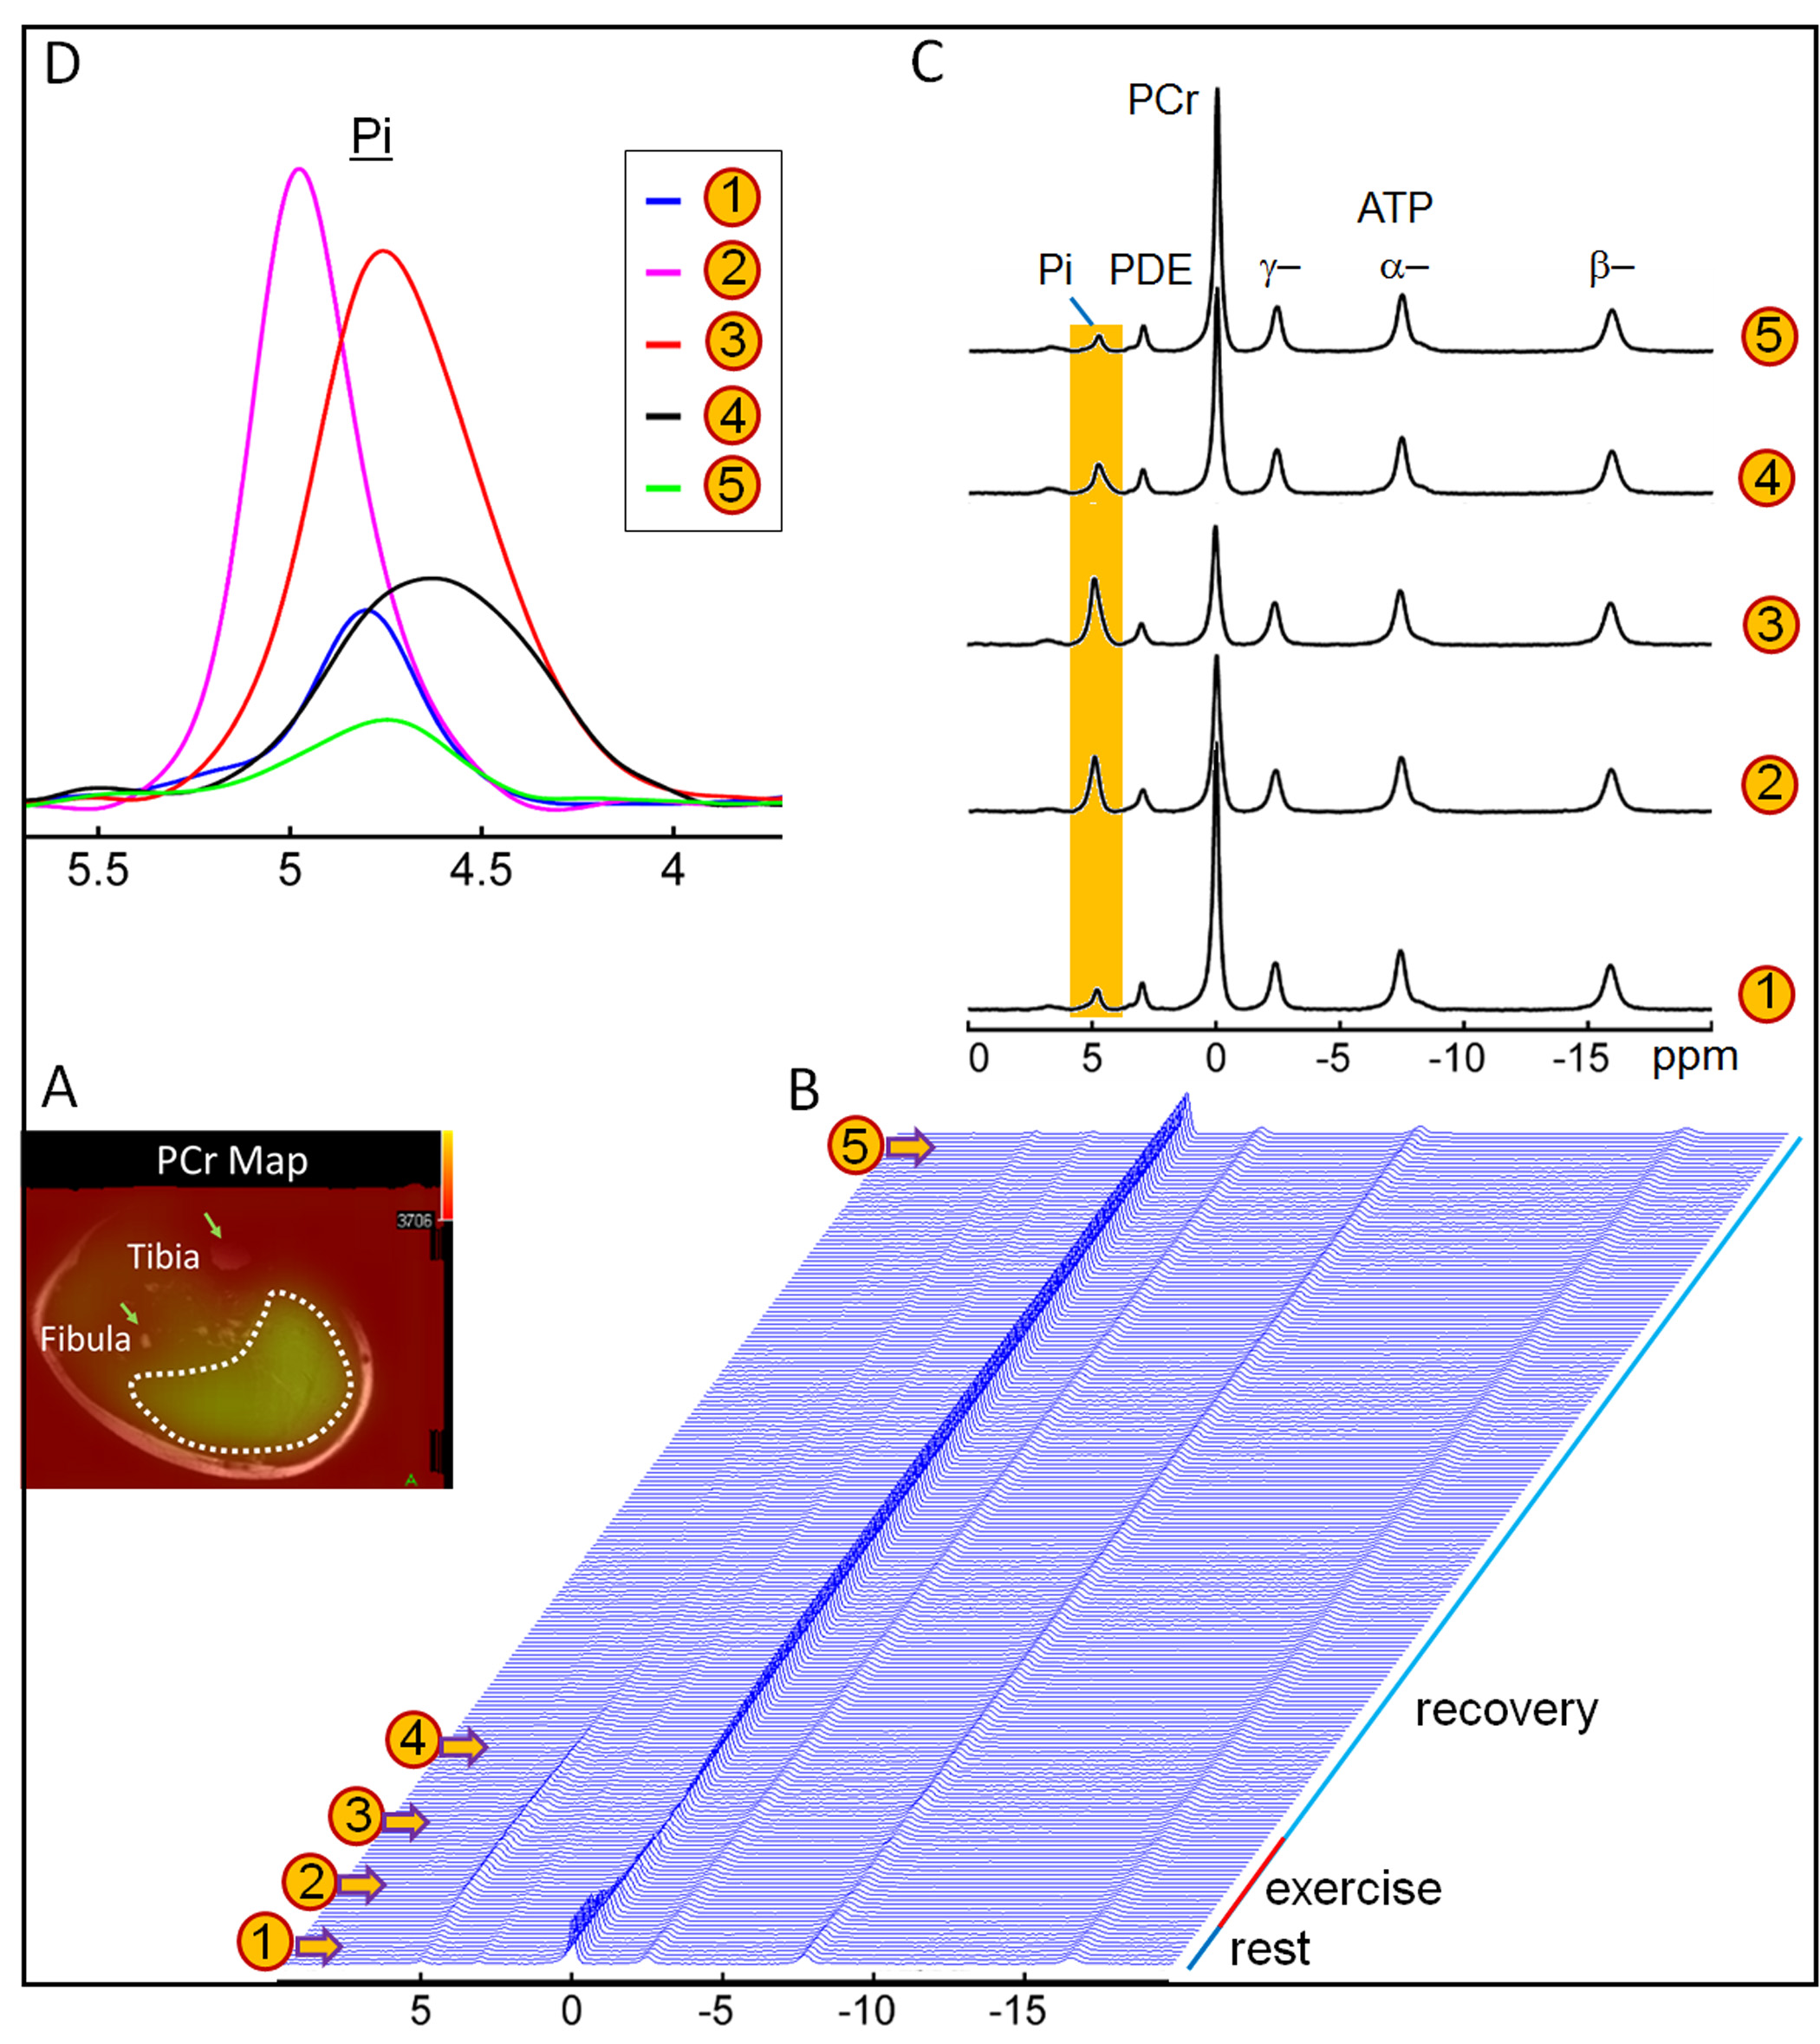
Eight subjects (5 male and 3 female, aged 73 ± 5 yr, BMI 27 ± 3) were scanned by 31P MRS at 7T (Achieva, Philips Healthcare) using a half-cylinder-shaped partial volume, double-tuned 1H/31P quadrature-detection T/R coil. The leg was positioned in parallel to Bo field with the knee lying flat (angle < 15o). Dynamic 31P spectra were acquired from calf muscle with pulse-acquire sequence at a temporal resolution of TR = 2 s. A total of 200 dynamic scans were performed, consisting of 10 scans at resting state, 30 scans during exercise, and 160 scans during recovery. The exercise routine was a 1-min single-legged plantar flexion with a repeating cycle of 2 s, consisting of 1 s of muscle excursion followed by 1 s of relaxation. Calf muscle contraction was performed by foot-pushing against a constant workload equal to 20% of the subject’s body weight. Intracellular pH was evaluated from the chemical shift of Pi (δPi, in ppm) in reference to PCr (δ = 0 ppm) using the following formula: pH = 6.73 + log(δPi – 3.275)/(5.685 - δPi).RESULTS and DISCUSSION
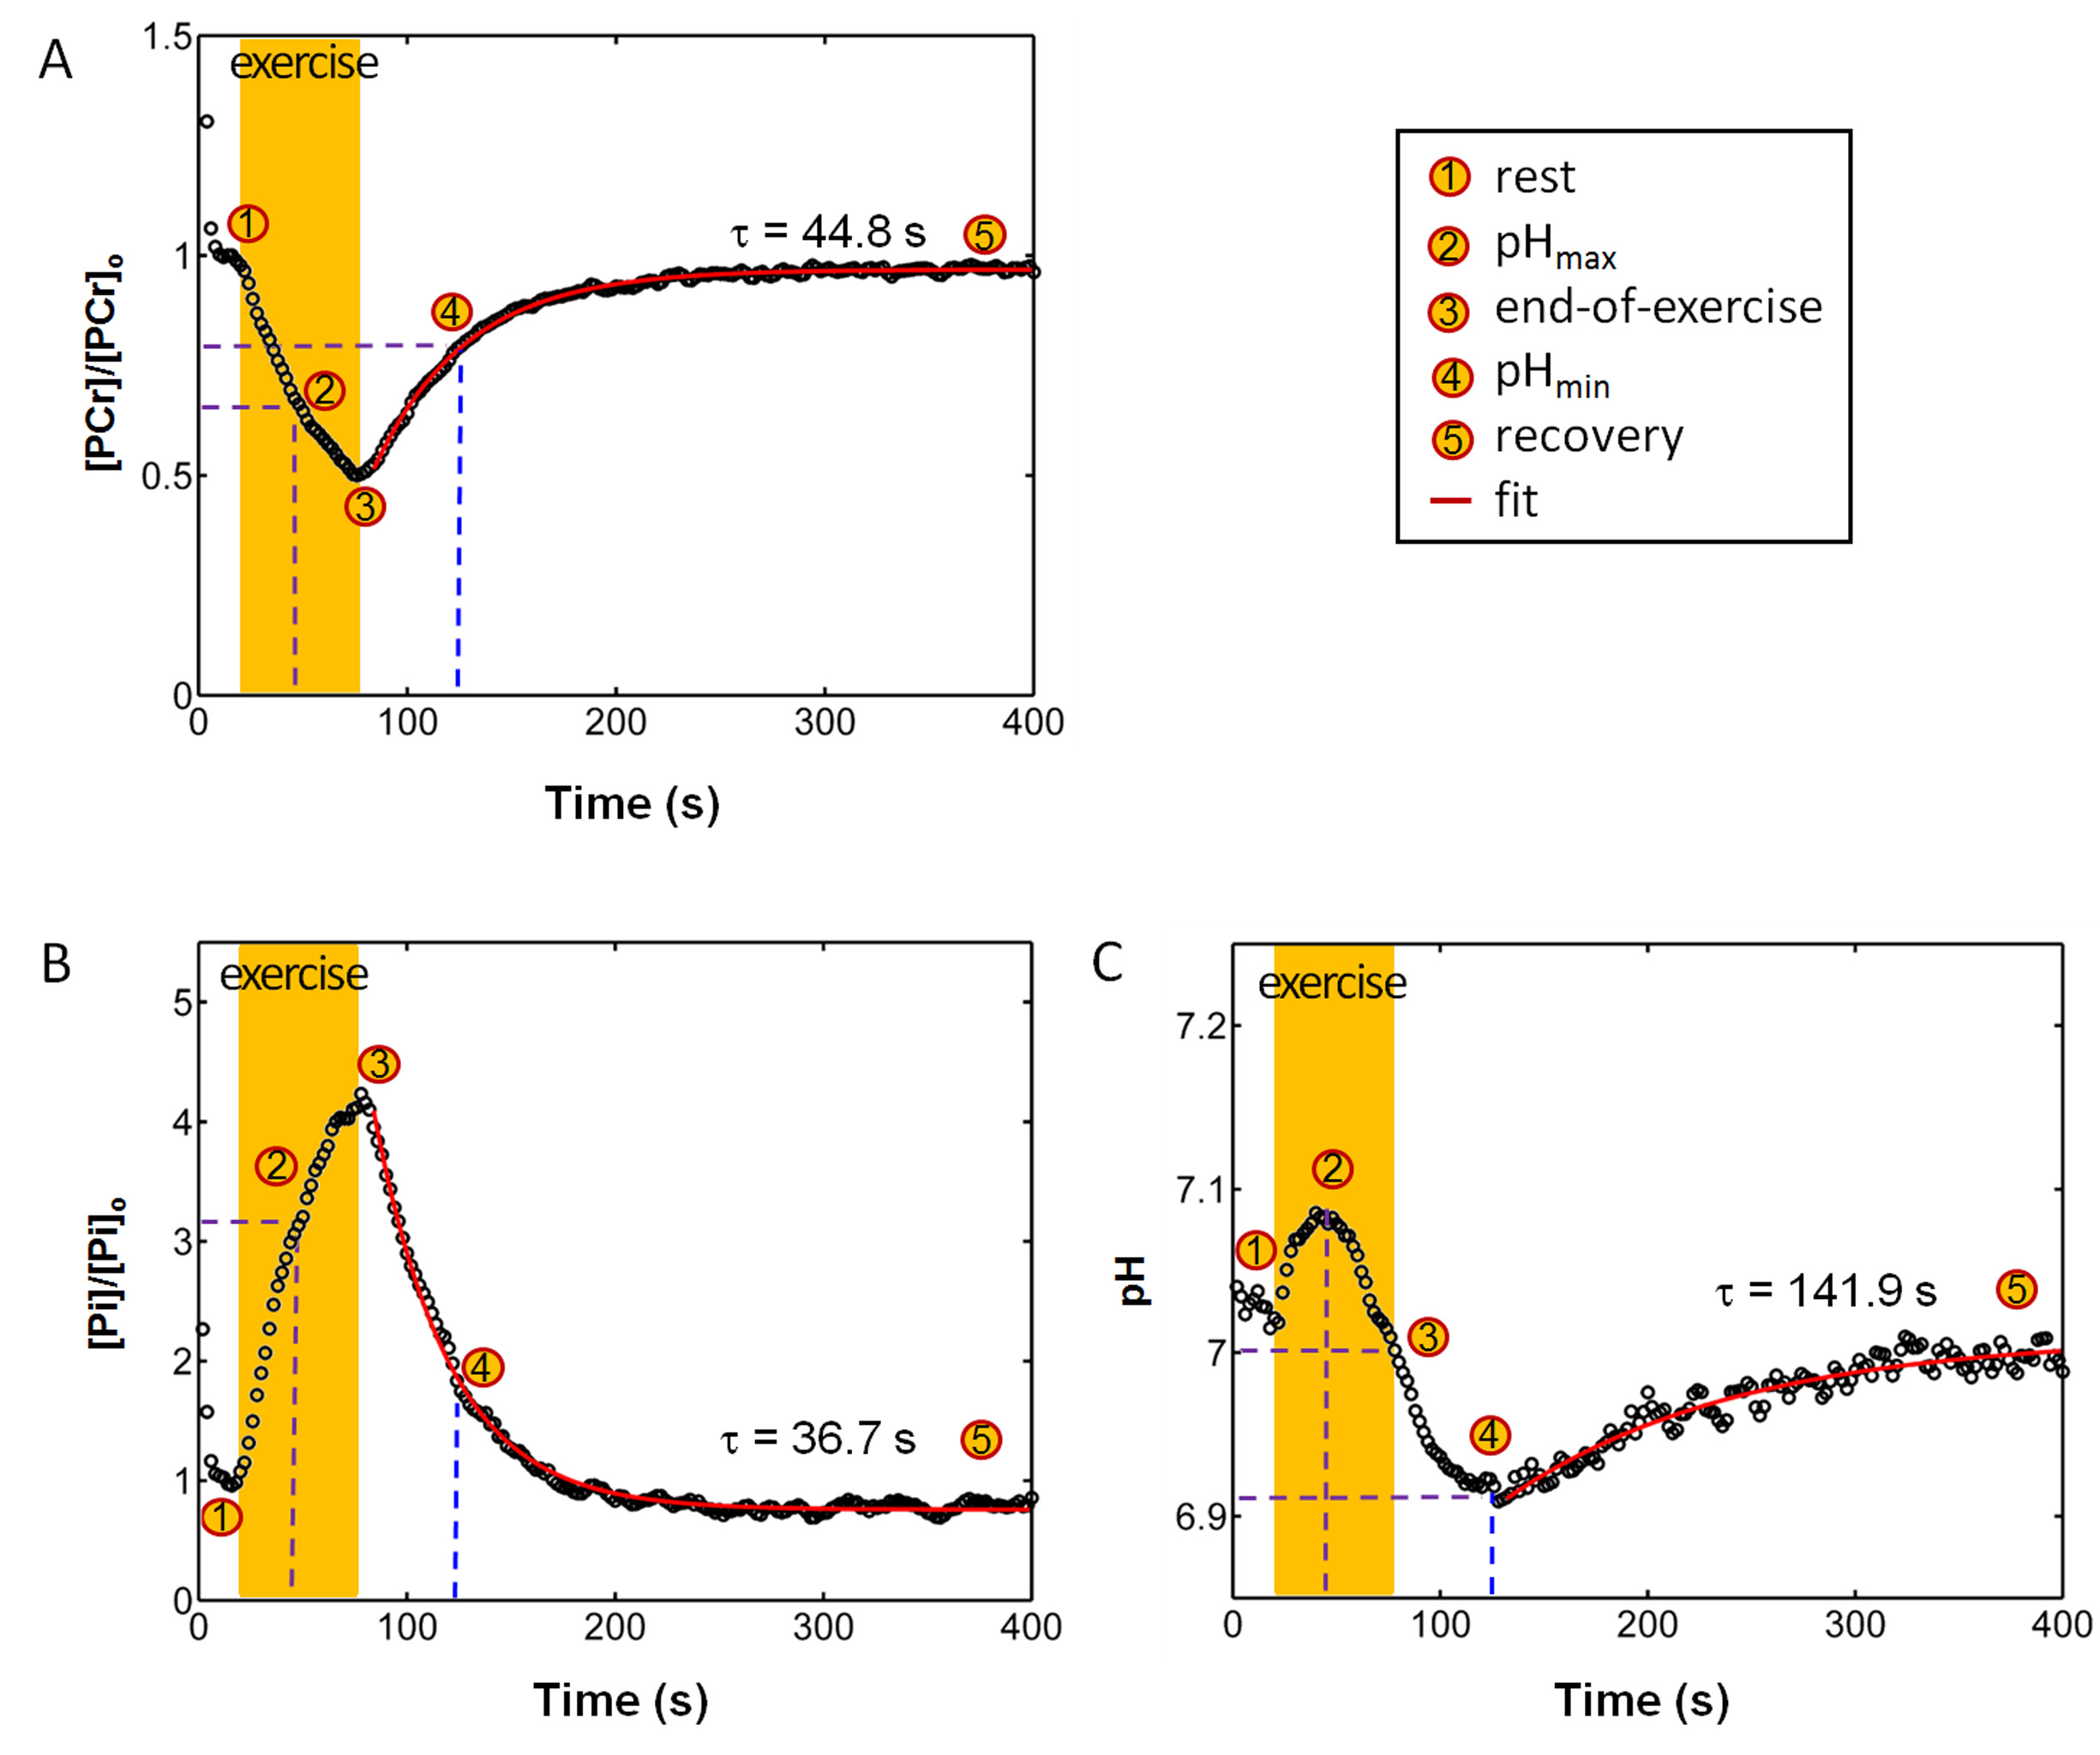
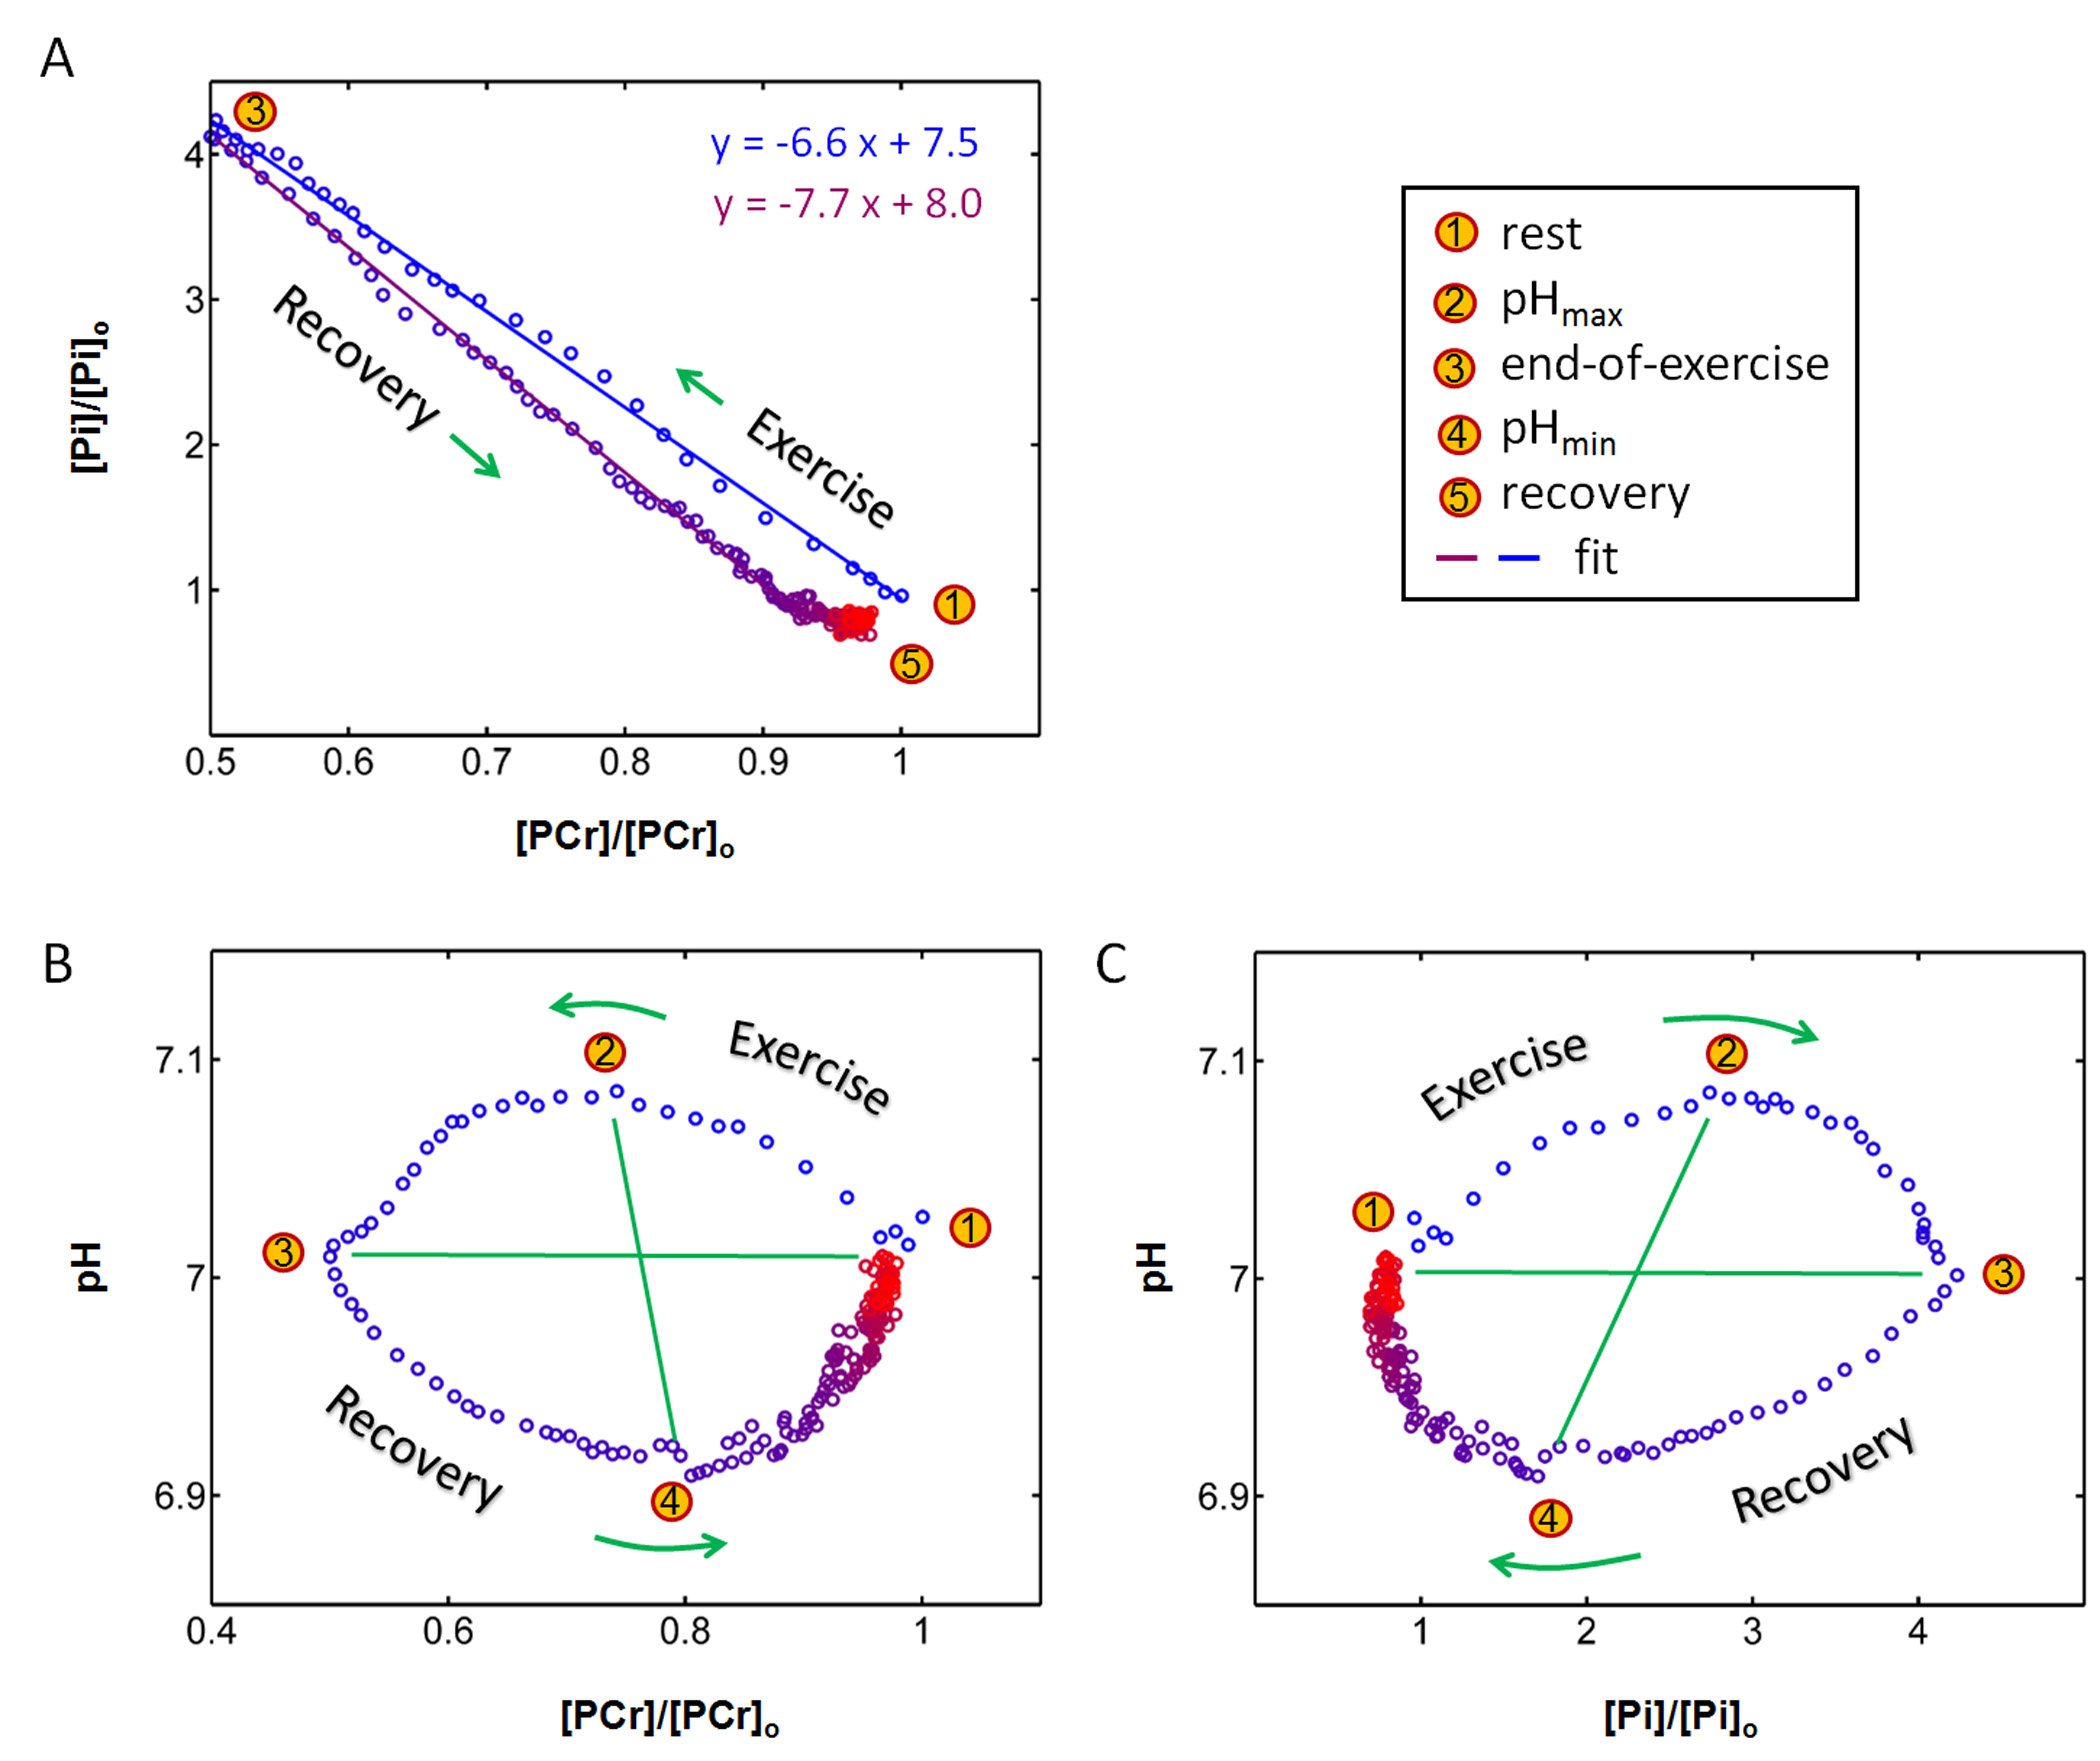
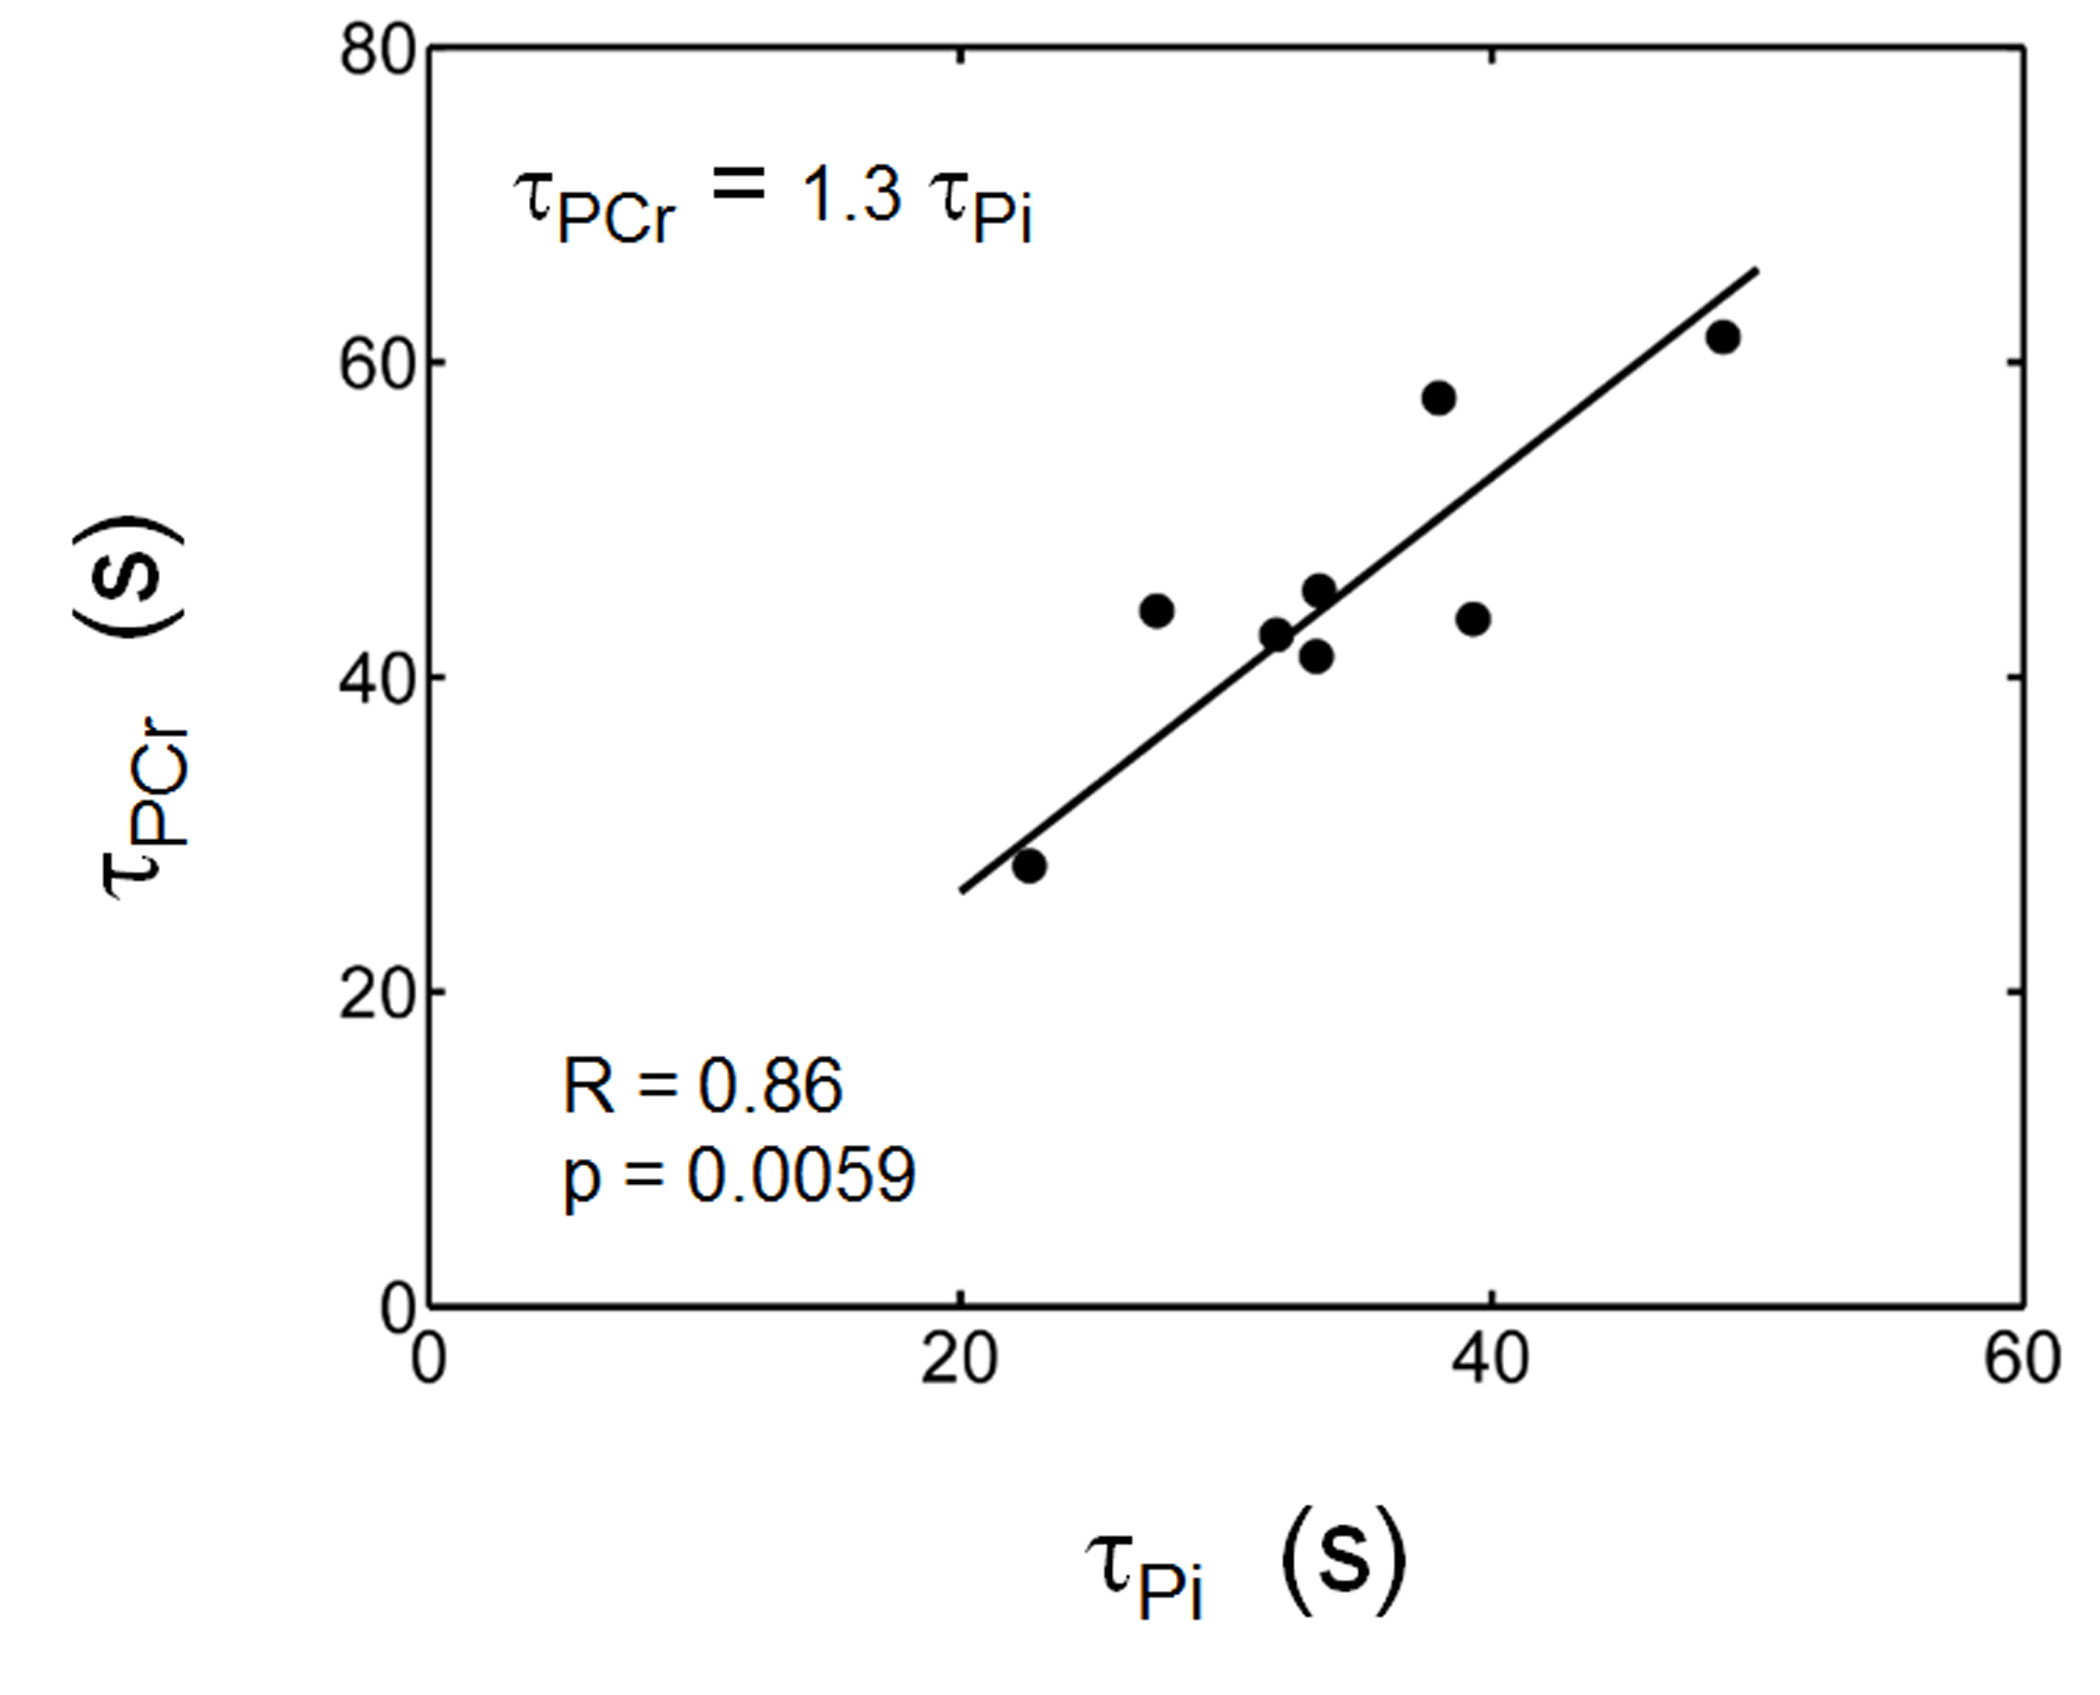
The exercise intensity was sufficient to induce PCr depletion (~50%) and Pi rise (430%) while the pH change was kept within 0.1 unit of baseline, suitable for measuring ATP synthesis by the recovery time constant t. Fig. 1 shows a series of dynamic 31P MR spectra acquired from calf muscle. The time courses of pH and the signals of PCr and Pi, measured in integral, are shown in Figure 2. A mono-exponential fitting yields a τ(PCr) of 45.2 ± 10.4 s for PCr recovery and τ(Pi) of 35.3 ± 7.9 s for Pi decay (n = 8 subjects). These two time constants are proportional to the PCr-to-Pi ratio measured at the end of 1-min plantar-flexion exercise (1.2 ± 0.3 : 1.0). PCr and Pi signal changes are linearly correlated (Figure 3A). Surprisingly, the linear relationship is distinctly different between data collected during exercise and in recovery. To the best of our knowledge, this is the first such observation, and we tentatively interpret it as an effect related to the opposite change of intracellular hydration or oxygenation during exercise and recovery, which may lead to a different modulation of T1 relaxation time between PCr and Pi. Importantly, the pH readings from Pi signal, in combination with PCr and Pi intensity changes, clearly illustrate the sensitive response of metabolic changes during exercise and recovery (Figure 3B and 3C). When both the Pi and PCr kinetics are considered, one can easily identify dominant metabolic events from the plots of pH vs [PCr] and [Pi], including the following proposed assignments: 1) CK-mediated PCr breakdown with H+ absorption (the 1st quadrant of Fig. 3B), 2) anaerobic glycolysis with H+ production (the 2nd quadrant), 3) PCr resynthesis with H+ release (the 3rd quadrant), and 4) transport of accumulated H+ out of cell (the 4th quadrant).CONCLUSION
We demonstrated that skeletal muscle ATP synthesis after exercise in an elderly population may be assessed by both Pi and PCr kinetics. Together with plots of pH vs PCr depletion-recovery and Pi rise-decay, these measurements could provide a more comprehensive picture of complex metabolic dynamics in exercising muscle, valuable for the study of exercise intolerance in chronic metabolic diseases.Acknowledgements
No acknowledgement found.References
1. Prompers JJ, Jeneson JA, Drost MR, Oomens CC, Strijkers GJ, Nicolay K. Dynamic MRS and MRI of skeletal muscle function and biomechanics. NMR Biomed. 2006;19(7):927-53.
2. Chance B, Im J, Nioka S, Kushmerick M. Skeletal muscle energetics with PNMR: personal views and historic perspectives. NMR Biomed. 2006;19(7):904-926.
3. Niess F, Fiedler GB, Schmid AI, Laistler E, Frass-Kriegl R, Wolzt M, Moser E, Meyerspeer M. Dynamic multivoxel-localized 31 P MRS during plantar flexion exercise with variable knee angle. NMR Biomed. 2018;31(6):e3905.
4. Fiedler GB, Schmid AI, Goluch S, Schewzow K, Laistler E, Niess F, Unger E, Wolzt M, Mirzahosseini A, Kemp GJ, Moser E, Meyerspeer M. Skeletal muscle ATP synthesis and cellular H(+) handling measured by localized (31)P-MRS during exercise and recovery. Sci Rep. 2016;6:32037.
5. Sapega AA, Sokolow DP, Graham TJ, Chance B: Phosphorus nuclear magnetic resonance: A non-invasive technique for the study of muscle bioenergetics during exercise. Med Sci Sports Exerc 1987;19: 410–420.
6. Meyerspeer M, Boesch C, Cameron D, Dezortová M, Forbes SC, Heerschap A, Jeneson JAL, Kan HE, Kent J, Layec G, Prompers JJ, Reyngoudt H, Sleigh A, Valkovič L, Kemp GJ; Experts' Working Group on 31P MR Spectroscopy of Skeletal Muscle. 31P magnetic resonance spectroscopy in skeletal muscle: Experts' consensus recommendations. NMR Biomed. 2020:e4246.
7. Ren J, Sherry AD, Malloy CR. Modular 31 P wideband inversion transfer for integrative analysis of adenosine triphosphate metabolism, T1 relaxation and molecular dynamics in skeletal muscle at 7T. Magn Reson Med. 2019;81(6):3440-3452.
Figures