2983
Quantitative correlation of BMD and T2 using high-resolution CT and MRI imaging of rabbit knee joints.
Yang Xia1, Farid Badar1, and Sarah Salem1
1Oakland University, Rochester, MI, United States
1Oakland University, Rochester, MI, United States
Synopsis
Introduction
MRI relaxometry (T2) is a great indicator of degradation of articular cartilage by osteoarthritis (OA) 1, which is the most common disease of articular cartilage altering molecular composition (glycosaminoglycan, GAG,) and structural integrity (collagen), together with an increase of water, specific across the entire tibial-femoral joint 2. With the addition of µCT measurements for bone-density properties, we show that by accurately correlating the two quantitative maps we can accurately study the changes in cartilage and underlying bone which is inadequately measured in MRI. Radiographs of joint space have been widely used for the study of OA progression 3, however with no soft tissue understanding of the changes. Correlation between µCT and µMRI could enhance the knowledge of comprehensive properties of the joint that are unreliably undetectable with conventional MRI.Methods
Four intact normal rabbit knee joints placed in a polyurethane tube with some saline (to avoid drying) were imaged using a Bruker AVANCE III HD system with a 7T/9 cm vertical-bore magnet with a MiniWB57 probe and a 40 mm coil. All MRI experiments used an MSME sequence with a FOV of 30 mm and a matrix size of 256x128 (post-reconstruct to 512x512), which yielded MRI T2 Maps of the intact joint at 58.6 µm/pixel nominal sizes. TR was 5000 ms, with 10 incremental echo times (TE) and a min TE at 7.78ms, averaged 8 scans and with 20 slices at 1mm thickness with no gaps (hence covering the entire knee joint). ImageJ (NIH, MA) was used to calculate T2 and collect the bulk cartilage T2 from four (MT, MF, LT, and LF) locations and averaged using multiple ROIs. The intact knee joints were then imaged in µCT by Skyscan1174 (Bruker, Kontich, Belgium) with experimental parameters set at 50 kV, 800 mA, 12 averages, 0.5° rotation step, 180° rotation, 0.2 mm Al filter, and 652 × 512 data matrix, which took approximately 49 minutes to acquire approximately 608 images with a 60.8 µm isotropic voxel size. All CT images were reconstructed using NRecon (Bruker, Kontich, Belgium) with the same parameters and a global intensity threshold was kept constant for all scans to include the full range of attenuation values. CTan (Bruker, Kontich, Belgium) was used to collect all the BMD values from the corresponding SBP regions under the cartilage ROIs. BMD was calculated using calibrated phantoms provided by the manufacturer.Results
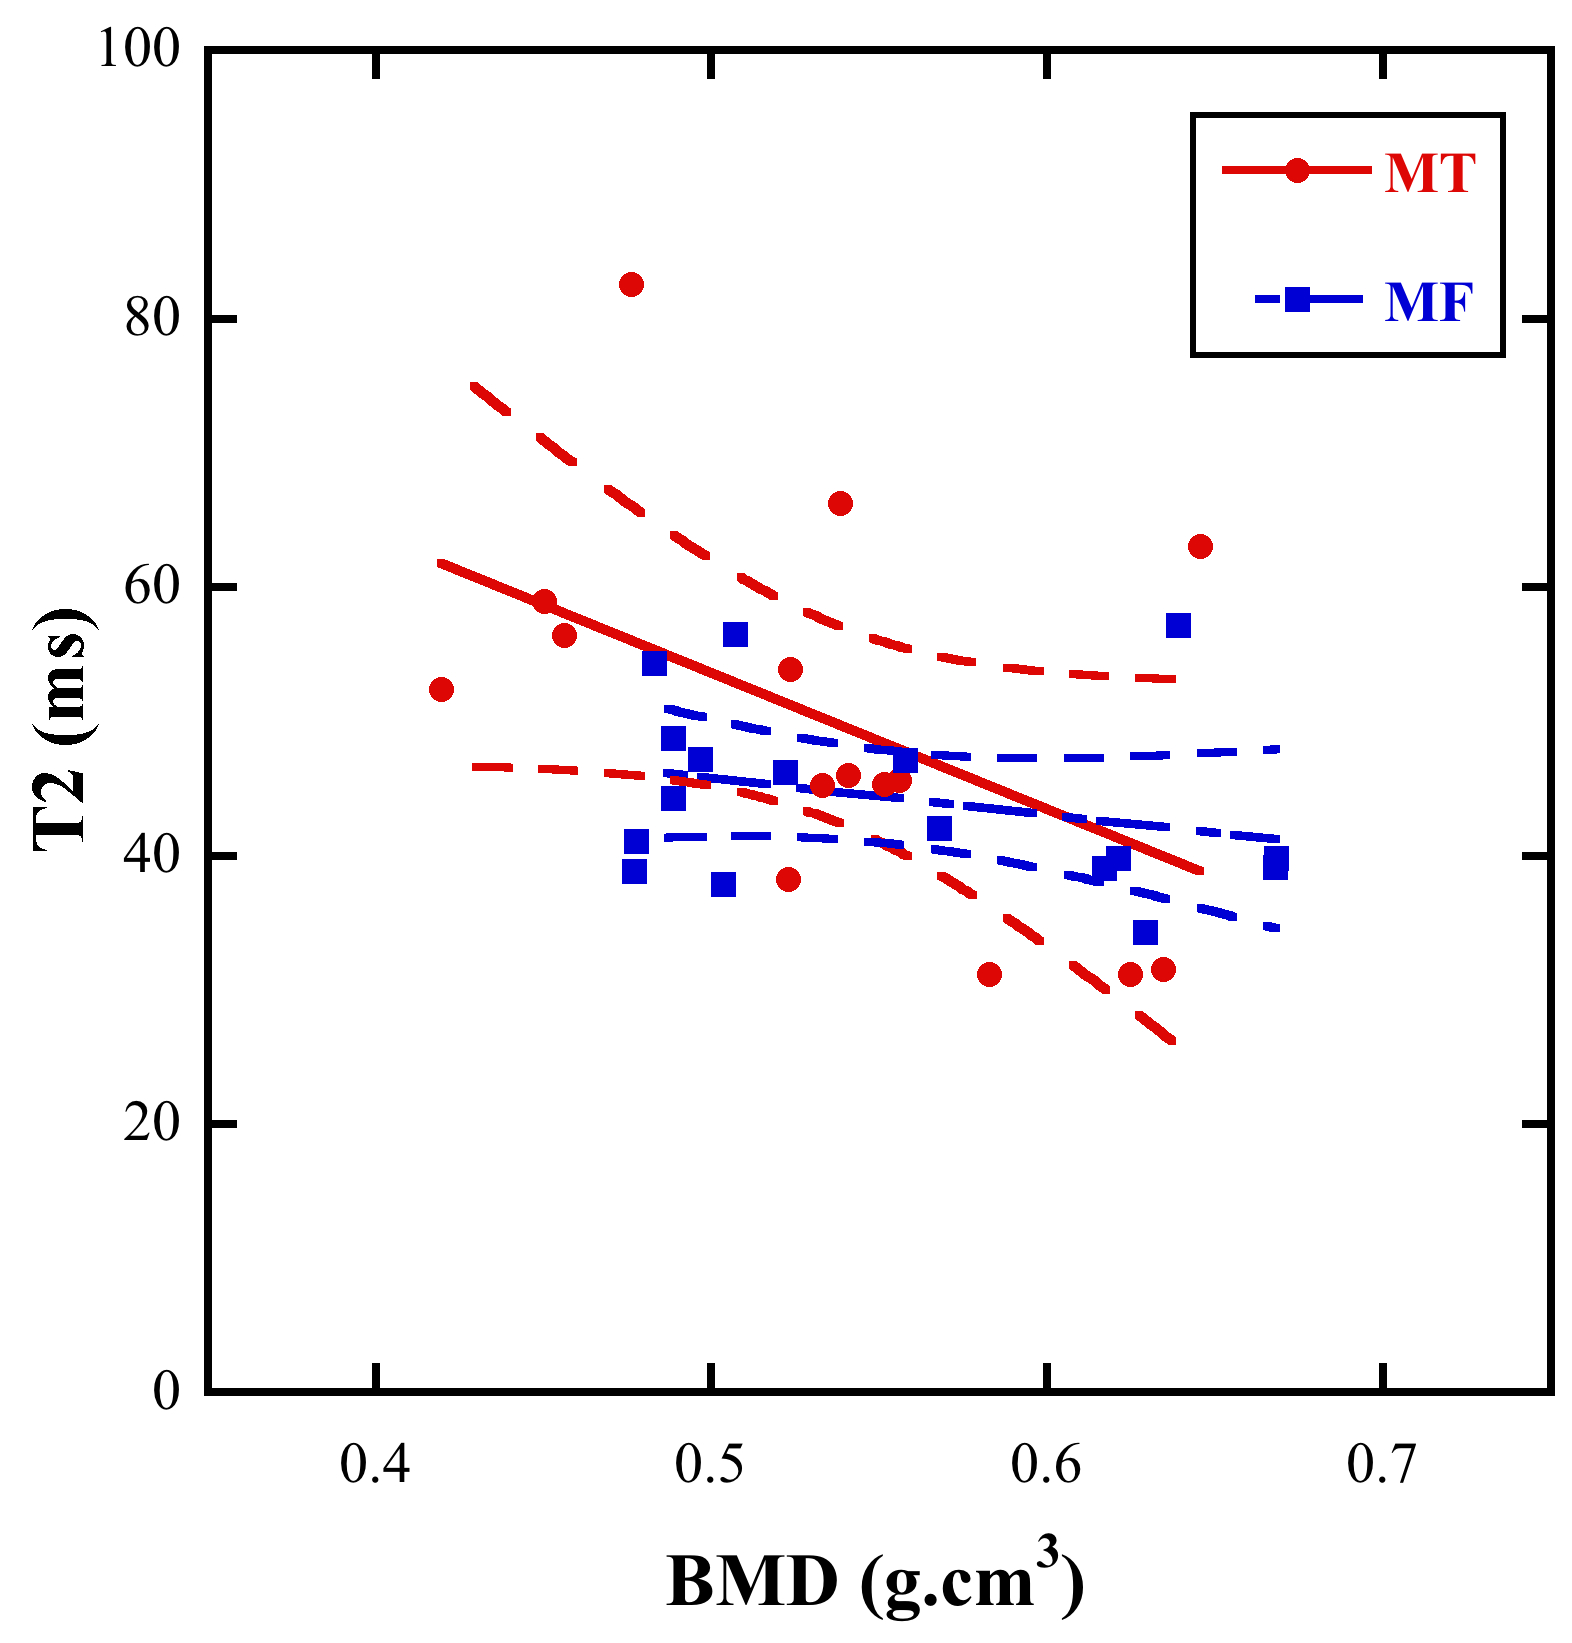
Figure 1 shows the coronal µCT image at 60.8 µm/pixel (isotropic) resolution and the almost identical MRI proton-density T2 map at 58.6 µm/pixel resolution. The red ROIs signify the bulk T2 measured from multiple locations on the Femur and Tibia. Equivalent to the identical location, the BMD from the SBP and STB were also collected. Figure 2 shows a linear relationship of T2 with BMD where T2 is inversely proportional to the BMD. Here we show the underlying bone properties that are undetectable with MRI. From multiple ROIs, averaged T2 is collected from Medial Tibia (MT), Medial Femur (MF), Lateral Tibia (LT), and Lateral Femur (LF). Similarly, the BMD from the underlying SBP is also collected and correlated to the corresponding T2 of each ROI.Discussion
The goal of this study was to correlate the high-resolution MRI T2 maps of intact joint with the finding of bone density properties using isotropic high-resolution µCT. We show with the comparing µCT coronal image and the quantitative T2 map of the intact rabbit joint, that by studying the bone density and the corresponding cartilage T2 values, we can quantitatively measure the T2 to BMD linear relationship. This will aid in future studies of rabbit joint osteoarthritic disease progression due to impact damage in the underlying bone.Conclusion
High-resolution µCT and MRI studies have shown to benefit from a cross correlative study of osteoarthritic tissue 4. Most clinical MRI studies of topographical knee joint spacing lack a true plateau due to the large slice thickness to improve the signal to noise ratio or adding a slice gap that causes the loss of information due to time constraints in an experimental setup. Here we use the highest isotropic resolution µCT of the whole joint to find the more accurate contour of the tibial and femoral joint, on which we implement the T2 map of cartilage and other soft-tissue properties. We have combined two methods to better understand the contour of healthy rabbit knee joint, so that in the future when we study an OA tissue, we can easily measure changes in the bone and accurately relate the findings to the MRI T2 map of the cartilage.Acknowledgements
The authors thank NIH for the R01 grant (AR069047).References
- Mailhiot, S. E. et al, Applied Magnetic Resonance 2017, 48(4), 407–42
- Kurkijärvi, J. E. et al, Magn Reson Med 2004, 52(1), 41-6
- Vignon, E. et al, Arthritis and Rheumatism 2003, 48(2), 378–384.
- Batiste, D. L. et al, Osteoarthritis and Cartilage 2004, 12(8), 614–626.
Figures
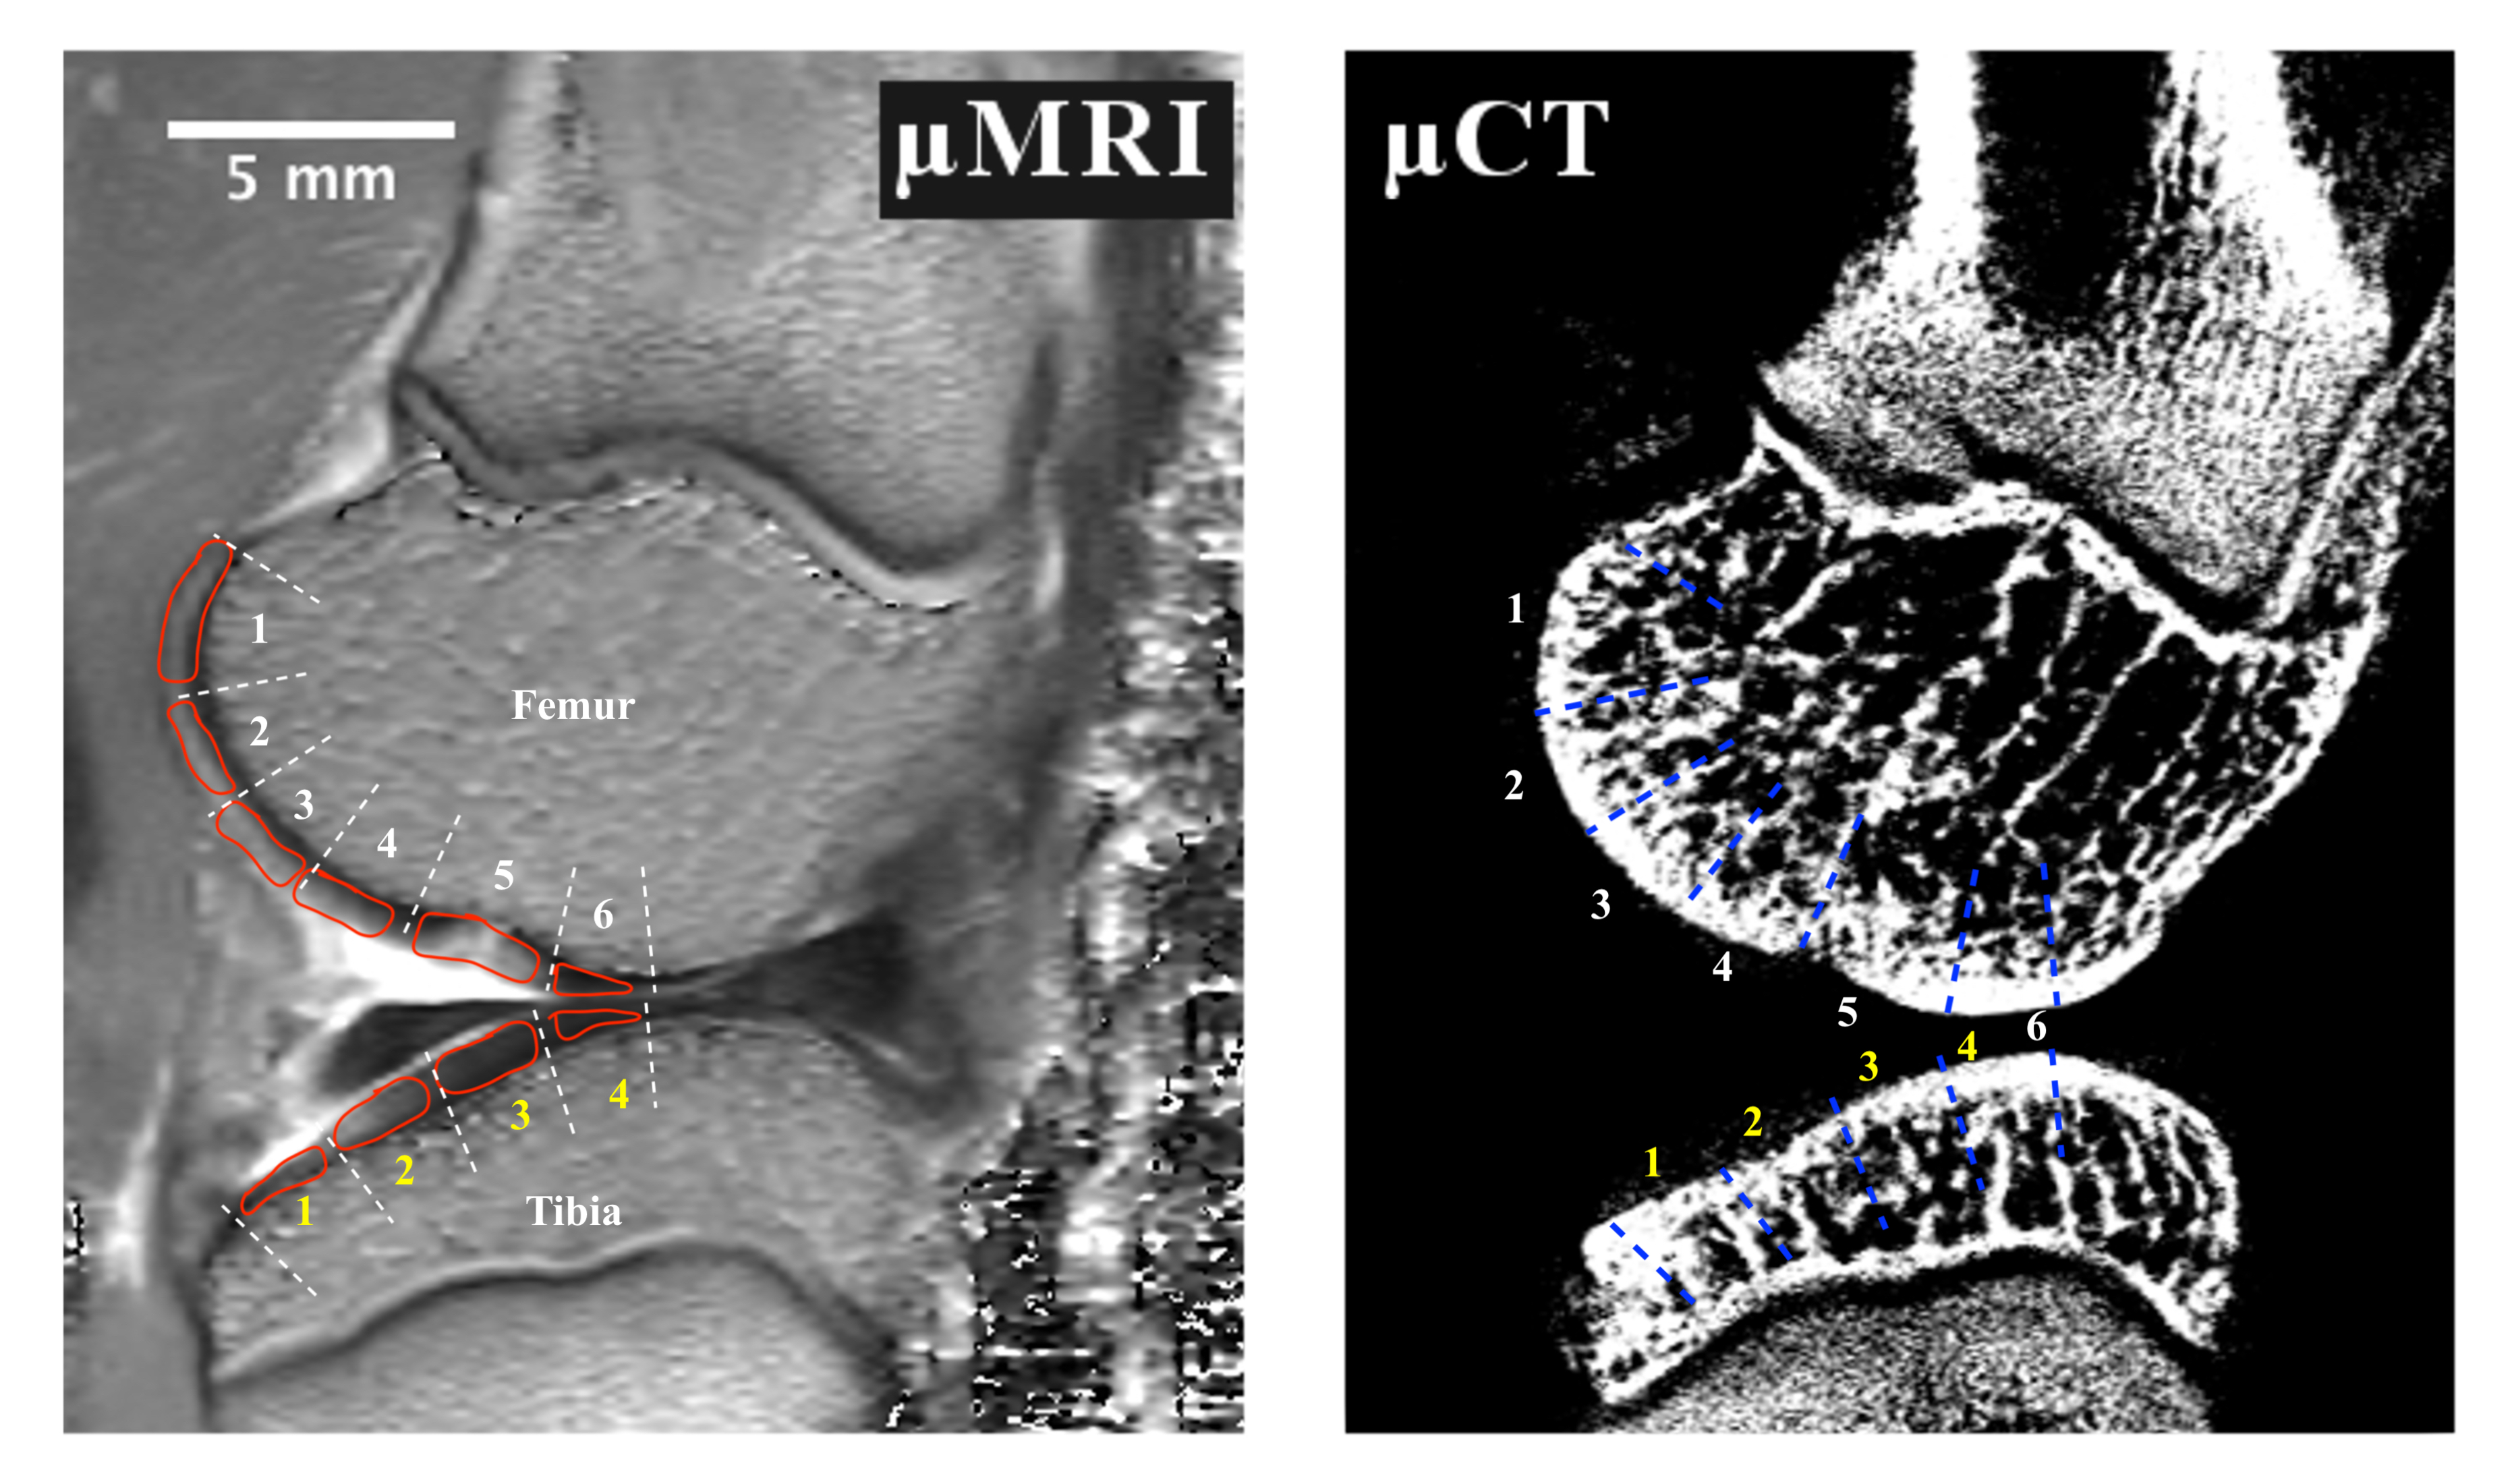
Two-dimensional high-resolution (isotropic) coronal view of (a) µMRI and (b) µCT image of the same slice of intact rabbit joint. The red ROIs signify the multiple locations to compare T2 with the corresponding BMD.
The µMRI T2 (ms) versus µCT BMD (g.cm3) linear curve of the Medial Tibia (MT) and Medial Femur (MF).