2981
T1 and T1rho Relaxation in Equine Groove Model of Cartilage Damage1Department of Applied Physics, University of Eastern Finland, Kuopio, Finland, 2Research Unit of Medical Imaging, Physics and Technology, University of Oulu, Oulu, Finland, 3Department of Clinical Sciences, Faculty of Veterinary Medicine, Utrecht University, Utrecht, Netherlands, 4Diagnostic Imaging Center, Kuopio University Hospital, Kuopio, Finland, 5School of Information Technology and Electrical Engineering, The University of Queensland, Brisbane, Australia
Synopsis
In this study, we examined the T1 and T1rho relaxation times of surgically damaged articular cartilage of equine carpal joints. Two different damage models (sharp and blunt grooves), inducing variation into the type of cartilage damage, were examined. The study revealed that adiabatic T1rho relaxation time is significantly increased in the bluntly damaged cartilage when compared to control cartilage. No significant differences between different damage models or between sharply damaged and control groups were seen for either T1 or T1rho relaxation. Moreover, both relaxation times correlated moderately (R≈0.65) with equilibrium modulus of articular cartilage.
Introduction
Earlier, quantitative MRI (qMRI), more specifically T1 and adiabatic T1rho relaxation times, has provided encouraging results in detecting osteoarthritic changes in animal models of post-traumatic osteoarthritis 1,2 and in osteoarthritic human tissue samples 3. Following these studies, we explored degenerative changes due to surgically induced grooves in the cartilage of equine carpal joints. The aim of the study was to investigate whether the changes in articular cartilage, due to the grooves, could be detected with ex vivo qMRI using T1- and T1rho-relaxation time mappings.Materials and Methods
The samples (n=25) were obtained from a larger imaging study 4, wherein either sharp (n=7) or blunt (coarser) (n=6) cartilage grooves were induced surgically in the radial facet of the third carpal bone and on the dorsoproximal surface of the intermediate carpal bone in 9 Shetland ponies 5 and corresponding samples from the contralateral legs served as controls (n=12). The surgical procedure was performed under approval of the Utrecht University Animal Experiments Committee and the Central Committee for Animal Experiments (permit AVD108002015307) and in compliance with the Dutch Act on Animal Experimentation 4. The animals were sacrificed 9 months after the surgical procedure.Prior to the MRI, Equilibrium Young’s modulus was measured, at six locations on the surface of the samples using indentation geometry 5. Proteoglycan content was measured as optical density (OD), which was obtained from light microscopy images of Safranin-O -stained histological sections.
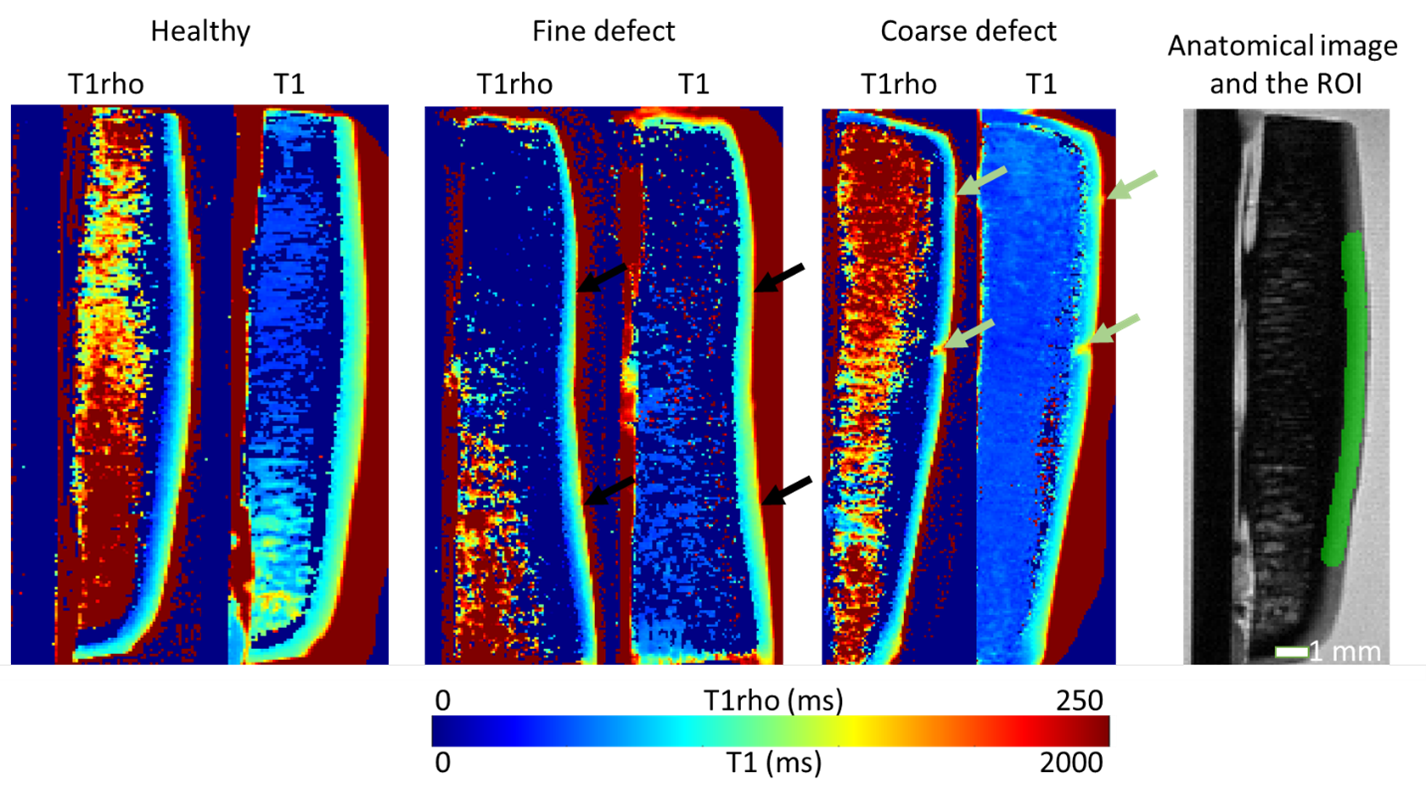
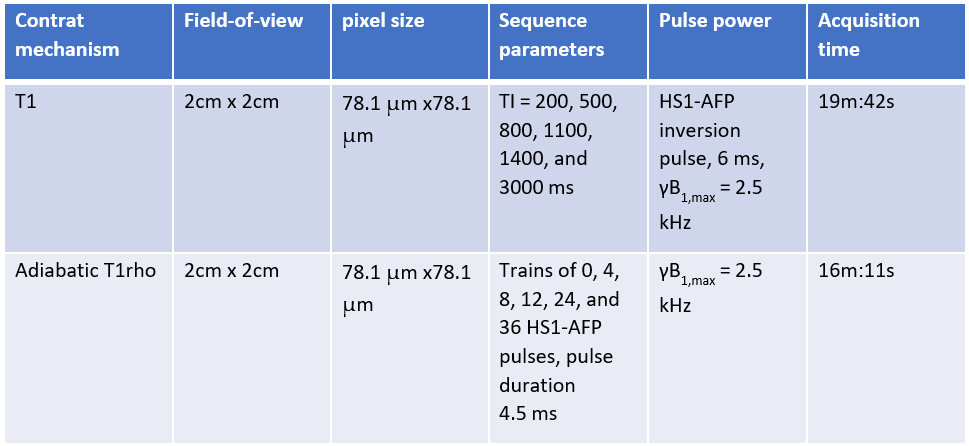
MRI was performed using two separate 9.4T Varian small animal scanners, using the same RF transceiver coil (RAPID Biomedical, Rimpar, Germany) on both. The bore diameters of the magnets were 46 and 160 mm. The T1 and adiabatic T1rho relaxation times were measured by inversion prepared fast spin echo and magnetization prepared fast spin echo sequences respectively (Table 1). Relaxation time maps (Figure 1) were calculated by nonlinear exponential fitting in the raw images using in-house developed MATLAB scripts. The mean values of the relaxation times were calculated in large ROIs (width≈10mm) spanning most of the articular cartilage (Figure 1), as well as in smaller ROIs (width≈1mm) carefully aligned with the biomechanical testing points to calculate correlations between qMRI and reference properties (equilibrium modulus and OD) of articular cartilage.
Statistical differences between the mean relaxation values of contralateral, sharply, and bluntly damaged cartilage, were investigated by using 1-way ANCOVA, where the magnet and the anatomical location of the sample were used as covariates. The correlations between qMRI and the reference properties were evaluated using a multiple regression model, where the reference properties were dependent variables and relaxation times, magnet and anatomical location of the sample were independent variables. All statistical analyses were carried out using IBM SPSS statistics 27.
Results
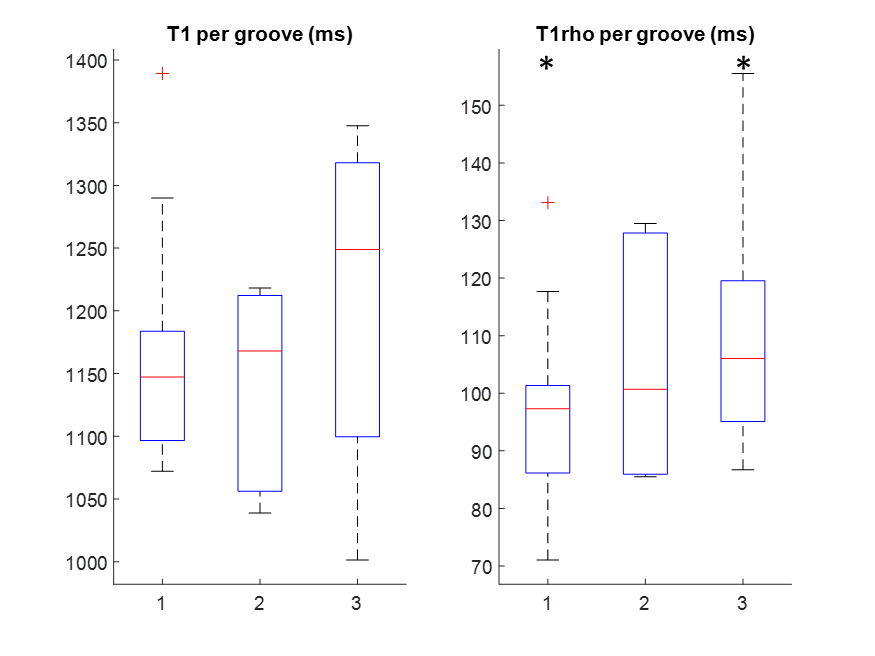
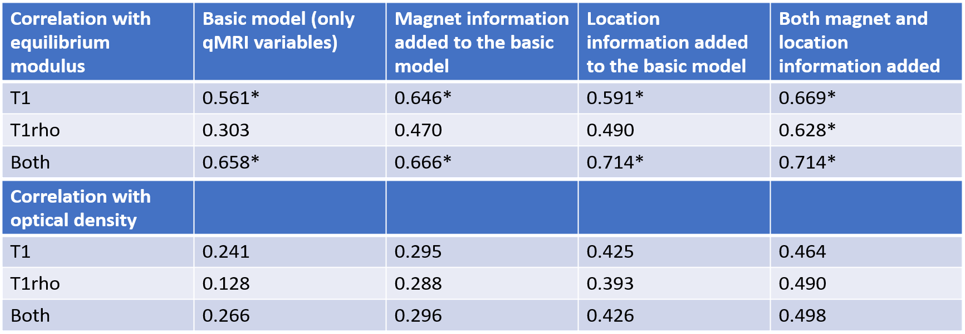
Visual inspection of the qMRI results revealed that in most of the samples (n=4), blunt grooves cause an elevation of both relaxation times (Figure 1). In the case of adiabatic T1rho relaxation, this increase is also statistically significant when comparing the mean values in the large ROIs between bluntly damaged and contralateral cartilage (p<0.05) (Figure 2). Though T1 relaxation time was also elevated in the bluntly damaged cartilage, the increase was not statistically significant (Figure 2). The relaxation times in the samples with sharp grooves did not exhibit significant changes compared to the contralateral samples (Figure 2). The regression analysis in small ROIs revealed that correlation between qMRI and equilibrium modulus was moderate when use of two magnets and two different joint surfaces was considered in the regression model (Table 2). The correlations between qMRI and OD were not statistically significant (Table 2).Disscussion and conclusions
The results indicated that both relaxation times, especially adiabatic T1rho is sensitive towards blunt grooves in articular cartilage, even though the analysis was carried out in ROIs spanning a wide area compared to the size of the grooves. This indicates the possibility of detecting differences in the clinical setting, where the lower resolution roughly corresponds to the larger ROIs of high-resolution ex vivo imaging. Sharp grooves, on the other hand, did not induce noticeable changes in the relaxation times, suggesting that the changes induced do not lead to significant articular cartilage damage, at least not in the first 9 months after creating the groove. The study also showed that despite the use of two separate 9.4T MRI scanners (due to a hardware failure during the study) and with samples from separate anatomical locations (though with the same groove models), significant differences could be detected between the contralateral and coarsely damaged groups. Furthermore, correlations aligning with those in previous studies 1,2,3 were found, even though the samples were immersed in phosphate buffered saline here instead of the MRI-signal free perfluoropolyether used in previous studies 1,2,3. This brings the setup closer to the in vivo case and mitigates any potential effects of the perfluoropolyether 6. To sum up, the results indicated that adiabatic T1rho can detect differences between damaged and healthy cartilage in an equine model of surgically induced blunt grooves 9 months after the onset.Acknowledgements
The authors want to thank Saskia Plomp for the help in the harvesting of osateochondral samples used in this study and help regarding the practical aspects of the study.
The financial support from Academy of Finland (grants: #285909, #319440, and #325146), Finnish Cultural Foundation (grant: #00180787), and Alfred Kordelin foundation (grant: #190111) is gratefully acknowledged.
References
1. Abdul Wahed Kajabi, Victor Casula, Simo Ojanen, Mikko A Finnilä, Walter Herzog, Simo Saarakkala, Rami K Korhonen, Mikko J Nissi, Miika T Nieminen, “Multiparametric MR imaging reveals early cartilage degeneration at 2 and 8 weeks after ACL transection in a rabbit model”, Journal of Orthopaedic Research, 38 (9), 2020, pages 1974-1986
2. Abdul Wahed Kajabi, Victor Casula, Jaakko K Sarin, Juuso H Ketola, Olli Nykänen, Nikae CR Te Moller, Irina AD Mancini, Jetze Visser, Harold Brommer, P René van Weeren, Jos Malda, Juha Töyräs, Miika T Nieminen, Mikko J Nissi, “Evaluation of articular cartilage with quantitative MRI in an equine model of post‐traumatic osteoarthritis”, Journal of Orthopaedic Research, Early View, 2020
3. Nina E Hänninen, Olli Nykänen, Mithilesh Prakash, Matti Hanni, Miika T Nieminen, Mikko J Nissi, ”Orientation anisotropy of quantitative MRI parameters in degenerated human articular cartilage”, Journal of Orthopaedic Research, Early View, 2020
4. Sander Brinkhof, Nikae CR te Moller, Martijn Froeling, Harold Brommer, P René van Weeren, Keita Ito, Dennis Klomp, “T2* mapping in an equine articular groove model: Visualizing changes in collagen orientation”, Journal of Orthopaedic Research, 38 (11), 2020, pages 2383-2389
5. Nikae CR te Moller, “Does cartilage damage doom the joint?: diagnosis and impact of subtle cartilage grooves in the (equine) joint (Doctoral dissertation).” Utrecht University; 2019.
6. Olli Nykänen, Nina E Hänninen, Mikko J Nissi, “How Pre-Processing Procedure Affects Relaxation Properties of Ex Vivo Articular Cartilage?” 28th ISMRM Meeting & Exhibition
Figures