2980
The morphology and T2* value changes of 21 knee joint cartilage sub-regions before and after marathon assessed by prototype software1Department of Radiology, The third Hospital of Hebei Medical University, Hebei Province Biomechanical Key Laboratory of Orthopedics, Shijiazhuang, Hebei 050051, China, Shijiazhuang City, China, 2Siemens Healthineers Ltd., Shanghai, 201318, China., Shanghai, China, 3Department of Radiology, Affiliated Hospital of Hangzhou Normal University,Hangzhou 310015,China, Hangzhou, China
Synopsis
This study is designed to assess the changes of articular cartilage volume, thickness and T2* value before and after marathon in non-professional athletes by semi-automatic cartilage segmentation prototype software.All volunteers underwent MR scan before and after marathon and accepted follow-up observation.We confirmed that MR biochemical imaging combined with morphological changes can be used to assess the internal structure and general changes of cartilage. The anterior part of medial tibial plateau may be a high risk area for cartilage degeneration under the long-distance marathon.
Introduction
Marathon has become popular in recent years, however, repeated excessive stress in the marathon may exceed the load capacity and may lead to cartilage damage and subsequent osteoarthritis (OA) development[1]. If cartilage lesions can be found early, the disease could be intervened as early as possible[2,3].The T2 value of the cartilage was always used in assessing the cartilage damage in previous studies[4,5], however, there is few studies assessed the change of cartilage T2* value. Compared to the T2 mapping method, T2* mapping has the advantages of fast imaging speed and high image resolution with high sensitivity and accuracy in the diagnosis of early cartilage injury. The purpose of this study was to observe the effect of marathon on knee joint cartilage damage by estimating the cartilage volume, thickness, and T2* value changes of every sub-regions using prototype software.
Methods
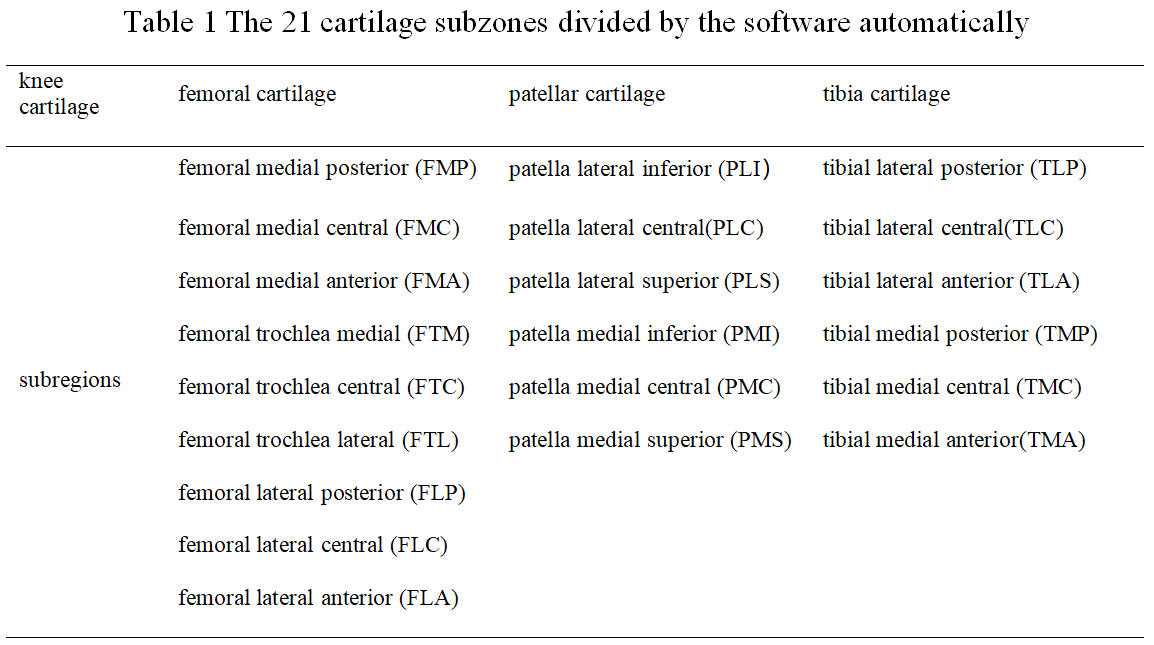
Twenty-six amateur marathon runners were included. The three-dimensional double-echo steady-states (3D-DESS) sequence and T2* mapping sequence were applied to acquire both the morphology and biochemical information of the knee cartilage. All the volunteers underwent MR scan one week before the competition and within twelve hours after the competition. Among them, fourteen volunteers underwent the third MR examination seven days after the competition, the other twelve volunteers underwent the third MR examination two months after the competition. The data were imported into the semi-automatic cartilage segmentation prototype software. The knee cartilage was segmented into 21 sub-regions. Cartilage volume, thickness and T2* value of each sub-region was obtained with manual checking and correction.Results
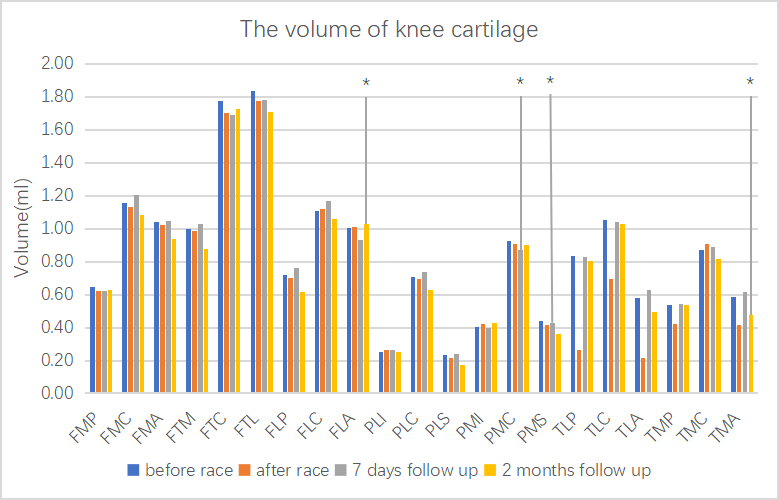
The thickness of patella lateral central(PLC) was significantly increased within twelve hours after the marathon (P<0.05), and the thickness of tibial medial anterior(TMA) was significantly reduced in the two months after the marathon (P<0.05)There is no difference in the volume of all cartilage sub-regions before and within twelve hours after the marathon. During the seven-day follow-up after the marathon, the volume of patella medial central(PMC) and patella medial superior(PMS) was significantly reduced compared with that before the marathon (P<0.05). At two months after the marathon, the volume of femoral lateral anterior(FLA) and tibial medial anterior(TMA) decreased significantly compared with that before the competition (P<0.05)
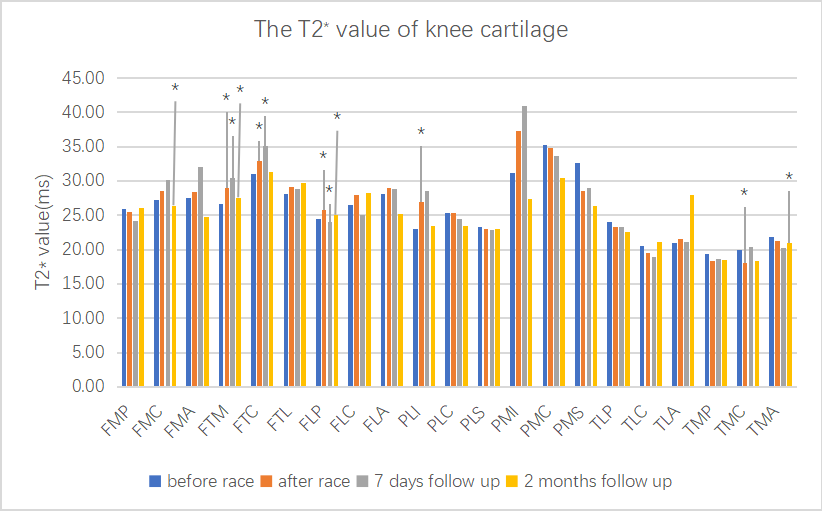
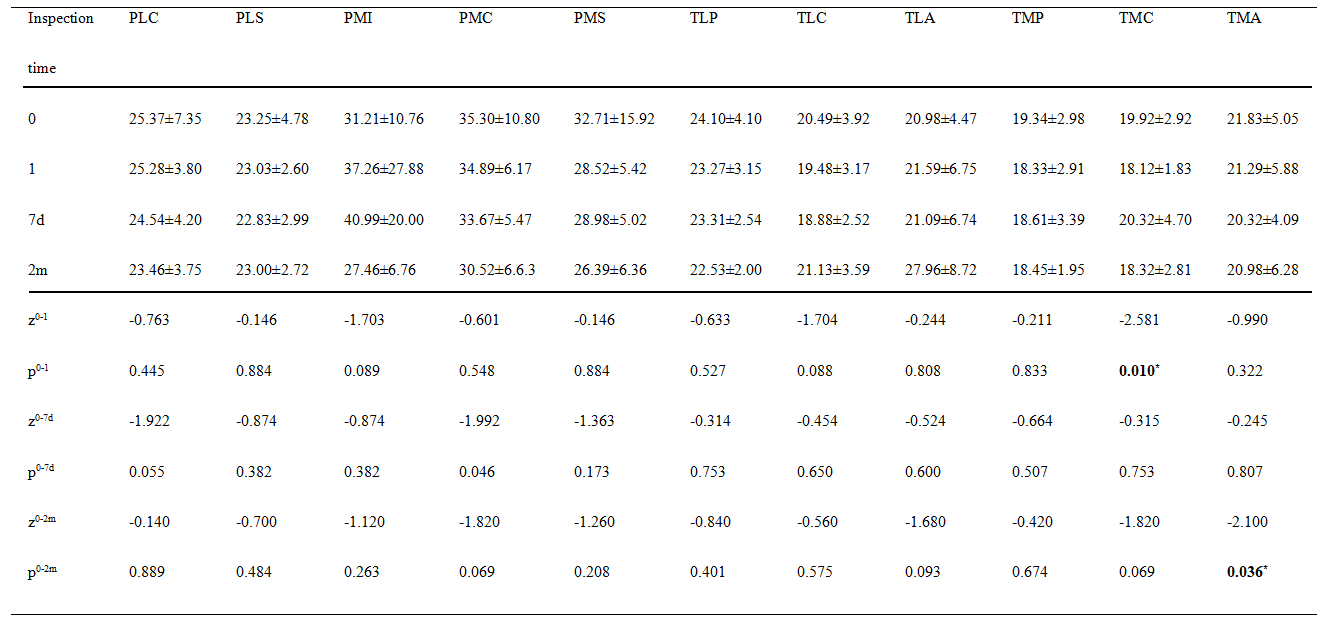
Within twelve hours after the marathon, the T2* values of femoral trochlea medial(FTM),femoral trochlea central(FTC), femoral lateral posterior(FLP), patella lateral inferior(PLI) and tibial medial central(TMC) changed significantly compared with those before the marathon(P<0.05). Among them, the T2* value of TMC decreased significantly while other sub-regions increased significantly. At the seven-day follow-up after the marathon, T2* values of FTM , FTC is still significantly higher than before the marathon (P<0.05), T2* values of femoral medial central(FMC), FTM, FLP are significantly higher during the two-month follow-up after the marathon(P<0.05), the T2* value of TMA was significantly lower than before the marathon (P<0.05)
Discussion
1.The change of thickness of knee cartilageIn this study, the thickness of TMA at two months after the competition was significantly thinner than that before the competition, which was consistent with previous research results[1,6].The thickness of PLC cartilage increased significantly within twelve hours after the competition, but there was no statistical difference between the following follow-up and the pre-competition, which to some extent indicated the reversibility of the change of cartilage thickness in this area. Whether it was caused by swelling and thickening under stimulated by long-distance running or the change of fluid flow in cartilage was unknown.
2.The change of volume of knee cartilage
In this study, no significant difference in cartilage volume was observed within twelve hours after the race compared with pre-competition. The possible reason is that the examination time after the competition is long and the cartilage volume has returned to the level of pre-competition. During the seven-day follow-up after the race, the volume of PMC and PMS decreased significantly compared with pre-competition, the volume of PMC and PMS returned to the level of pre-match, indicating the volume of cartilage was reversible to some extent.
3.The change of T2* values of knee cartilage
Some study proposed that the increase of T2 or T2* value was due to the loss of collagen fiber anisotropy in the collagen matrix, the increase of water content and the decrease of proteoglycan content in cartilage[7.8,9].In this study ,we found that the thickness, volume and T2* value of TMA did not return to the pre competition at the two-month follow-up, suggesting that the anterior part of the medial tibial plateau has the largest load during marathon exercise, and the morphology and internal structure of cartilage have changed significantly, which may be the high-risk area of cartilage degeneration[8].
Conclusion
First of all, we confirmed the T2*mapping technology precisely refects the biochemical and pathologic changes of articular cartilage and effectively responds to the injury and recovery over time, the method is noninvasive and quantitative,so it might become common method for assessing cartilage injury clinically. In addition, the semi-automatic cartilage segmentation prototype software can automatically segment articular cartilage and accurately measure various cartilage parameters. It subdivides each cartilage into different sub-regions, which contribute to observe the changes in the shape and function of cartilage in different sub-regions so as to guide clinical treatment and intervention in a more accurate area.Acknowledgements
None.References
[1] Hinterwimmer S, Feucht M J, Steinbrech C, et al. The effect of a six-month training program followed by a marathon run on knee joint cartilage volume and thickness in marathon beginners[J]. Knee Surg Sports Traumatol Arthrosc, 2014, 22(6): 1353-9.
[2] Gersing A S, Schwaiger B J, Nevitt M C, et al. Is Weight Loss Associated with Less Progression of Changes in Knee Articular Cartilage among Obese and Overweight Patients as Assessed with MR Imaging over 48 Months? Data from the Osteoarthritis Initiative[J]. Radiology, 2017, (No.2): 508-520.
[3] Nam J, Perera P, Liu J, et al. Transcriptome-wide gene regulation by gentle treadmill walking during the progression of monoiodoacetate-induced arthritis[J]. Arthritis Rheum, 2011, 63(6): 1613-25.
[4] Cha J G, Lee J C, Kim H J, et al. Comparison of MRI T2 relaxation changes of knee articular cartilage before and after running between young and old amateur athletes[J]. Korean J Radiol, 2012, 13(5): 594-601.
[5] Mosher T J, Smith H E, Collins C, et al. Change in knee cartilage T2 at MR imaging after running: a feasibility study[J]. Radiology, 2005: 245-249.
[6] Tj M, Y L, Cm T. Functional cartilage MRI T2 mapping: evaluating the effect of age and training on knee cartilage response to running[J]. Osteoarthritis and cartilage, 2010, (No.3): 358-364.
[7] Hesper T, Hosalkar H S, Bittersohl D, et al. T2* mapping for articular cartilage assessment: principles, current applications, and future prospects[J]. Skeletal Radiol, 2014, 43(10): 1429-45.
[8] Hesper T, Miese F R, Hosalkar H S, et al. Quantitative T2(*) assessment of knee joint cartilage after running a marathon[J]. Eur J Radiol, 2015, 84(2): 284-9.
[9] Subburaj K, Kumar D, Souza R B, et al. The Acute Effect of Running on Knee Articular Cartilage and Meniscus Magnetic Resonance Relaxation Times in Young Healthy Adults[J]. American Journal of Sports Medicine, 2012, (No.9): 2134.
Figures
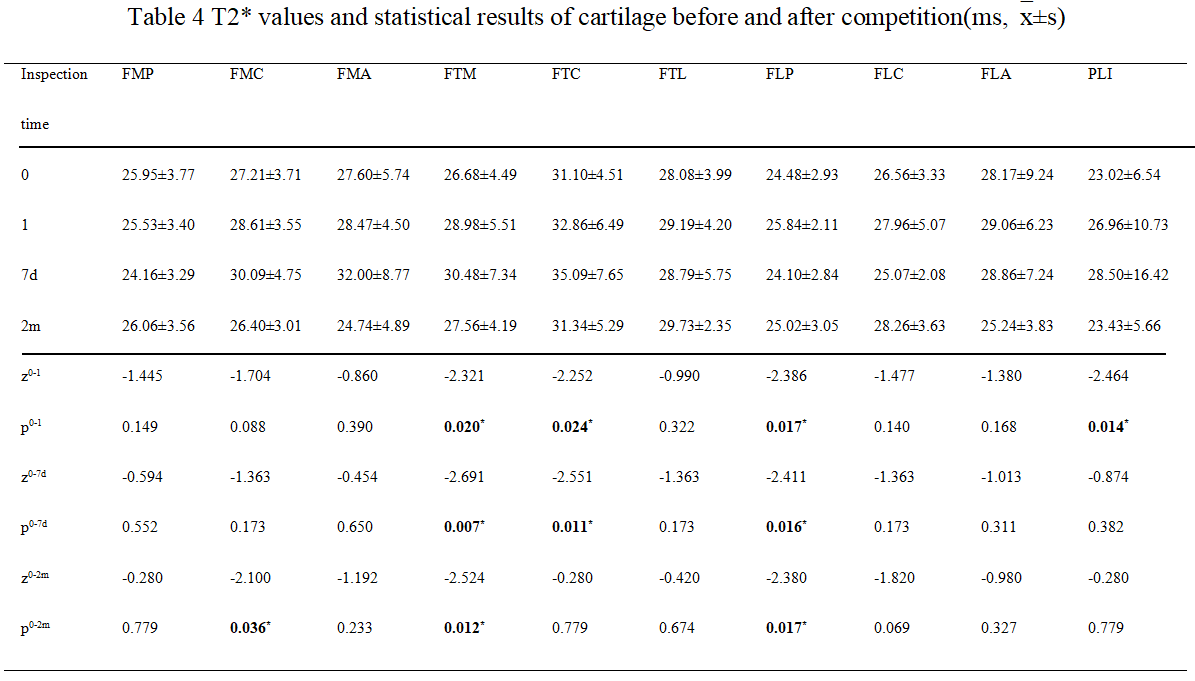
T2* values and statistical results of cartilage before and after competition
Note: 0: the results of pre competition, 1: the results within twelve hours after the competition, z0-1: the comparison results before and within twelve hours after the competition, z0-7d: the comparison results before and seven days after the competition, z0-2m: the comparison results before and after the competition in two months, * represents the difference is statistically significant