2976
Simultaneous Bilateral T1, T2, and T1ρ Relaxation Mapping of the Hip Joint with Magnetic Resonance Fingerprinting1Radiology, NYU Langone Health, New York, NY, United States, 2University of Queensland, Brisbane, Australia
Synopsis
MR imaging has an essential role in the diagnosis of hip disorders such as femoroacetabular impingement (FAI) and osteoarthritis (OA). An increase in pre-contrast T1 is reported in association with cartilage edema and fibrillation and both T2 and T1ρ are shown to be elevated in OA and FAI patients . This work investigates the feasibility of using the MRF sequence introduced in for simultaneous bilateral T1, T2, and T1ρ mapping of the hip joint and assessing the difference between the left and right side cartilage subregions.
Background
Quantitative MRI can detect the early biochemical changes in the cartilage, but its bilateral use in clinical routines is challengingPurpose
To demonstrate the feasibility of using magnetic resonance fingerprinting for bilateral simultaneous T1, T2, and T1ρ mapping of the hip joint.Methods
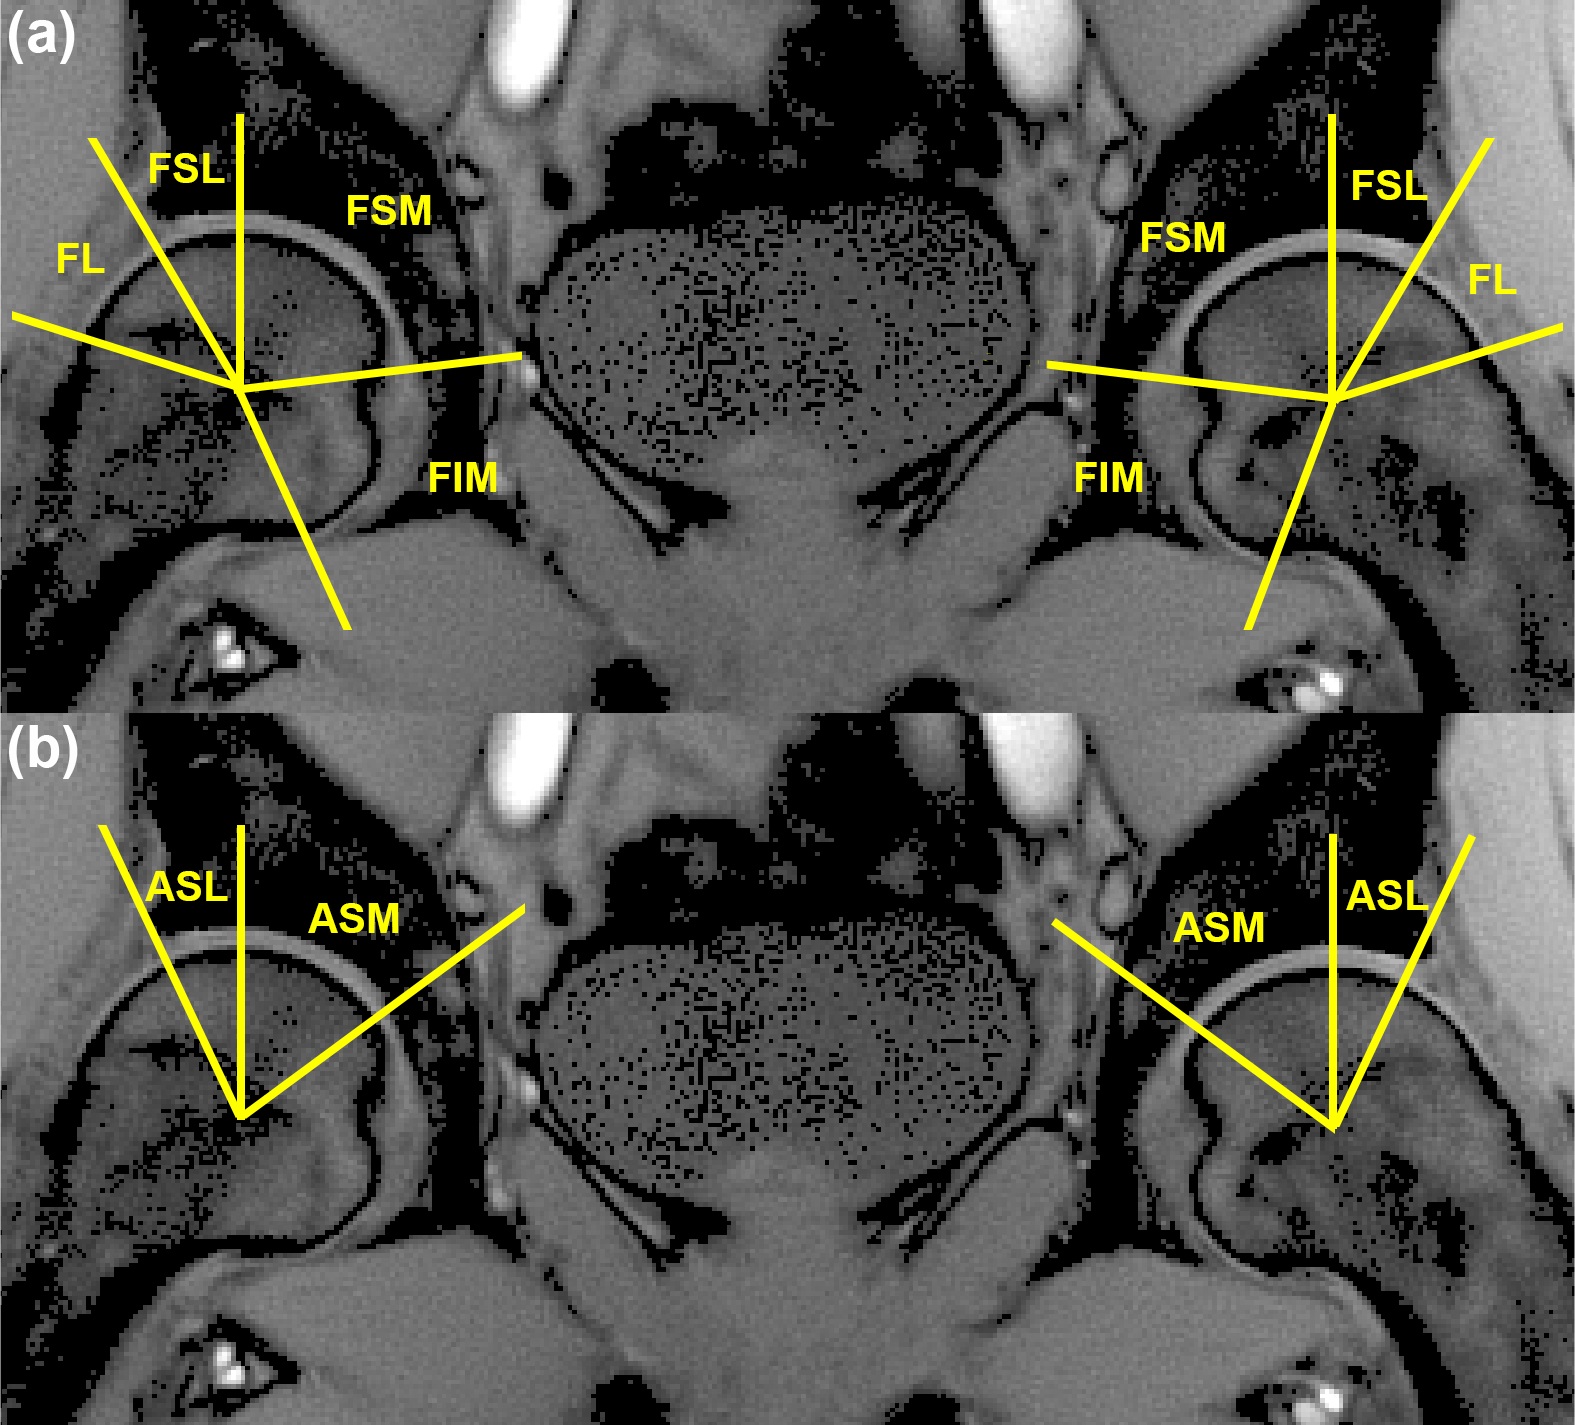
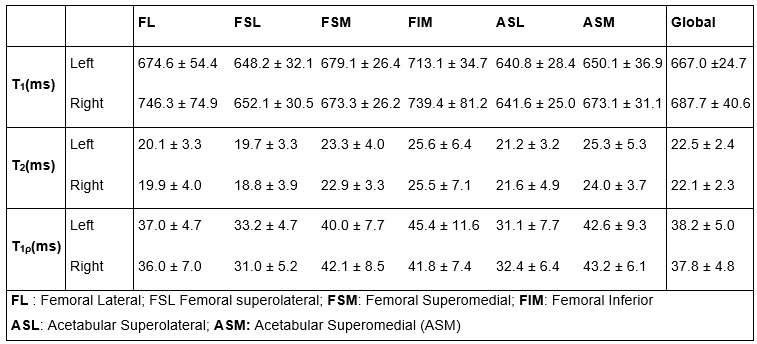
We recruited six healthy volunteers (6 males, mean age: 39 ± 8 years) with no history of OA or pain. IRB-approved scan was performed using the 2D balanced T1ρ-MRF(6). Two subjects were scanned twice two weeks apart to assess the in-vivo repeatability. Six coronal slices were acquired using the same protocol similar to body size phantom with 12 shots. The total scan time was 21:18min. The scans were reconstructed and matched with the simulated dictionary to obtain PD image and T1, T2, T1ρ relaxation and B1+ maps. Masks were drawn manually on the left and right hip joints using ITK-SNAP to segment the articular cartilage into two layers (femoral and acetabular) and six subregions, including femoral lateral (FL), superolateral (FSL), superomedial (FSM), and inferior (FIM) as well as acetabular superolateral (ASL) and superomedial (ASM) for comparison (Figure 1). Statistical analysis was performed using R 3.6.3 (R Core Team, 2020, ARTool v.0.10.7, 2020, coin, v 1.3-1, 2019) and MATLAB. The general align-and-rank nonparametric factorial analysis (7) was applied to assess the side’s impact on the subregions and layers. A nonparametric Wilcoxon test was applied to provide pair-wise comparisons between femoral and acetabular layers, and Kruskal–Wallis test was used to compare six subregions. Bland-Altman plots were created to evaluate the repeatability.Results
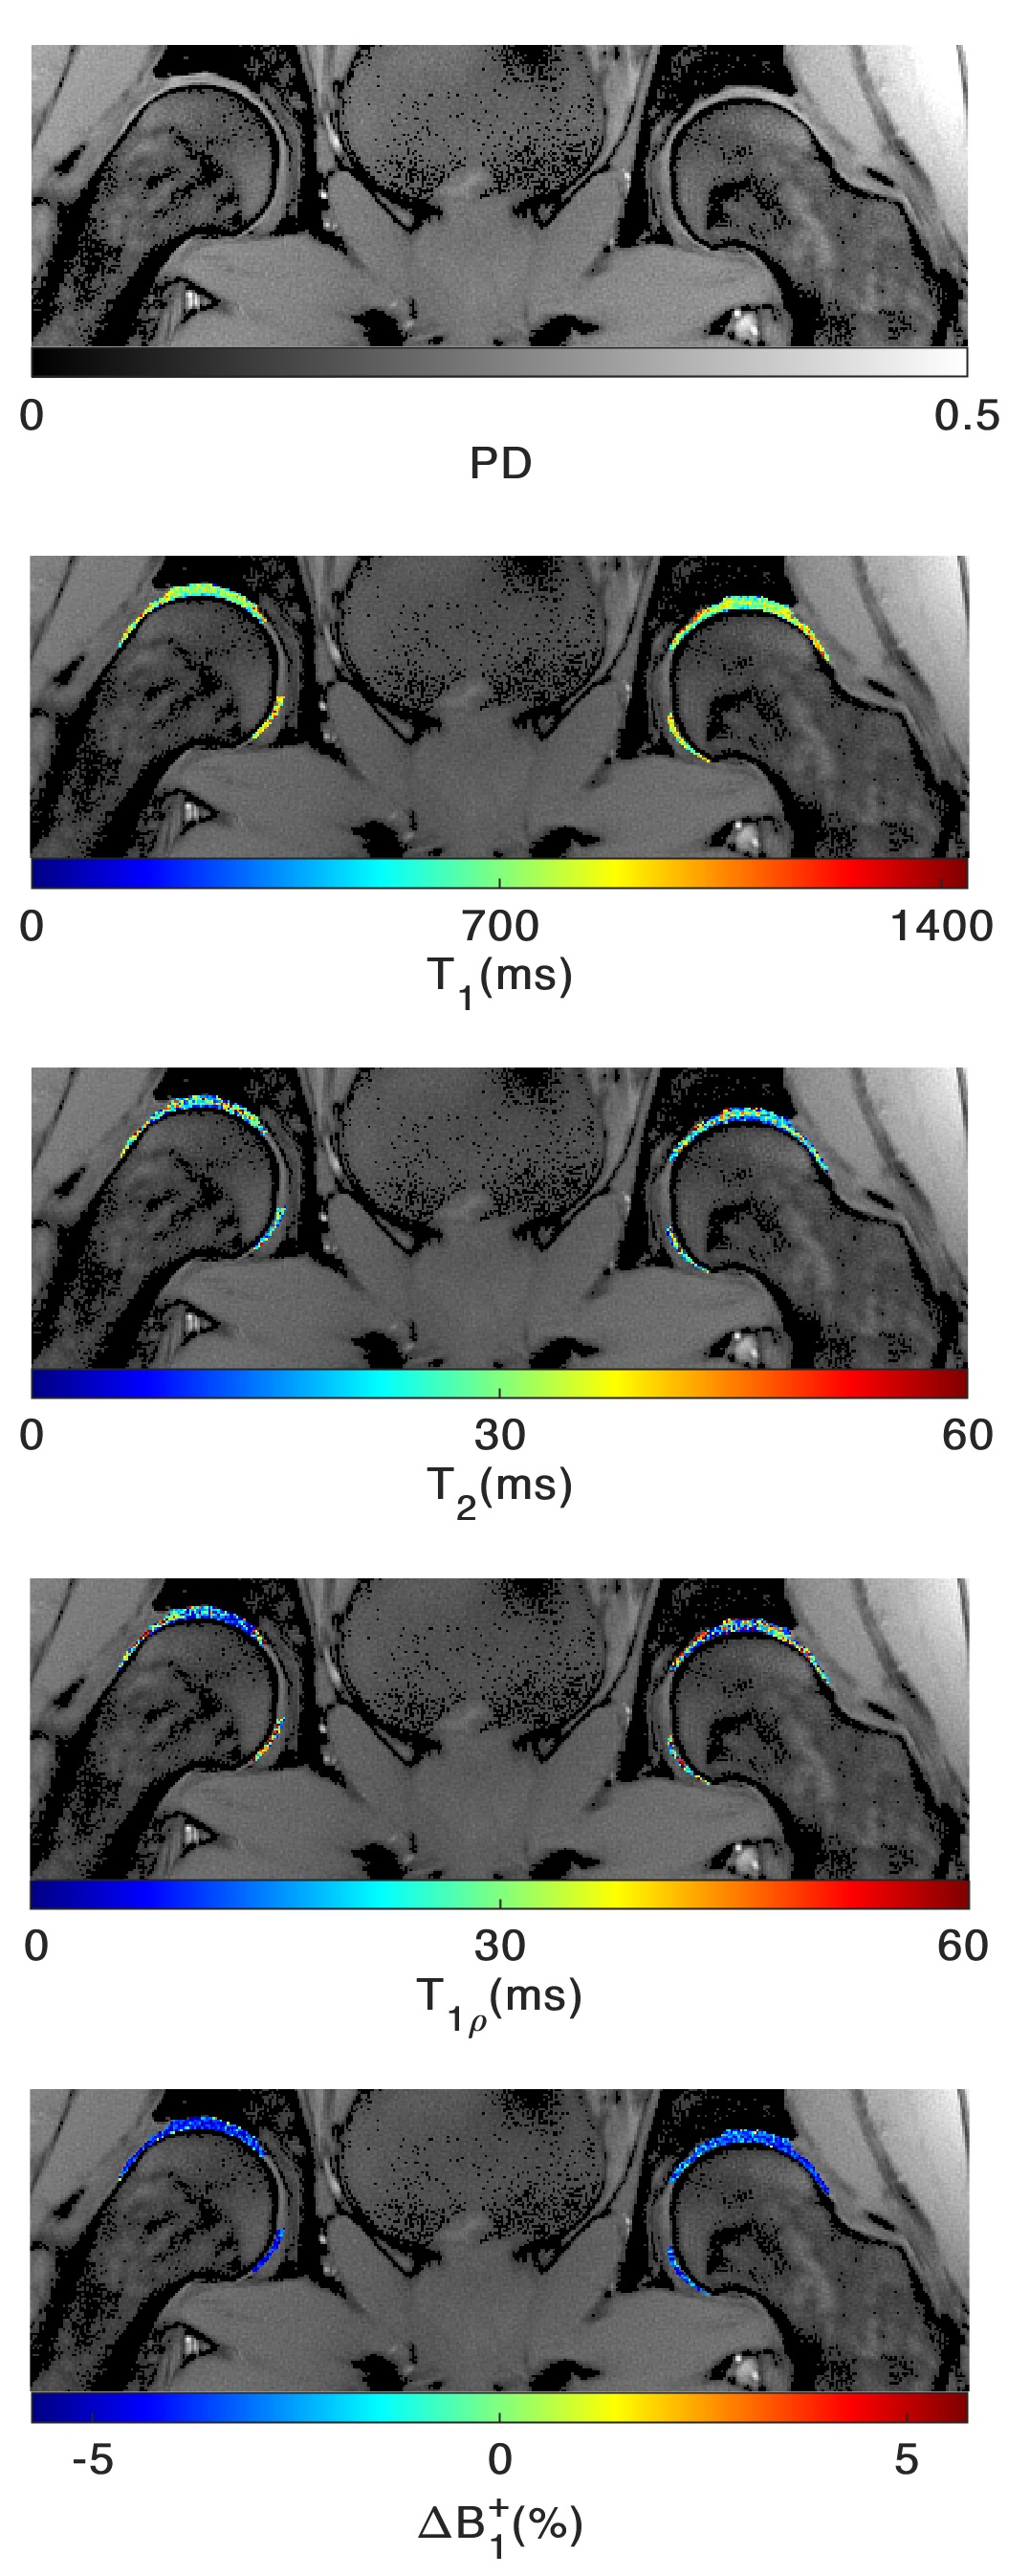
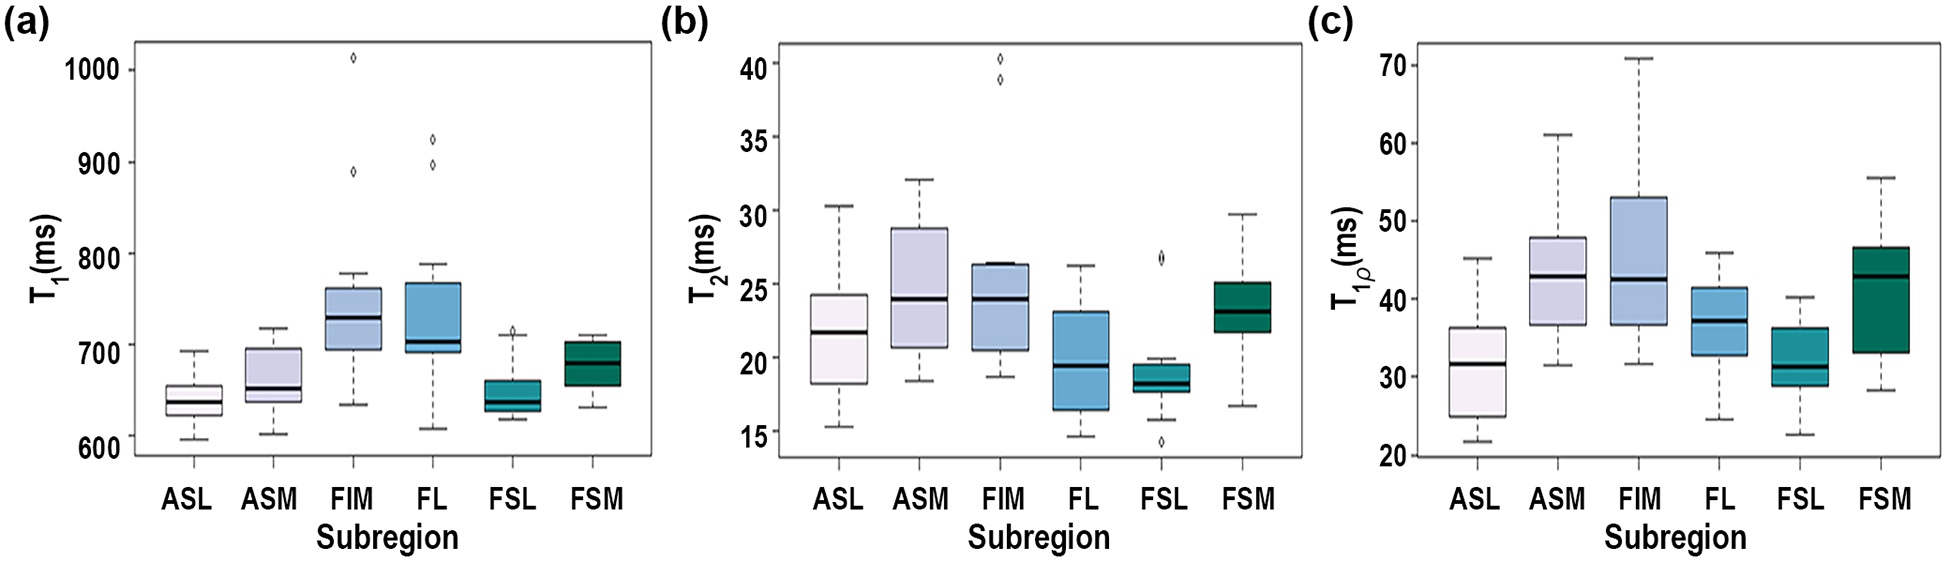
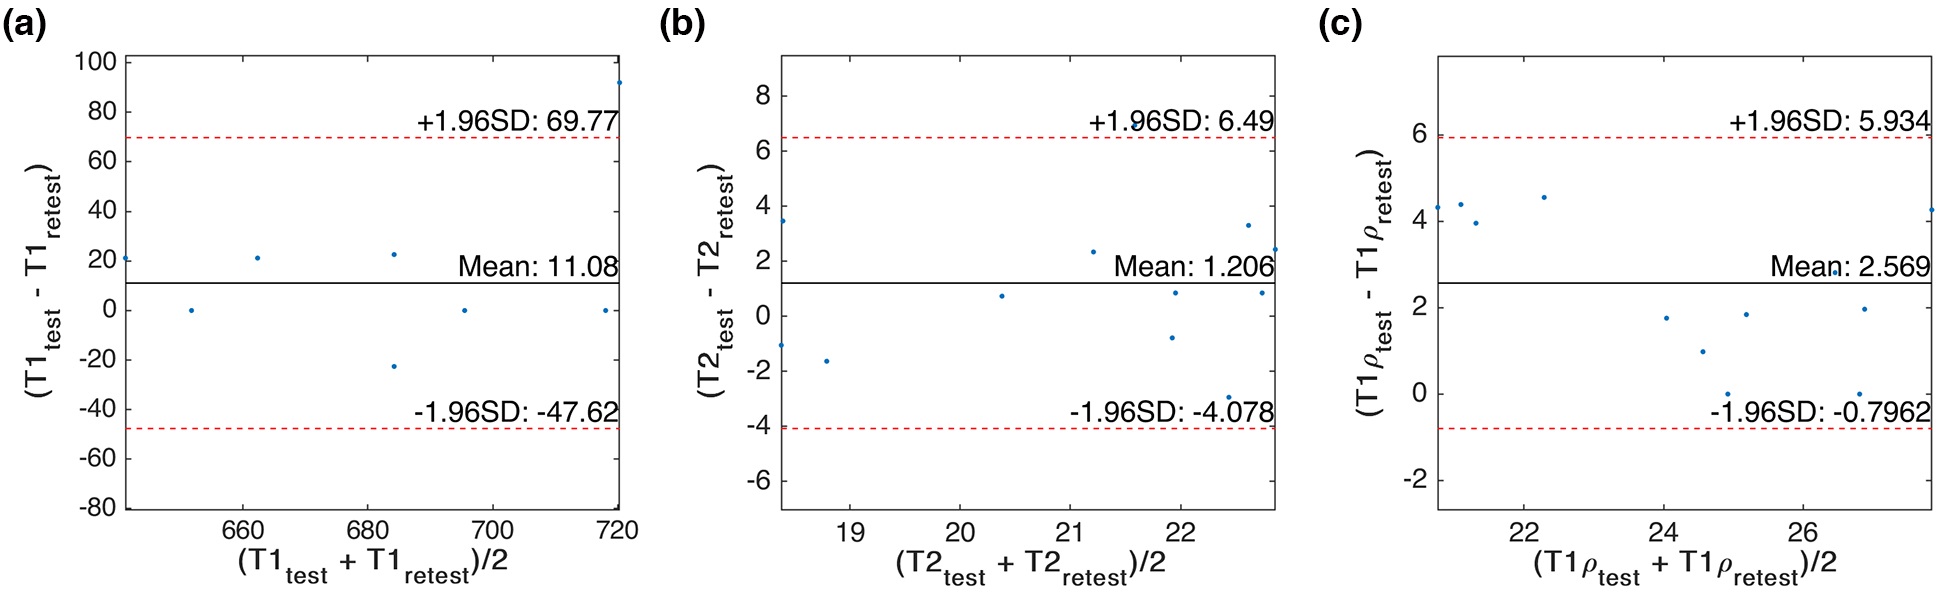
Figure 2 shows the representative PD image and T1, T2, T1ρ relaxation maps of the hip articular cartilage. The global average (Mean ± SD) of T1: 676.0 ± 45.4, 687.6 ± 44.5, T2: 22.5 ± 2.6, 22.1 ± 2.5, and T1ρ: 38.2 ± 5.5, 38.2 ± 5.5 were measured in the left and right hip, respectively. The summary of relaxation measurements is shown in Table 1. The general align-and-rank non-parametric factorial analysis revealed no significant interaction between hip side and the subregions (F(5, 55) = 0.38, p = 0.8 for T1, F(5, 55) = 0.02, p = 0.9 for T2, and F(5, 55) = 0.39, p = 0.8 for T1ρ). However, the Kruskal-Wallis test results showed a significant difference between the relaxation times of different subregions regardless of the hip side (p < 0.001 for T1, p = 0.012 for T2, and p<0.001 for T1ρ). The Wilcoxon test results showed that T1 in femoral cartilage was significantly (p<0.003) higher than in the acetabular cartilage. The boxplot comparisons between subregions are shown in Figure 3. The analysis of Bland-Altman plots (Figure 4) showed 11.1ms, 1.2ms, and 2.6ms difference between test and retest, and the CVrms for T1, T2 and T1ρ were 1%, 2%, and 4%, respectively, which showed an excellent agreement between test and retest scansDiscussion and Conclusion
We demonstrated the feasibility of using an MRF sequence for simultaneous bilateral mapping of T1, T2, T1ρ, and B1+ in a single scan that could potentially be used to study early biochemical cartilage degeneration in hip diseases such as OA and FAI.Acknowledgements
This study was supported by NIH grants R21 AR075259, R01 AR076328, R01 AR067156, R01 AR070297, and R01 AR068966, and was performed under the rubric of the Center of Advanced Imaging Innovation and Research (CAI2R), and NIBIB Biomedical Technology Resource Center (NIH P41 EB017183).References
1. Gabriel H, Fitzgerald SW, Myers MT, Donaldson JS, Poznanski AK. MR imaging of hip disorders. Radiographics 1994;14:763–781 doi: 10.1148/radiographics.14.4.7938767.
2. Tiderius CJ, Olsson LE, Leander P, Ekberg O, Dahlberg L. Delayed gadolinium-enhanced MRI of cartilage (dGEMRIC) in early knee osteoarthritis. Magn. Reson. Med. 2003;49:488–492 doi: 10.1002/mrm.10389.
3. Gillis A, Gray M, Burstein D. Relaxivity and diffusion of gadolinium agents in cartilage. Magn. Reson. Med. 2002;48:1068–1071 doi: 10.1002/mrm.10327.
4. Carballido-Gamio J, Link TM, Li X, et al. Feasibility and reproducibility of relaxometry, morphometric, and geometrical measurements of the hip joint with magnetic resonance imaging at 3T. J. Magn. Reson. Imaging 2008;28:227–235 doi: 10.1002/jmri.21411.
5. Subburaj K, Valentinitsch A, Dillon AB, et al. Regional variations in MR relaxation of hip joint cartilage in subjects with and without femoralacetabular impingement. Magn. Reson. Imaging 2013;31:1129–1136 doi: 10.1016/j.mri.2013.01.009.
6. Sharafi A, Zibetti MVW, Chang G, Cloos M, Regatte RR. MR fingerprinting for rapid simultaneous T1, T2, and T 1 ρ relaxation mapping of the human articular cartilage at 3T. Magn. Reson. Med. 2020;0:1–9 doi: 10.1002/mrm.28308.
7. Wobbrock JO, Findlater L, Gergle D, Higgins JJ. The Aligned Rank Transform for Nonparametric Factorial Analyses Using Only Anova Procedures. In: Proceedings of the SIGCHI Conference on Human Factors in Computing Systems. CHI ’11. New York, NY, USA: Association for Computing Machinery; 2011. pp. 143–146. doi: 10.1145/1978942.1978963
Figures