2974
An efficient $$$R_{1\rho}$$$ dispersion imaging method for the human knee cartilage using constant magnetization prepared turbo-FLASH1Dept. of Radiology, University of Michigan, Ann Arbor, MI, United States, 2School of Kinesiology, University of Michigan, Ann Arbor, MI, United States, 3Dept. of Orthopaedic Surgery, University of Michigan, Ann Arbor, MI, United States
Synopsis
An efficient $$$R_{1\rho}$$$ dispersion imaging method is presented for clinical studies of the human knee cartilage at 3T. Eight constant magnetizations were prepared by tailoring both duration and amplitude of a fully-refocused spin-lock preparation pulse. The limited initial magnetization dynamic range was expanded by the measure from the magic angle location in the deep femoral cartilage. The proposed method was applied to four asymptomatic knees from three subjects. The results from repeated scans and from comparisons with the literature indicate that the proposed method is a promising tool to further explore $$$R_{1\rho}$$$ dispersion of human knee cartilage in clinical settings.
INTRODUCTION
Quantitative $$$R_{1\rho}$$$ dispersion can provide a unique information about collagen integrity in cartilage.1 Conventional $$$R_{1\rho}$$$ dispersion imaging acquisition can take as long as one hour1-2 and thus deems to be impractical for clinical usages. There exists an unmet need to develop an efficient and reliable acquisition protocol to further explore quantitative $$$R_{1\rho}$$$ dispersion of the human knee cartilage in vivo. Hence, the aim of this work is to present a practical $$$R_{1\rho}$$$ dispersion imaging method in clinical settings.METHODS
(1) Theory: Considering only (residual) dipolar interaction relaxation mechanism at 3T1, an image voxel signal $$$S(TSL, \omega_1)$$$, from $$$R_{1\rho}$$$-weighted image of cartilage can be expressed using Equations 1-2,$$S(TSL,\omega_{1})=S_{0}exp(-R_{1\rho}*TSL) \; (1)$$
$$R_{1\rho}=R_2^i+\frac{R_2^a(\theta)}{1+4\omega_1^2\tau_b^2}\; (2)$$
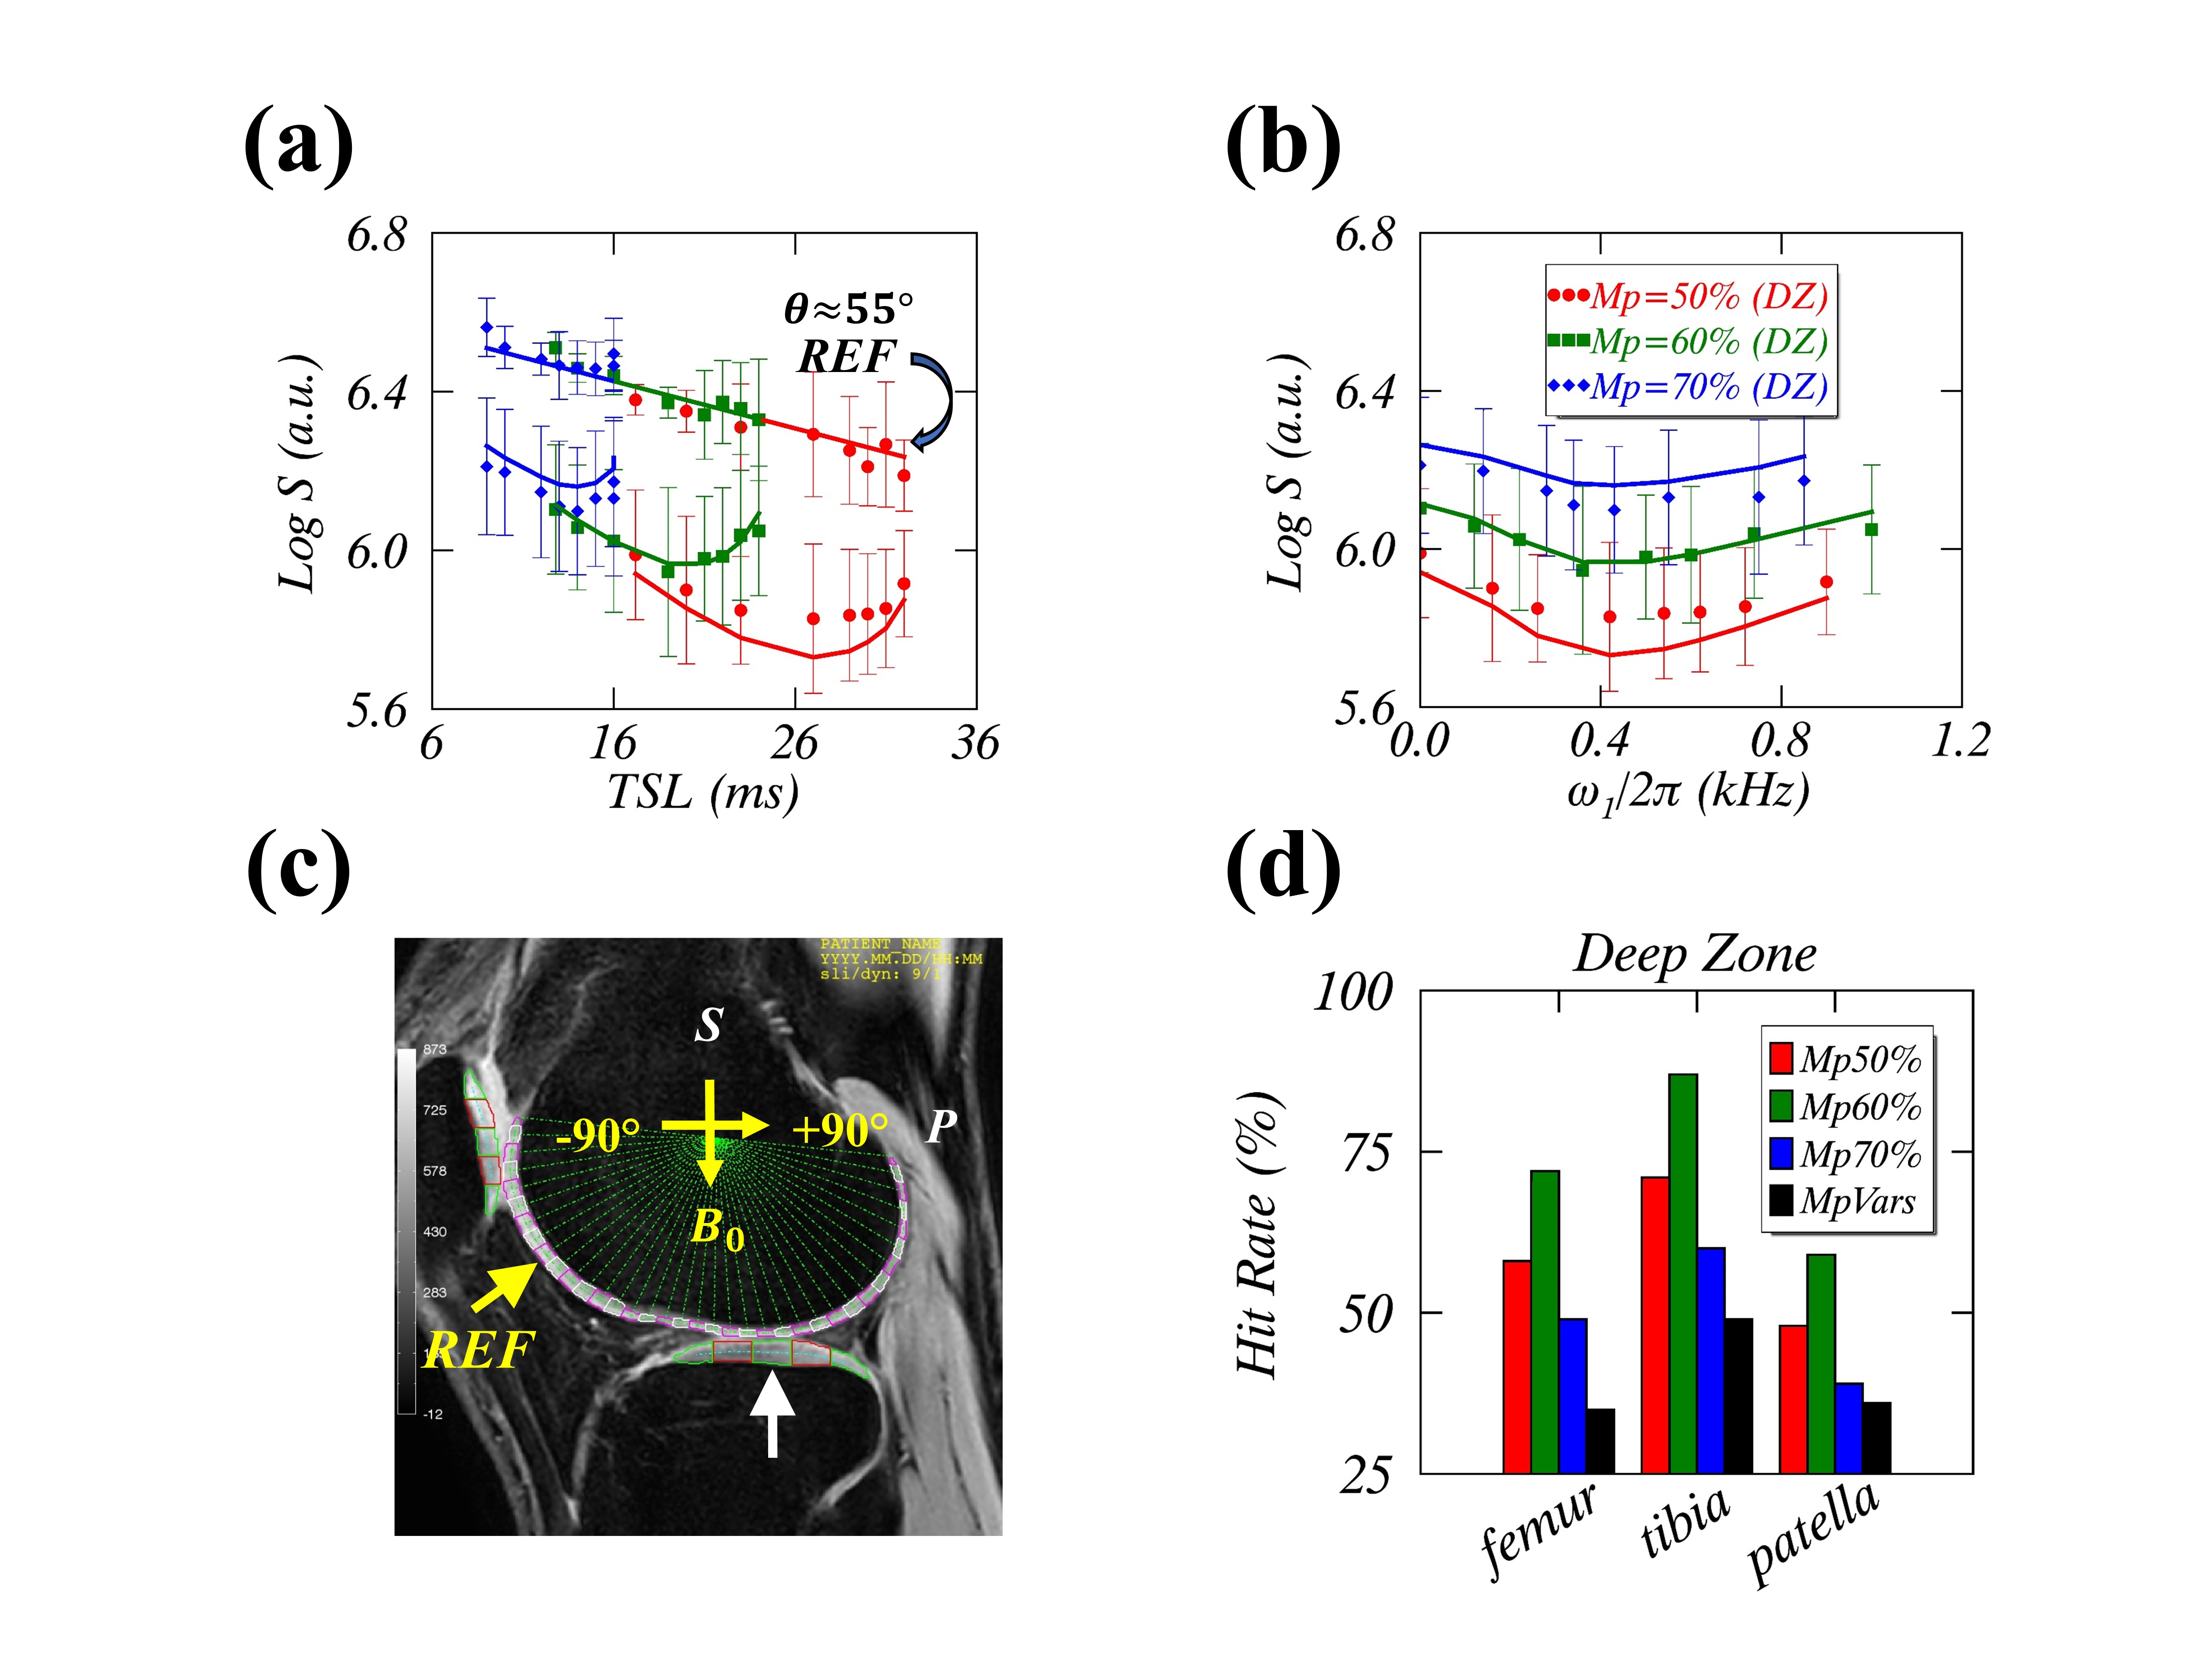
where $$$S_0$$$, $$$R_2^i$$$, $$$R_2^a$$$, $$$\tau_b$$$, $$$TSL$$$, and $$$\omega_{1}$$$ denote respectively an initial signal, an isotropic and an anisotropic relaxation rates, an anisotropic correlation time, and spin-lock (SL) duration and strength. Average values of $$$R_2^i$$$=20 (1/s), $$$R_2^a$$$=20 (1/s), and $$$\tau_b$$$=300 (μs) in the human knee cartilage could be inferred from the literature,2 whereas $$$TSL$$$ and $$$\omega_{1}$$$ are user’s input parameters. Accordingly, a normalized constant prepared magnetization $$$M_{prep}$$$, defined as $$$exp(-R_{1\rho}*TSL)$$$, could be obtained by simultaneously increasing both $$$TSL$$$ and $$$\omega_{1}$$$, as demonstrated in Figure 1c (red dots). The limited $$$M_{prep}$$$ dynamic range was expanded by the measure, equivalent to that with $$$\omega_{1}=\infty$$$, from the magic angle location in the deep femoral cartilage.3 (2) An optimized $$$R_{1\rho}$$$ dispersion imaging sequence: Figures 1a-b sketch the proposed sequence including a recently developed SL preparation cluster that is less prone to $$$B_0$$$ and $$$B_1$$$ inhomogeneity artifacts4-5, and an optimal excitation flip angle (FA=13°) for FLASH based on an analytical function6 given that the cartilage $$$T_1$$$=1240 ms, TR=6.8 ms, number of profiles (N=64) per segmentation, and $$$M_{prep}$$$=50-70%, as used in this study. (3) Human knee cartilage studies: Three volunteers participated in the current proof-of-concept study at 3T. The 1st had his bilateral knee scanned using three protocol with $$$M_{prep}$$$=50%, 60%, and 70%, each containing 8 pairs of $$$TSL$$$ (ranging from 9 to 32 ms) and $$$\omega_{1}$$$ (from 0 to 1kHz). After evaluating the success fitting (SF) rates, defined as the relative errors in the fitted model parameters < 100%, the protocol with $$$M_{prep}$$$=60% was applied to the 2nd and the 3rd subjects’ unilateral knee, and repeated after a 3-month gap. (4) Quantitative $$$R_{1\rho}$$$ dispersion analysis: Eqs. 1-2 were fitted to angularly-radially segmented ROIs in the femoral, tibial and patellar cartilage, and the fitting results were compared with previously reported values in the literature.1,9 With fitted $$$R_2^a$$$ and $$$\tau_b$$$, an orientation-independent order parameter $$$S$$$ can be determined.1 The goodness of fit was loosely defined by R-squared ($$$R^2$$$). All data analysis were performed with an in-house software developed in IDL 8.5 (Harris Geospatial Solutions, Inc, Boulder, CO).
RESULTS AND DISCUSSION
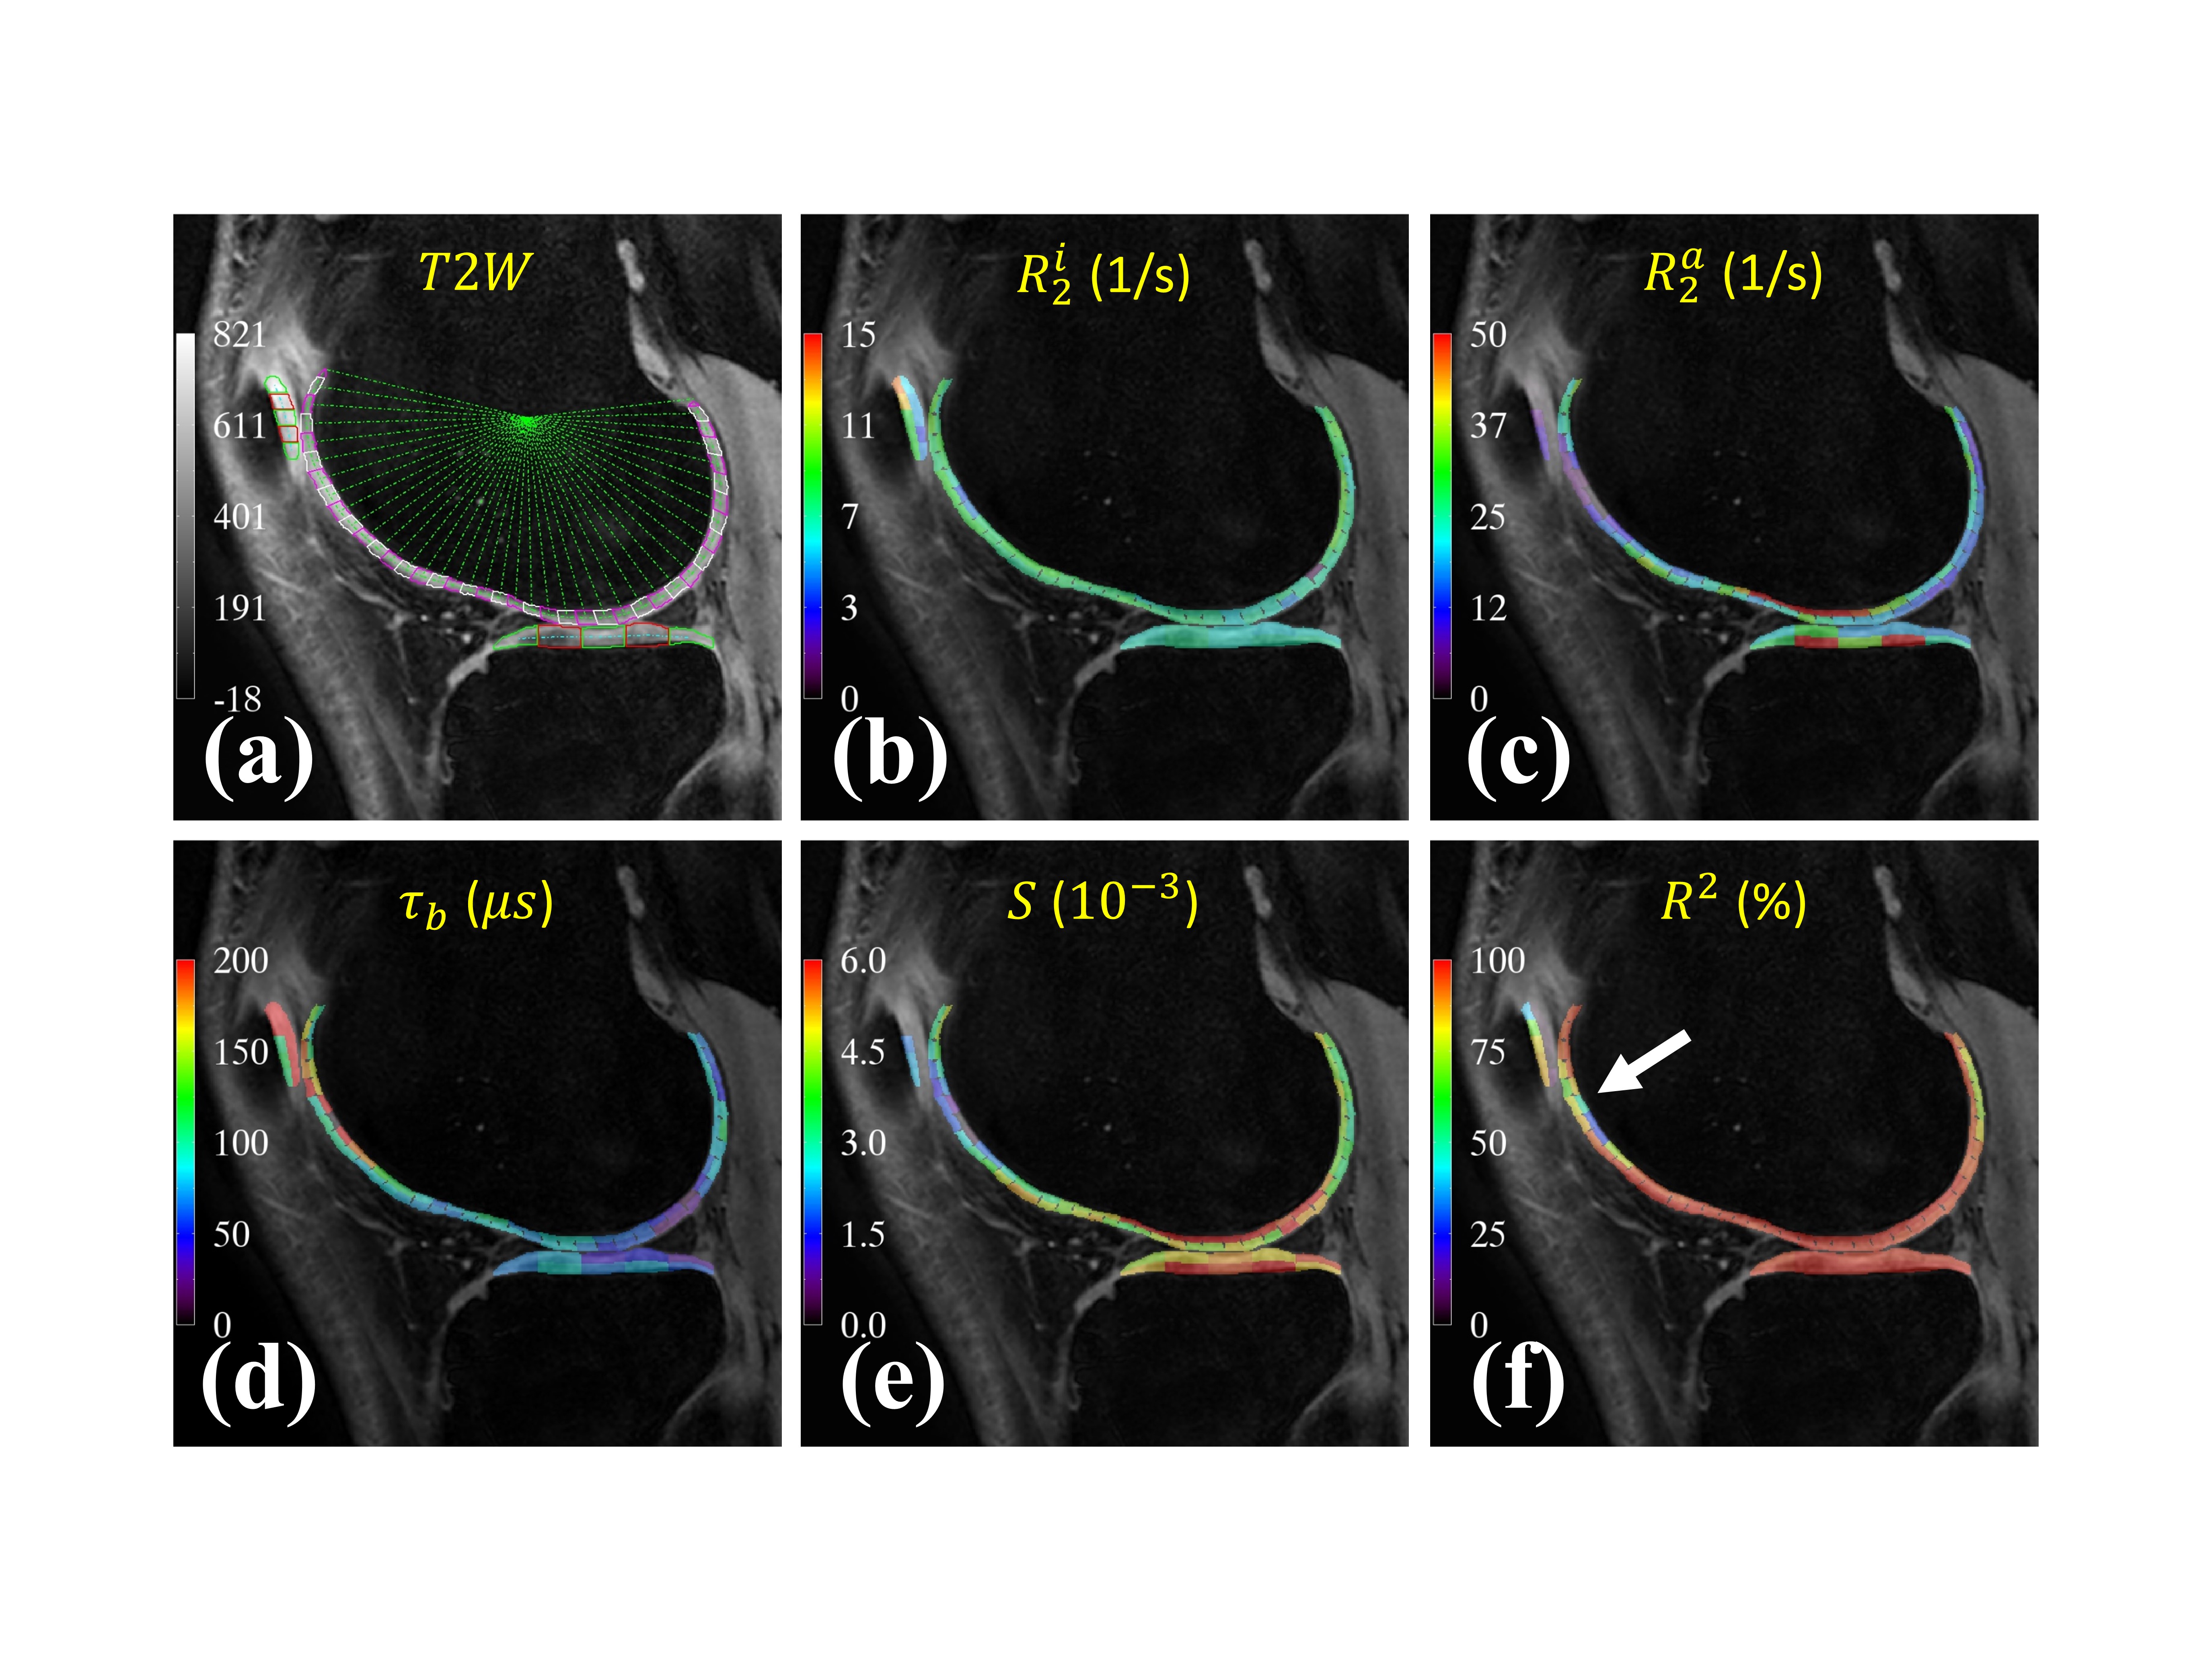
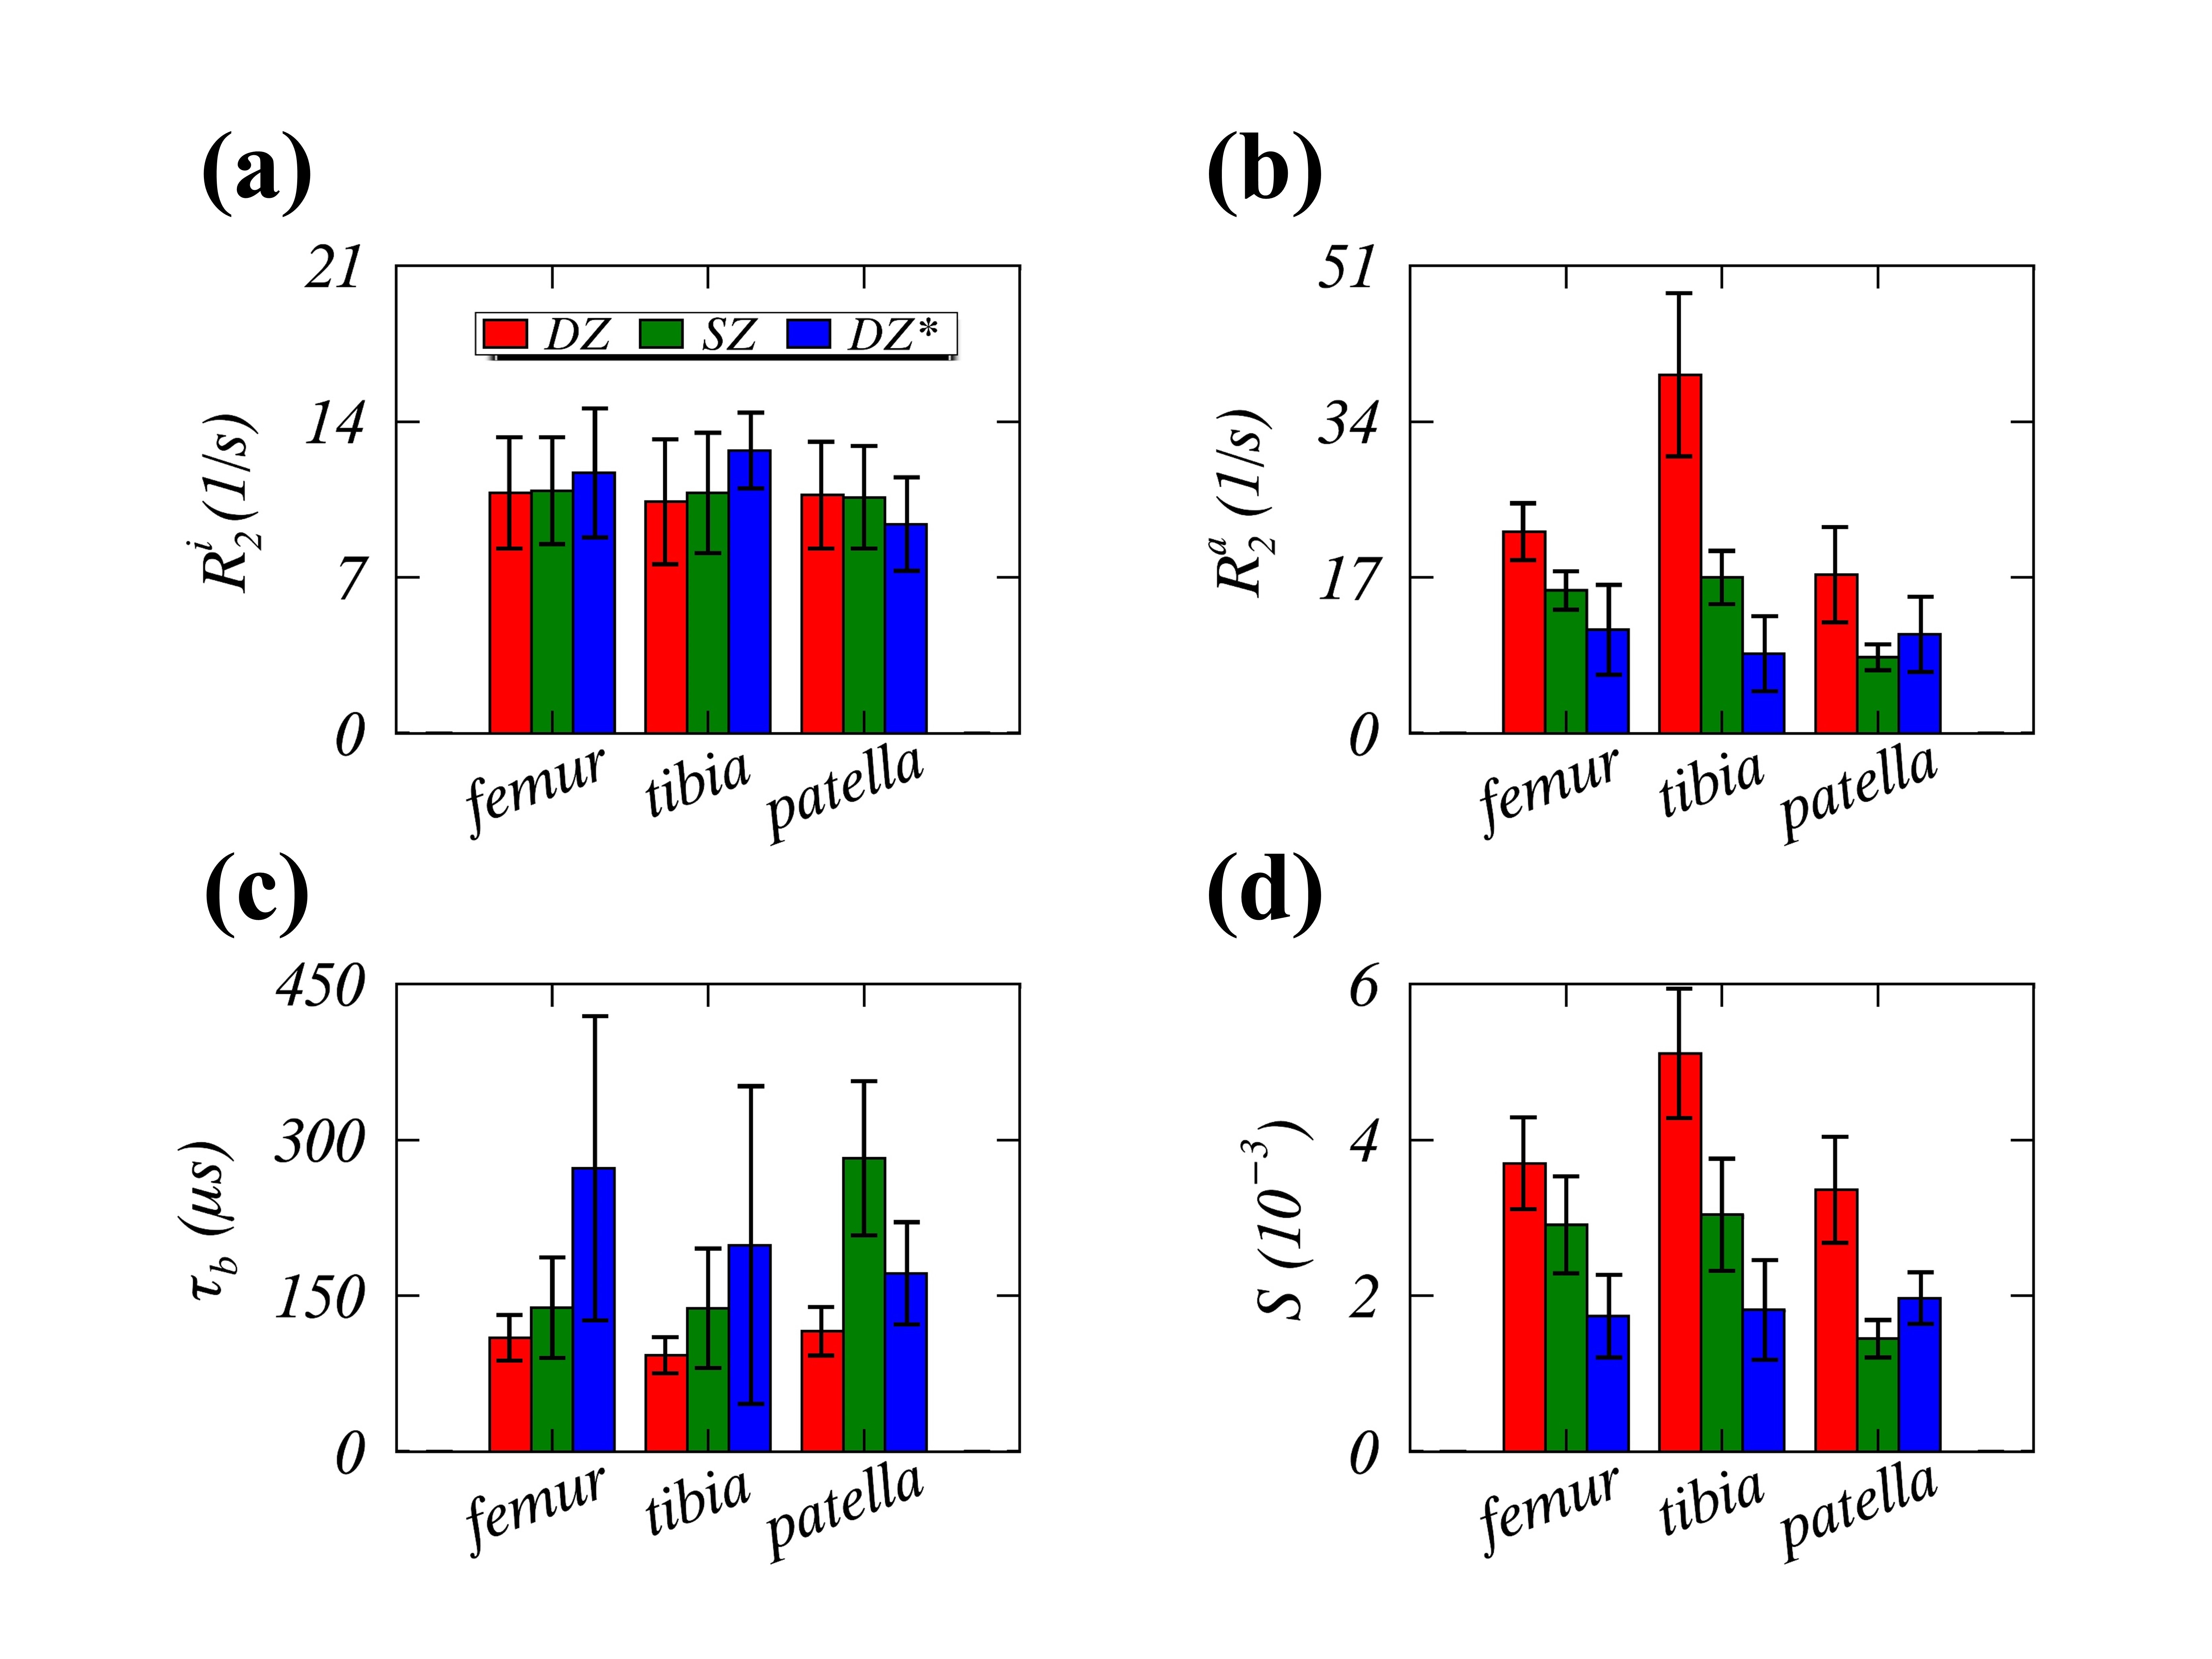
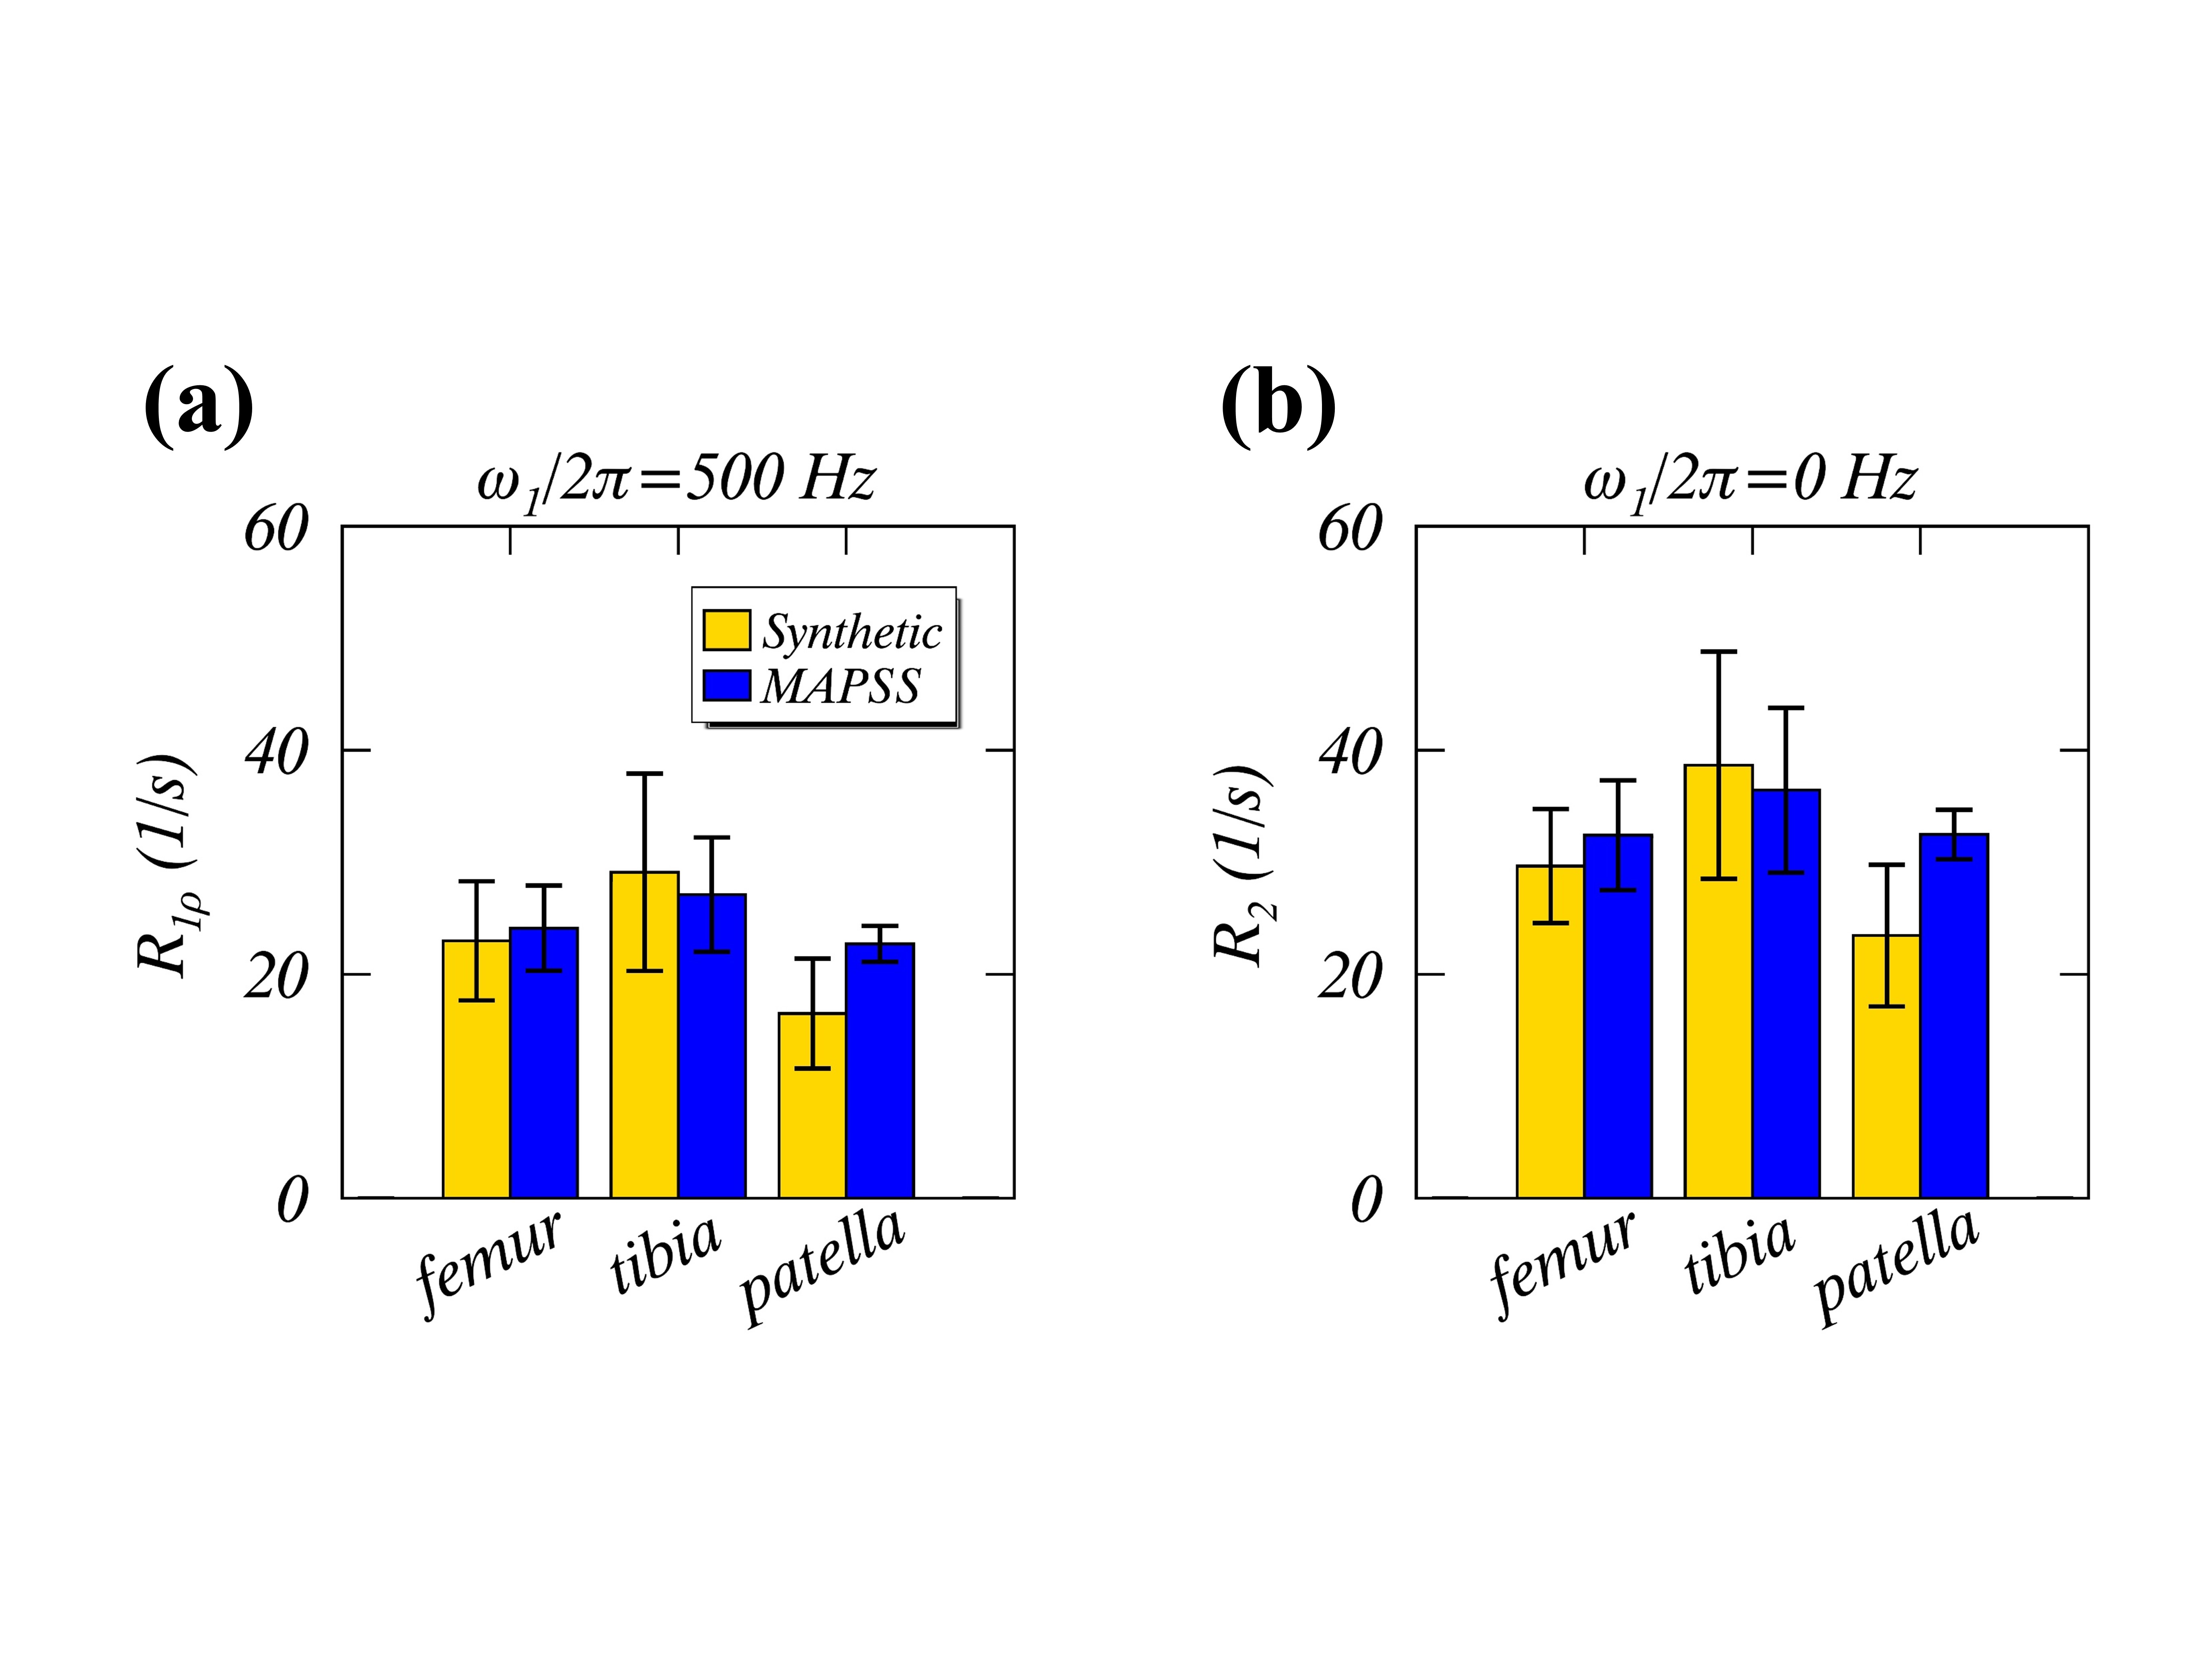
Figure 1c presents a 2D map of $$$M_{prep}$$$, highlighting the difference between the proposed (red dots) and the standard (while dots) acquisition strategies. The proposed method took only 9.2 minutes to collect 8 constant $$$R_{1\rho}$$$-weighting images. Figures 1d-e demonstrate that a clustered $$$M_{prep}$$$ will evolve similarly toward steady state, making irrelevant the so-called k-space filtering effect that has plagued the standard $$$R_{1\rho}$$$ acquisition without evoking time-consuming phase cycling7 or complicated FA tailoring schemes.8 Figures 2a-b illustrate three measured (symbols) and modeled (lines) $$$R_{1\rho}$$$ dispersion profiles from one segmented ROI (white arrow in Figure 2c) of the 1st subject, using the protocol with $$$M_{prep}$$$ of 50% (red), 60% (green) and 70% (blue). The protocol with $$$M_{prep}$$$=60% demonstrated good (<5%) repeatability quantified by the intra- and inter-subject’s coefficient of variations (data not shown); furthermore, it provided the highest SF rates or hit rates (73%) among others including the previously used ($$$MpVars$$$) standard $$$R_{1\rho}$$$ dispersion imaging.1 Figure 3 exemplifies $$$R_{1\rho}$$$ dispersion quantification from the 3rd subject’s knee. An anatomical T2W sagittal image is presented (a) superimposed with segmented ROIs. The ROI-based parametric color maps, i.e. $$$R_2^i$$$(b), $$$R_2^a$$$(c), $$$\tau_b$$$(d), $$$S$$$(e) and $$$R^2$$$(f), were overlaid on T2W image. Around the trochlear cartilage as indicated by a white arrow (f), the decreased $$$R^2$$$ values indicated less reliable $$$R_{1\rho}$$$ dispersion quantification, probably resulting from a vanishing residual dipolar interaction near the MA orientation. Figure 4 summarizes the average fitted $$$R_2^i$$$(a), $$$R_2^a$$$(b), $$$\tau_b$$$(c) and $$$S$$$(d) from this study ($$$M_{prep}$$$=60%) and from the previous1, showing that the fits in the deep zone (DZ, red) were comparable with (i.e. $$$R_2^i$$$), smaller than (i.e. $$$\tau_b$$$) and larger (i.e. $$$R_2^a$$$ and $$$S$$$) than those in the superficial zone (SZ, green). With respect to the current study (red), the previous (blue) $$$R_2^a$$$ (1/s) was significantly reduced in the femoral and tibial cartilage while the $$$R_2^i$$$ (1/s) was not significantly different across all three cartilage compartments. On average, the previously reported $$$\tau_b$$$ and $$$S$$$ values were respectively about twice and half of those from the current study. Figure 5 compares the synthetic (gold bars) $$$R_{1\rho, 500Hz}$$$ (a) and $$$R_2$$$ (b) from this study, with those (blue bars) measured using the state-of-the-art $$$R_{1\rho}$$$ and $$$R_2$$$ mapping (MAPSS) sequences,9 indicating that the comparable results were found in the femoral, tibial but not patellar cartilage.CONCLUSION
In conclusion, an efficient $$$R_{1\rho}$$$ dispersion MR imaging protocol has been developed for clinical studies of human knee cartilage at 3T.Acknowledgements
We would like to thank Prof. Thomas Chenevert for support and encouragement, and Suzan Lowe and James O’Connor for help in collecting human knee images. This work was supported in part by the Eunice Kennedy Shriver National Institute of Child Health & Human Development of the National Institutes of Health (NIH) under Award Number R01HD093626 (to Prof. Riann Palmieri-Smith) and a Discovery Grant by the University of Michigan – Peking University Health Science Center (UM-PUHSC) Joint Institute (to Prof. Tristan Maerz). The content is solely the responsibility of the authors and does not necessarily represent the official views of the NIH.References
- Pang Y. An order parameter without magic angle effect (OPTIMA) derived from R1ρ dispersion in ordered tissue. Magn Reson Med 2019. DOI: 10.1002/mrm.28045.
- Wang P, Block J, Gore JC. Chemical exchange in knee cartilage assessed by R1rho (1/T1rho) dispersion at 3T. Magn Reson Imaging 2015;33(1):38-42.
- Pang Y, Palmieri-Smith RM, Malyarenko DI, Swanson SD, Chenevert TL. A unique anisotropic R2 of collagen degeneration (ARCADE) mapping as an efficient alternative to composite relaxation metric (R2 -R1 rho ) in human knee cartilage study. Magn Reson Med 2019;81(6):3763-3774.
- Pang Y. A self-compensated spin-locking scheme for quantitative R1ρ dispersion in articular cartilage. In: Proceedings of the 28th Annual Meeting of ISMRM, Paris, France, 2020. (abstract: 2743).
- Gram M, Seethaler M, Gensler D, Oberberger J, Jakob PM, Nordbeck P. Balanced spin‐lock preparation for B1‐insensitive and B0‐insensitive quantification of the rotating frame relaxation time T1ρ. Magnet Reson Med 2020. https://doi.org/10.1002/mrm.28585.
- Vlaardingerbroek MT, Boer JA. Magnetic resonance imaging: theory and practice: Springer Science & Business Media; 2013.
- Li X, Han ET, Busse RF, Majumdar S. In vivo T(1rho) mapping in cartilage using 3D magnetization-prepared angle-modulated partitioned k-space spoiled gradient echo snapshots (3D MAPSS). Magn Reson Med 2008;59(2):298-307.
- Johnson CP, Thedens DR, Kruger SJ, Magnotta VA. Three‐Dimensional GRE T1rho mapping of the brain using tailored variable flip‐angle scheduling. Magnet Reson Med 2020;84(3):1235-1249.
- Wyatt C, Guha A, Venkatachari A, Li XJ, Krug R, Kelley DE, Link T, Majumdar S. Improved differentiation between knees with cartilage lesions and controls using 7T relaxation time mapping. J Orthop Transl 2015;3(4):197-204.
Figures
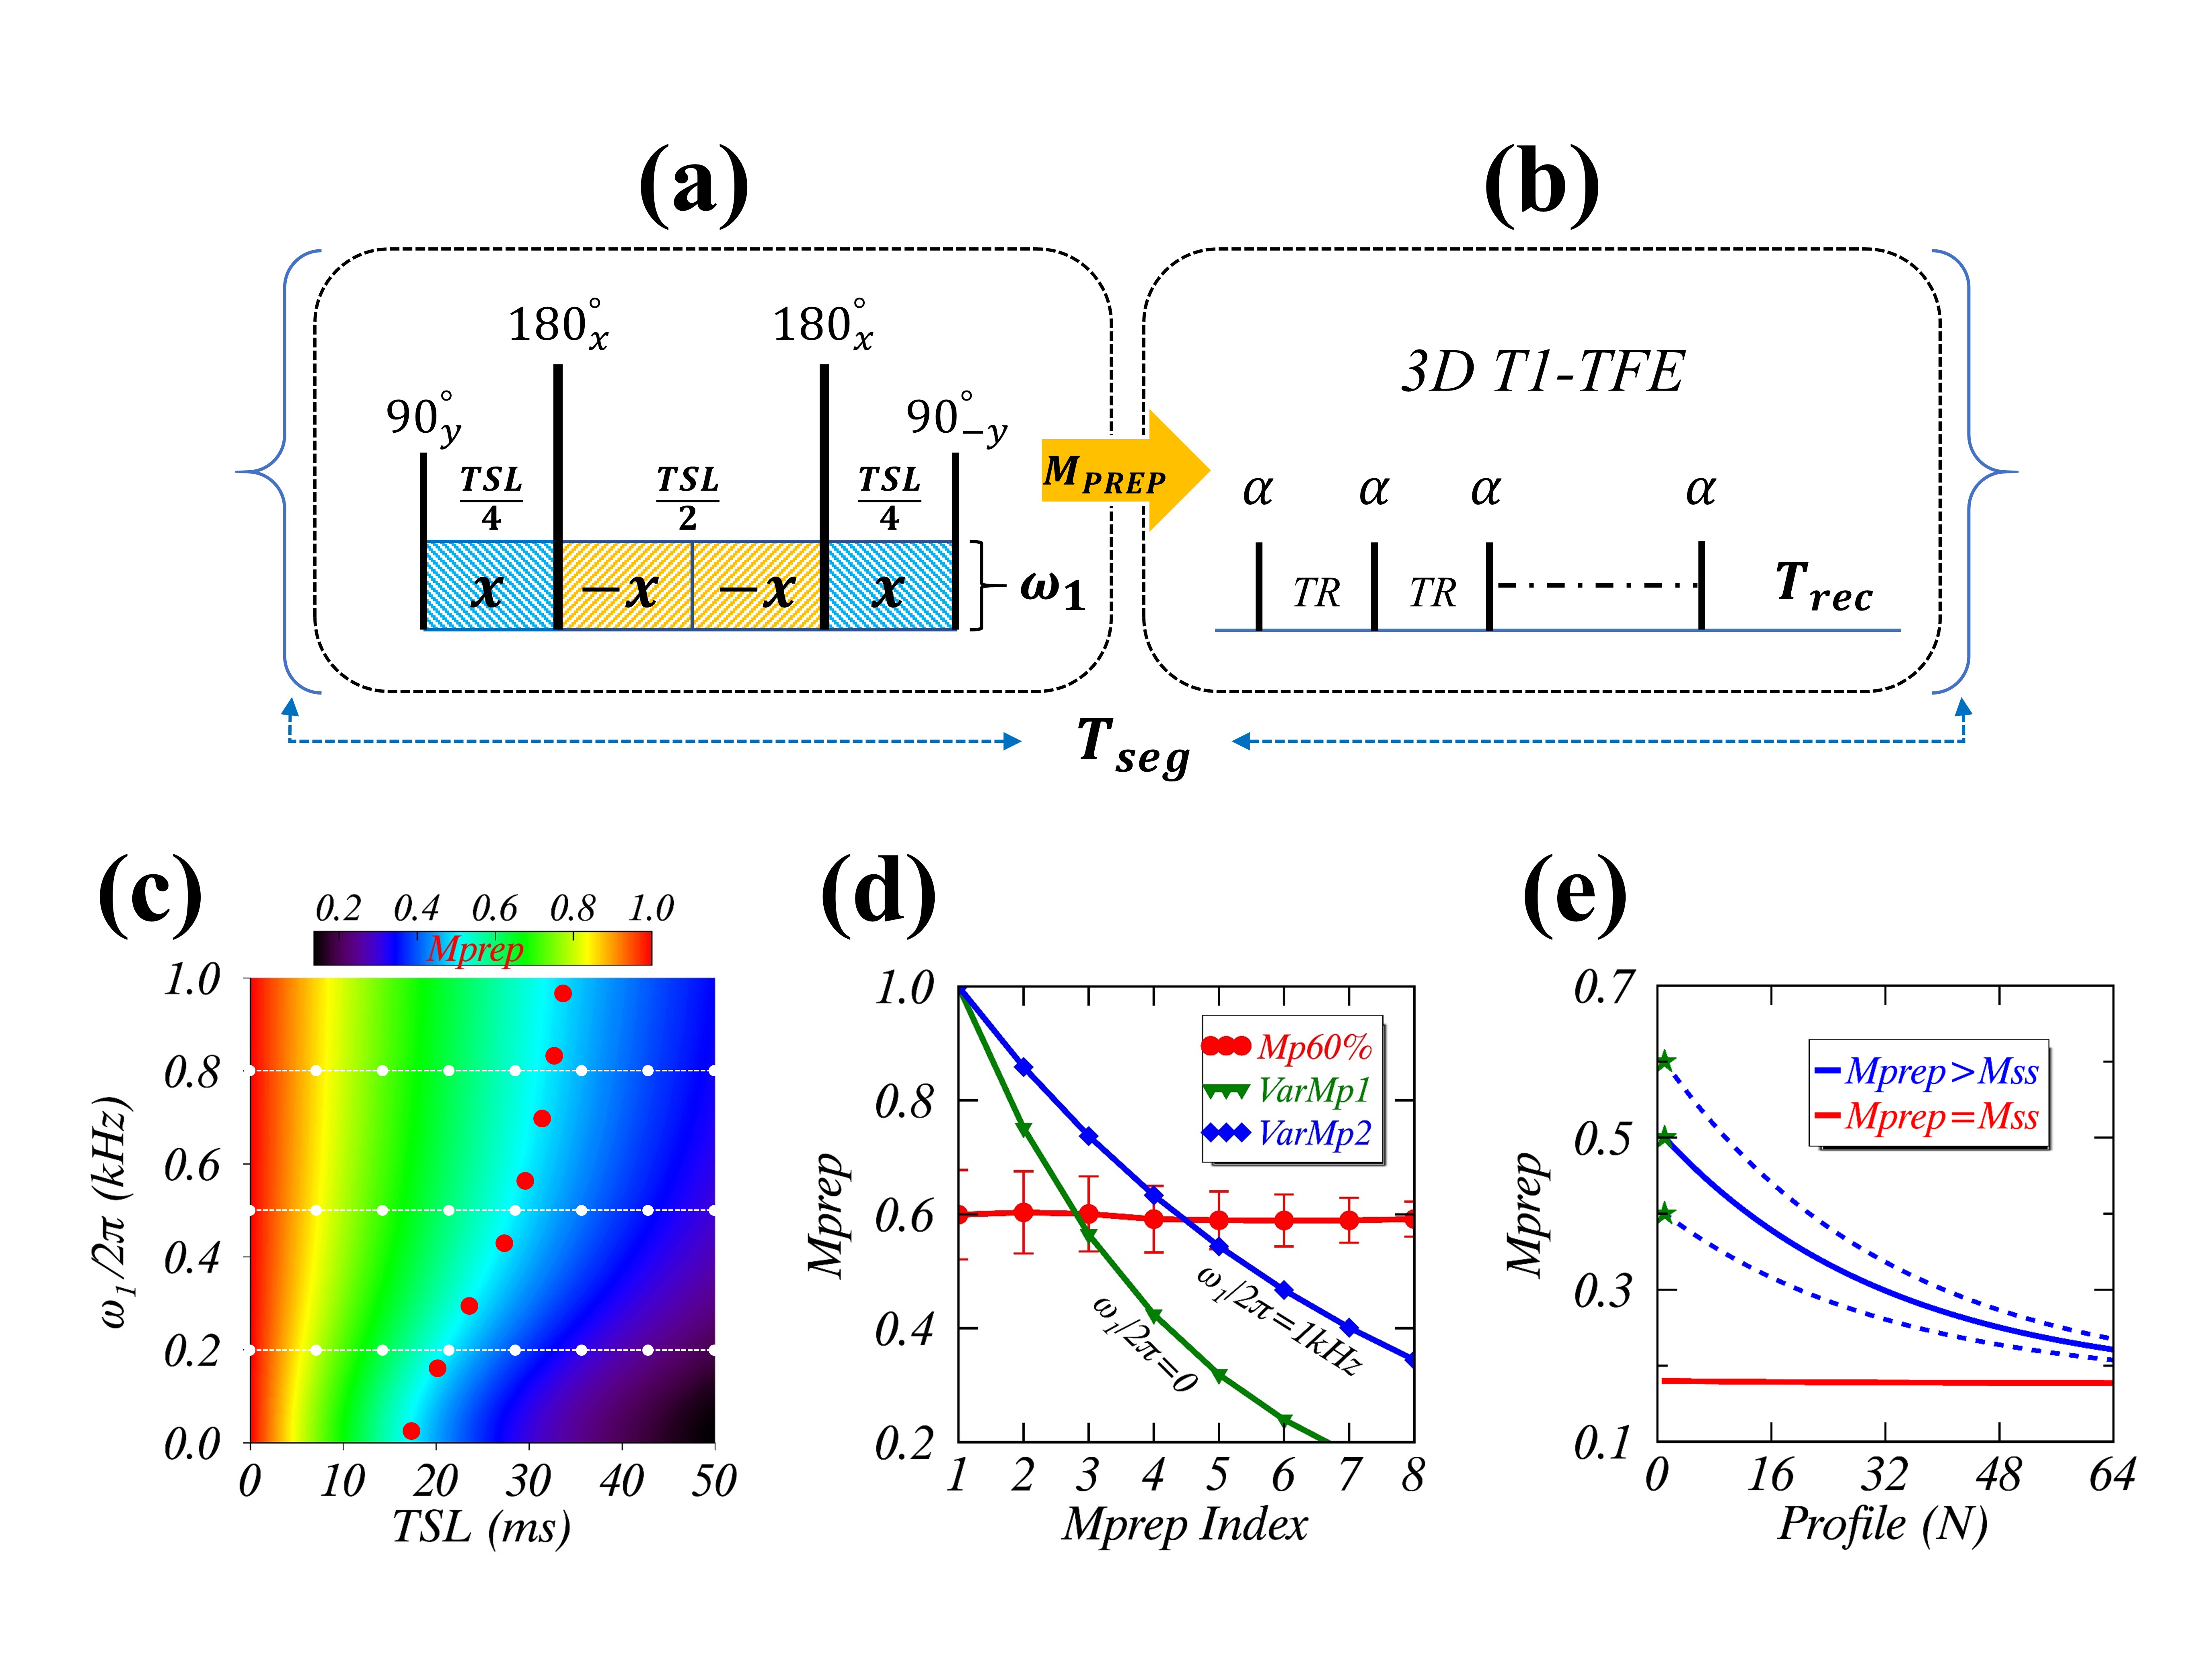
FIGURE 1. The proposed $$$R_{1\rho}$$$ dispersion imaging method including a new SL scheme (a) for turbo-FLASH (b), and a prepared constant $$$M_{prep}$$$ (red dots), with respect to the varying ones (white dots) in the standard acquisition approach (c). The $$$M_{prep}$$$ dynamic range differs significantly between from the proposed (red) and from the standard (green and blue) methods (d), whereas a cluster (blue lines) of $$$M_{prep}$$$ evolve similarly toward steady-state $$$M_{SS}$$$ (red line) during FLASH imaging readout (e).