2972
OPTIMIZATION OF KNEE CARTILAGE TEXTURE ANALYSIS FROM QUANTITATIVE MRI T2 MAPS1High Field MR Centre, Department of Biomedical Imaging and Image-Guided Therapy, Medical University of Vienna, Vienna, Austria
Synopsis
Texture analysis is currently being explored as an tool for evaluation of collagen specific T2 mapping in magnetic resonance imaging in osteoarthritis (OA) research. We assessed the effect of GLCM calculation offset and number of parameters used for T2 mapping of OA lesion and healthy cartilage on GLCM features. Significant differences in autocorrelation, contrast and homogeneity between lesion and reference when using combination of different offsets (0° and 90°) and 2- and 3-parameter T2 mapping were found. Considering architecture of healthy and OA cartilage and resultant T2 distribution, autocorrelation, contrast and homogeneity might be reliable indicators of cartilage damage.
Purpose
In recent years, gray-level co-occurrence matrix (GLCM) texture analysis is drawing more and more attention as it provides add-on evaluation of collagen specific T2 mapping. However, this approach raises some questions concerning clinical interpretation of GLCM features, which can be potentially used as non-invasive biomarkers of degenerative and regenerative processes1. Objective of our study was to compare the GLCM features of knee cartilage lesions treated with ACI (NOVOCART® Inject, TETEC AG, Reutlingen, Germany) at 12 months after surgery and healthy reference regions.Methods
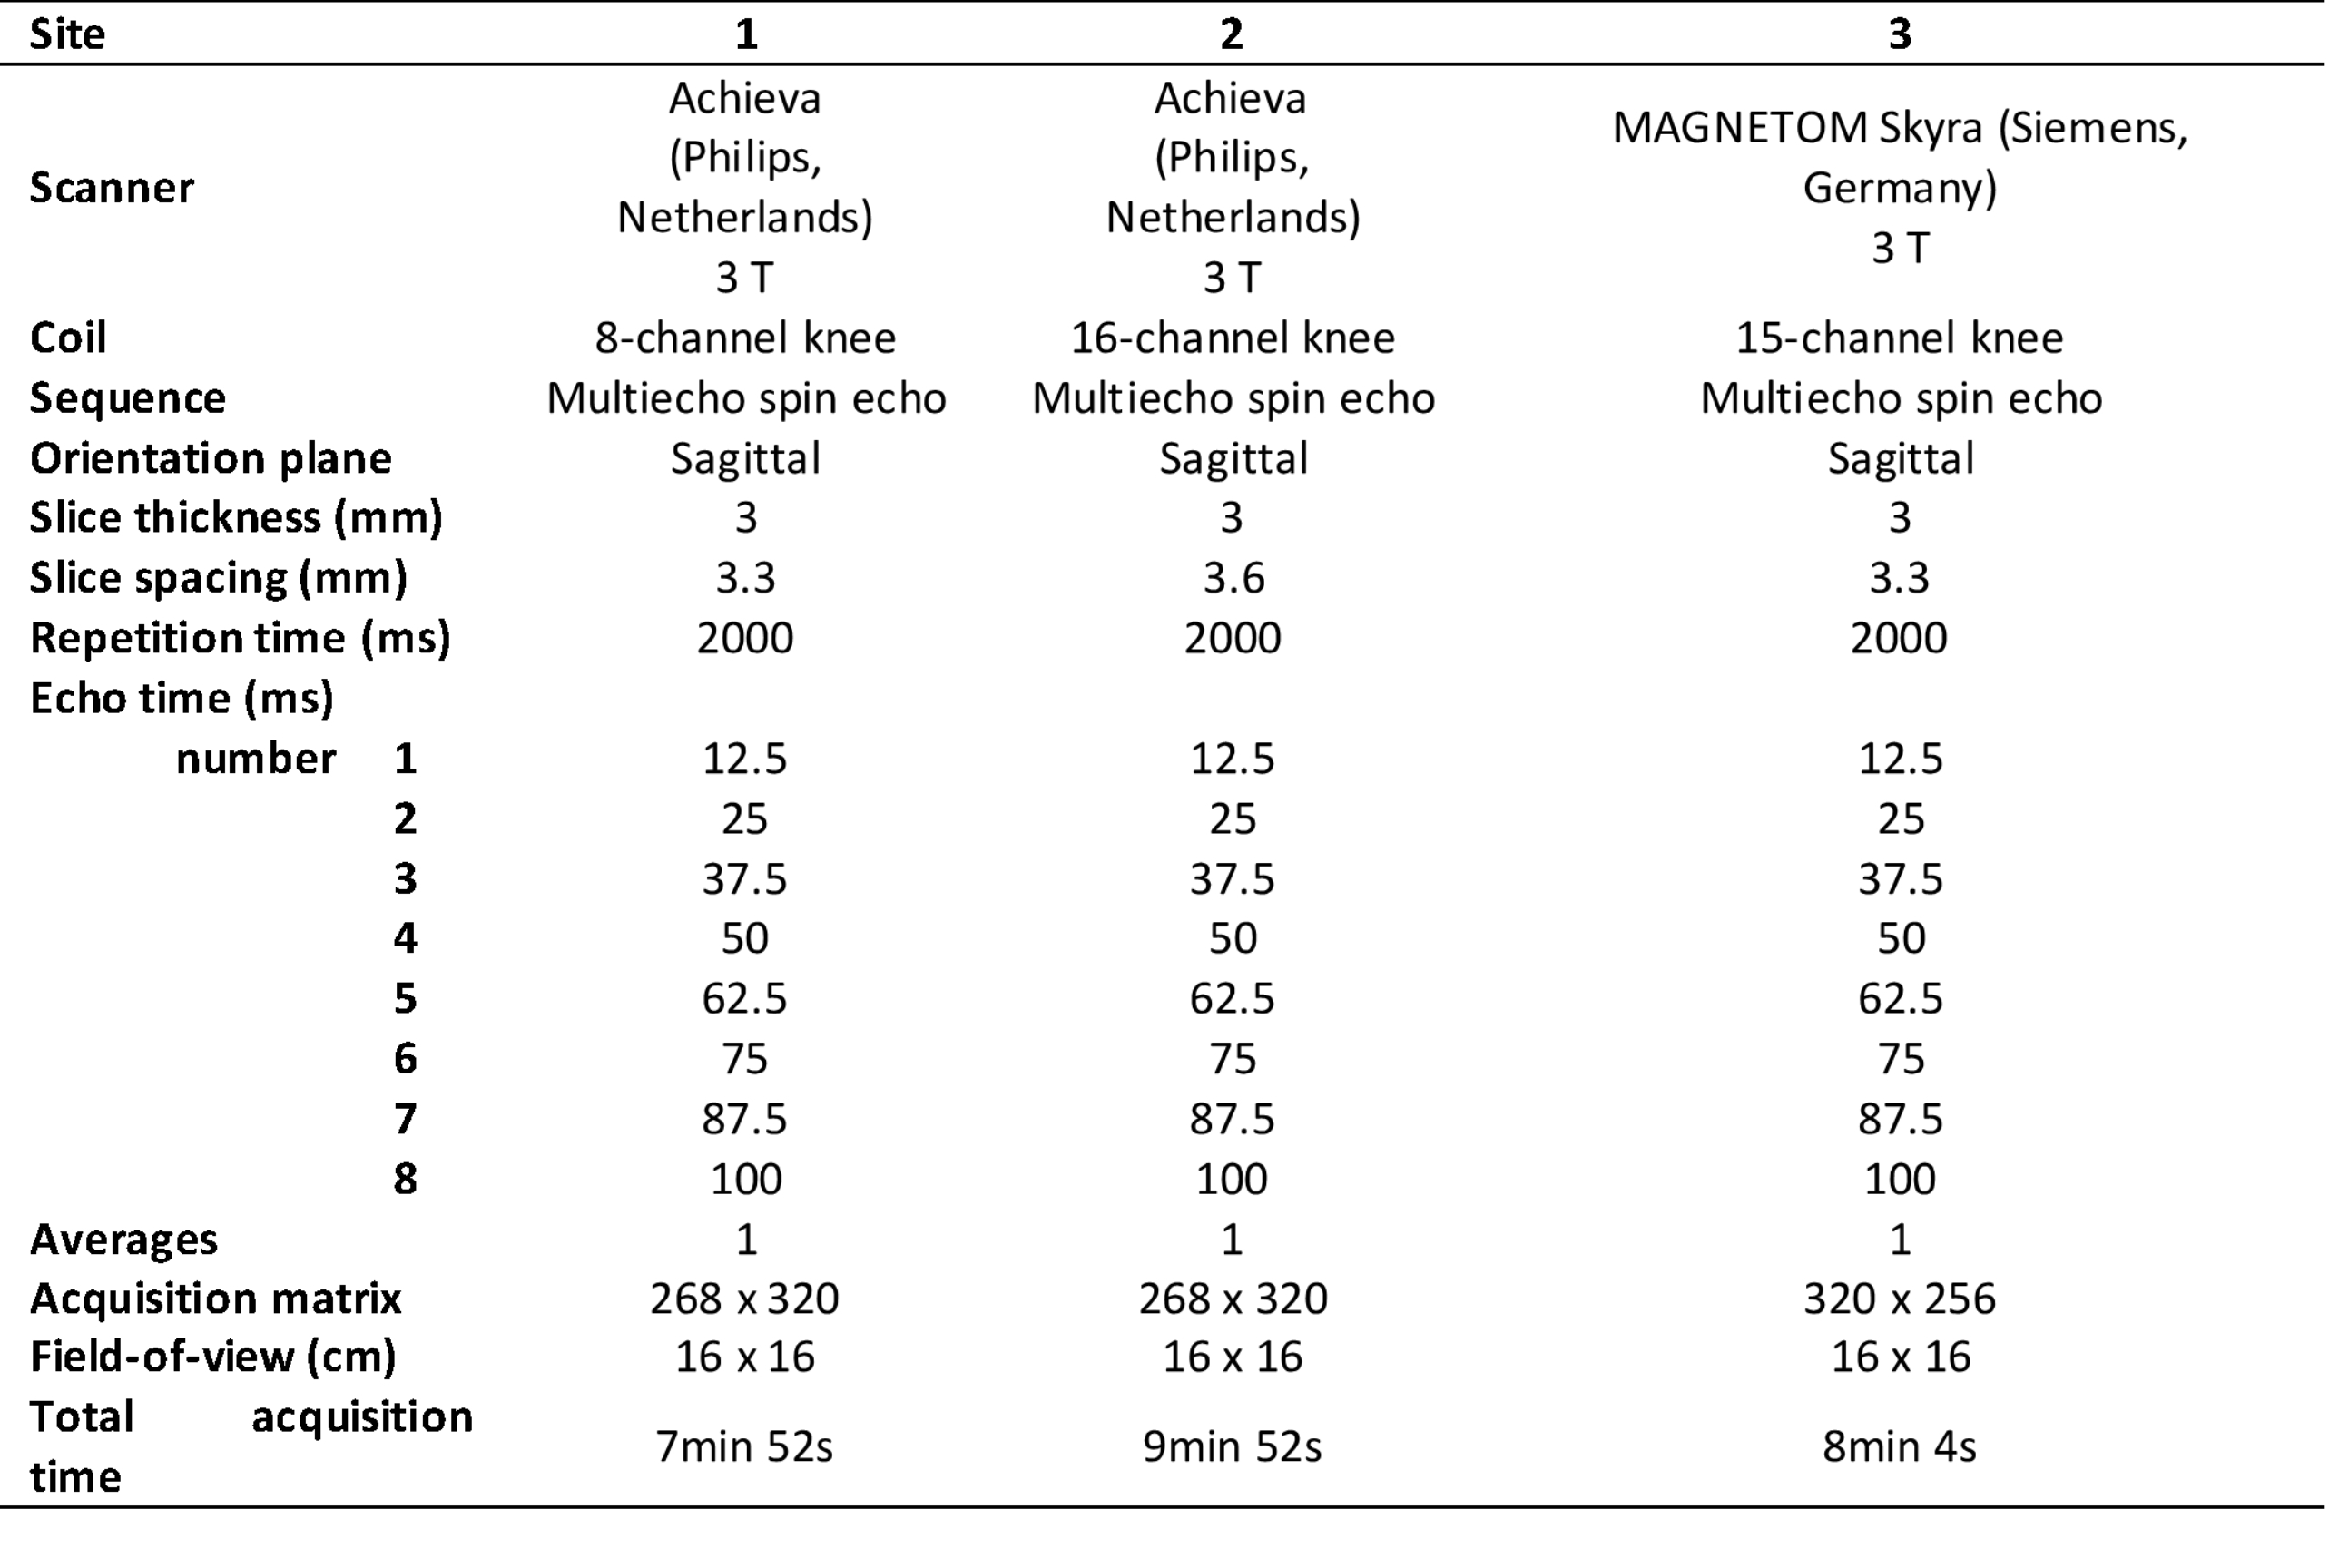
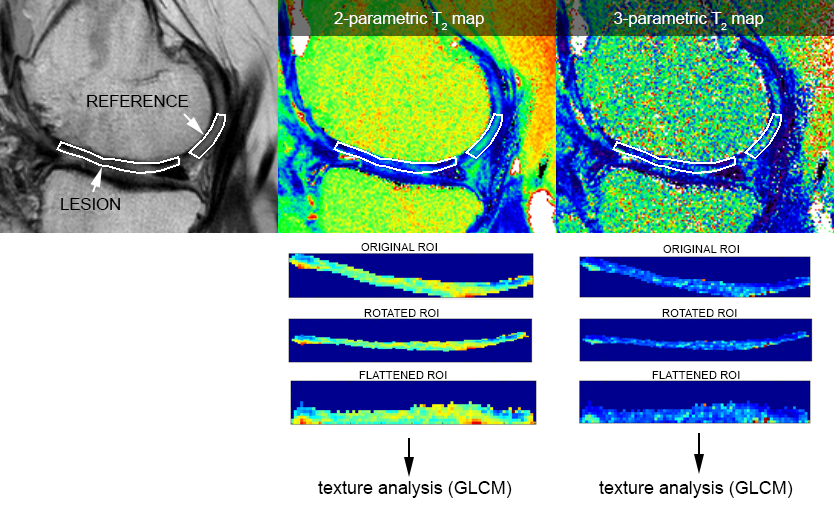
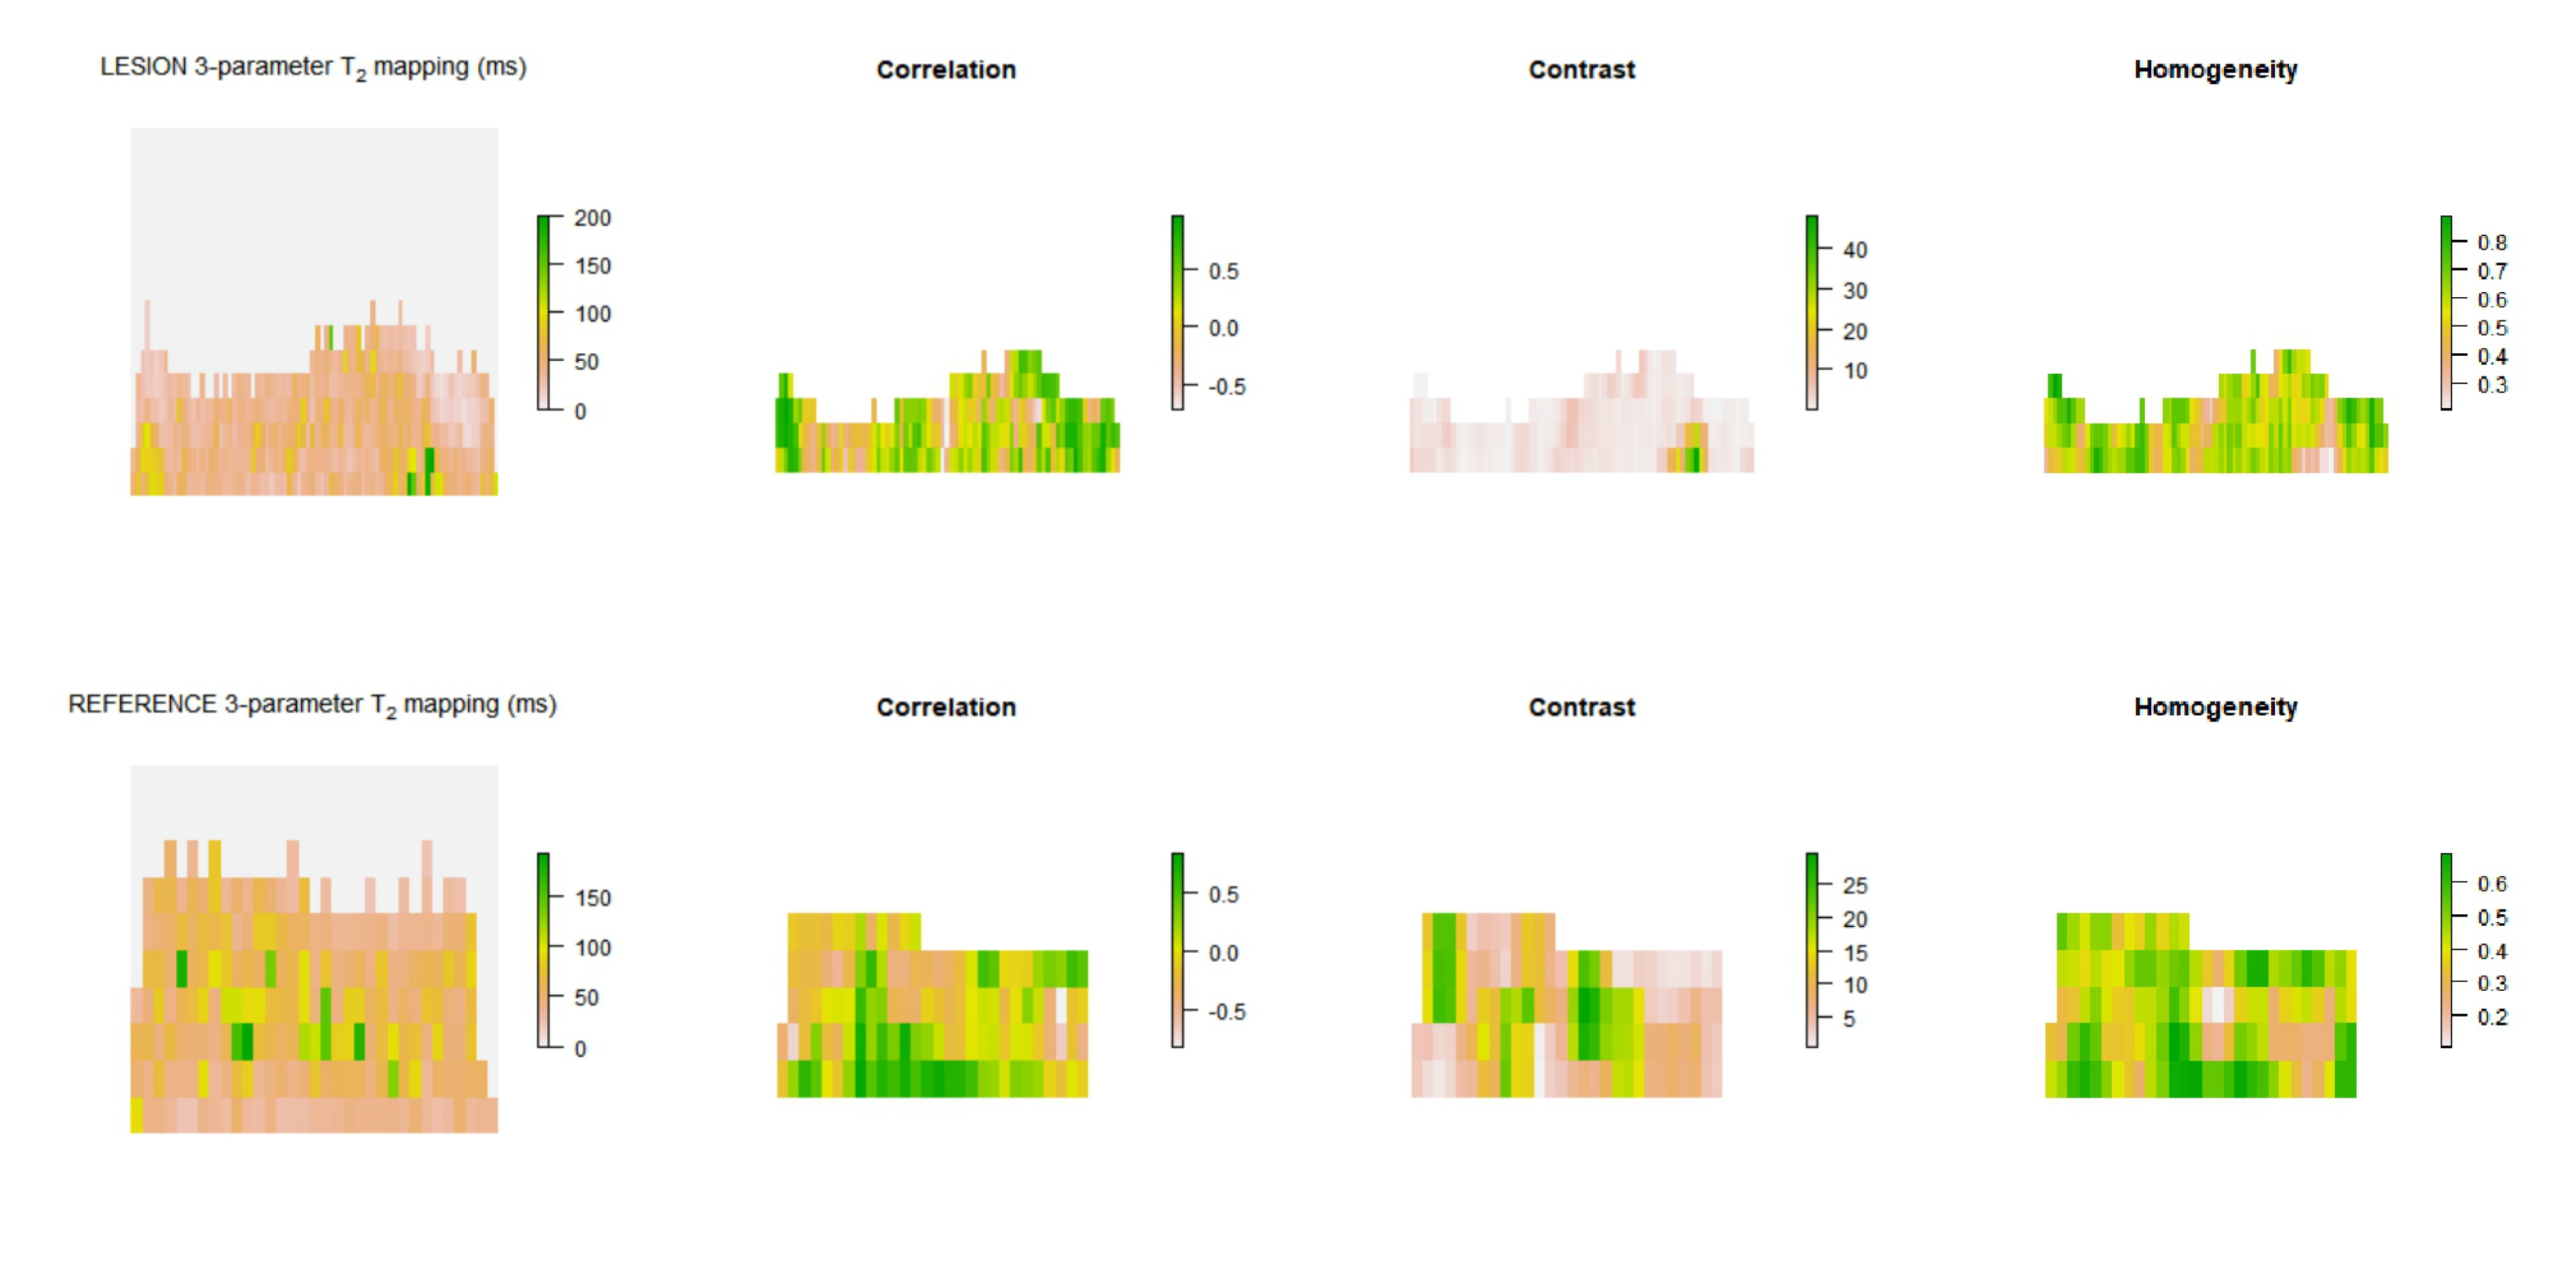
This study was approved by the appropriate ethics committees and regulatory authorities. Twenty-five patients underwent a knee MR examination in a multi-center study (with 3 radiology sites). MRI scanner, coil and T2 mapping sequence information is listed in Table 1. T2 mapping was performed using mono-exponential decay fitting with 2-parameters (M0: ‚zero magnetization‘ and T2: ‚transversal relaxation constant‘) and with 3-parametes (including ‘offset’, i.e. noise estimation).Regions-of-interest (ROI) were defined by an experienced radiologist on two or three consecutive slices on morphological images using JiveX (Visus, Bochum, Germany) based on pathophysiological appearance of cartilage and subchondral bone. The ROIs were then transferred onto T2 maps using the script written in MatLab. In each subject, two locations were selected: 1) cartilage lesion; 2) healthy reference cartilage. Inclusion criterion for GLCM analysis was the size of ROI greater than 15 pixels, therefore only 20 lesions and their corresponding references were analyzed. ROIs were rotated and flattened (Figure 1) and GLCM analysis was computed with two offsets: 0° (parallel to cartilage surface) and 90° (perpendicular to cartialge surface). Selected GLCM features were: 1) autocorrelation; 2) correlation (in visualization); 3) contrast; 4) homogeneity. GLCM analysis was performed using custom written script in MatLab environment. Mean T2 time was calculated for each ROI. Wilcoxon signed-rank test was used to determine differences in mean T2 time and GLCM features values between chondral lesion and reference cartilage and in GLCM features values, when different offsets and number of T2 mapping parameters were used, using Rstudio version 1.3.1093 (Rstudio, PBC, USA). We present results as mean value ± standard deviation and/or p-value.
Results
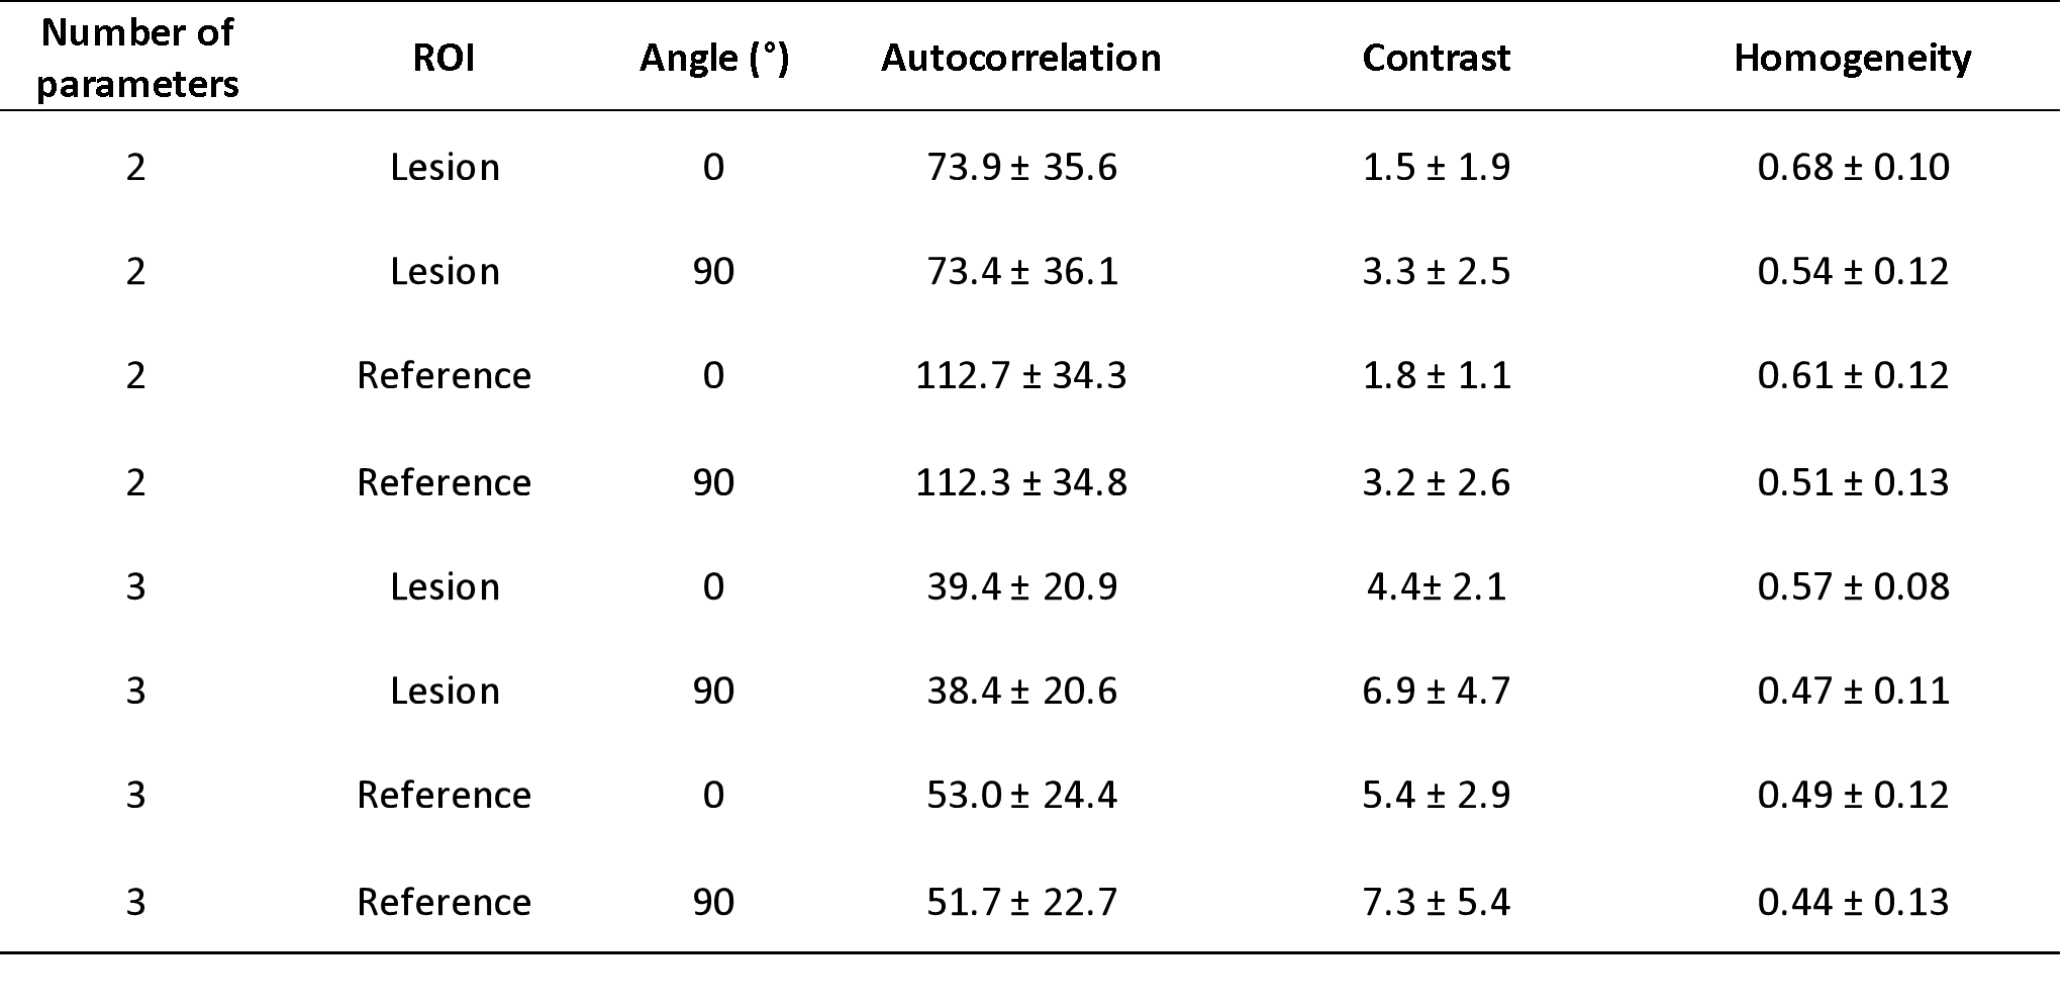
Mean T2 times were 56.7 ± 8.8, 52.9 ± 8.6, 64.3 ± 14.3 and 62.6 ± 17.8 ms in lesion and reference 2-parameter mapping and lesion and reference 3-parameter mapping respectively. There was statistically significant difference between lesion and reference mean T2 times in 2-parameter mapping (p = 0.03). This difference was not significant in 3-parameter mapping (p > 0.05).Difference in autocorrelation was significant for 2-parameter mapping and GLCM offset 0° (p < 0.001) and 90° (p < 0.001) and also for 3-parameter mapping with offset 0° (p < 0.001) and 90° (p < 0.001). Difference in contrast was only significant with offset 0° for both 2-parameter (p = 0.02) and 3-parameter mapping (p = 0.03). Homogeneity was significant with offset 0° for 2-parameter (p ≪ 0.05) and 3-parameter mapping (p < 0.001).
Contrast was significantly different when using different offsets (0° and 90°) for both 2-parameter (p < 0.001) and 3-parameter (p < 0.001) mapping of lesion and for 2-parameter (p < 0.001) and 3-parameter (p ≪ 0.05) mapping of reference. There was also significant difference in homogeneity for 2-parameter (p < 0.001) and 3-parameter (p < 0.001) mapping of lesion and also for 2-parameter (p < 0.001) and 3-parameter (p ≪ 0.05) mapping of reference. Autocorrelation was not significantly different using different offsets.
Autocorrelation, contrast and homogeneity were significantly different for lesion and reference texture analysis with both offsets (0° and 90°) when comparing 2- and 3-parameter mapping. All p-values were < 0.001.
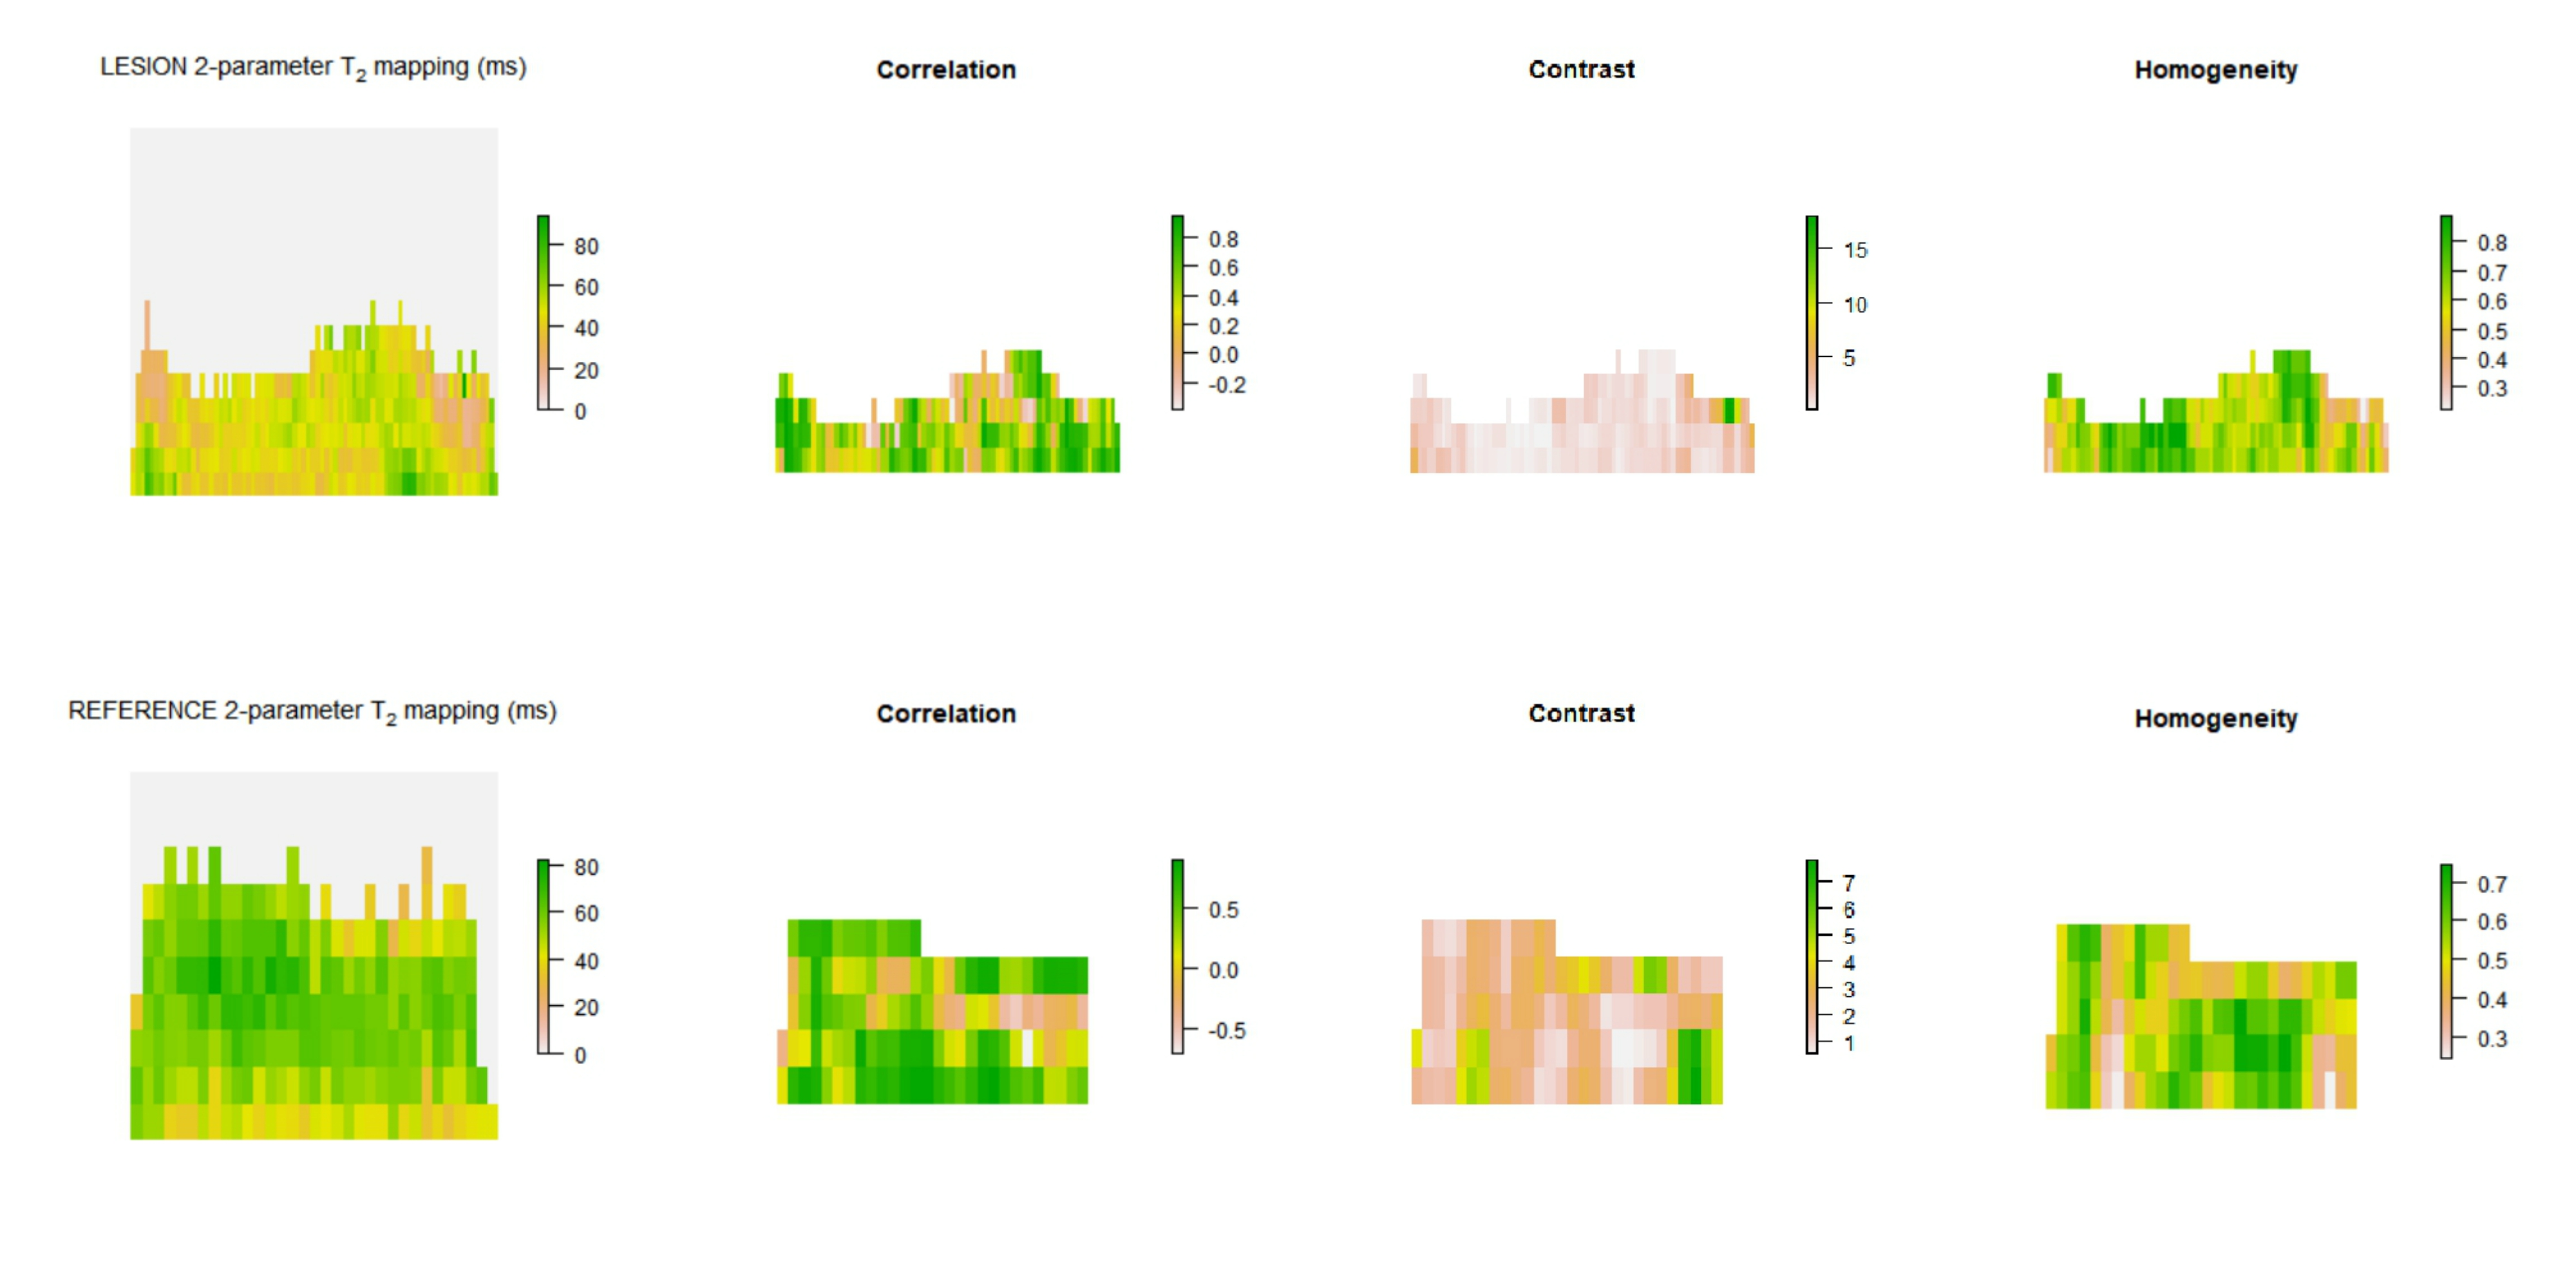
In Figure 2 and Figure 3 we present visualization of GLCM features calculated with offset 0°.
Conclusions
Although significant difference in mean T2 in 3-parameter mapping was not shown, different T2 distribution in lesion and reference cartilage is visible in Figure 2 and Figure 3. Autocorrelation, contrast and homogeneity might serve as OA indicators, considering loss of zonal cartilage architecture and resultant T2 distribution2. Autocorrelation represents the extent of pattern repetition3. As our data suggest, we expect higher autocorrelation in healthy cartilage. Correlation provides a measure similar to autocorrelation3. Contrast represents local gray level variation and high values suggest presence of edges, which is typical for healthy cartilage3,4. Homogeneity measures the smoothness of gray level distribution and might serve as a tool for zonal architecture loss detection3,4. Because texture of healthy cartilage is smooth (homogeneous) in horizontal direction when ROI is rotated and flattened5, offset 0° has been proven to be a key parameter in distinguishing lesion and reference, with contrast and homogeneity being significantly different only in this direction. Number of T2 mapping parameters has an effect on absolute values of mean T2 times, but this difference does not affect the significance of difference in parameters values between lesion and reference. GLCM texture analysis seems to be an useful additional tool to T2 mapping of articular cartilage lesions and could potentially serve as a robust marker for monitoring patients in interventional studies. However, interpretation of GLCM parameters should be based on structure of analyzed tissue.Acknowledgements
No acknowledgement found.References
1. Baum T, Joseph GB, Karampinos DC, Jungmann PM, Link TM, Bauer JS. Cartilage and meniscal T2 relaxation time as non-invasive biomarker for knee osteoarthritis and cartilage repair procedures. Osteoarthritis Cartilage. 2013;21(10):1474-1484. doi:10.1016/j.joca.2013.07.012
2. Carballido-Gamio J, Stahl R, Blumenkrantz G, Romero A, Majumdar S, Link TM. Spatial analysis of magnetic resonance T1rho and T2 relaxation times improves classification between subjects with and without osteoarthritis. Med Phys. 2009;36(9):4059-4067. doi:10.1118/1.3187228
3. Haralick, Robert & Shanmugam, K. & Dinstein, Ih. (1973). Textural Features for Image Classification. IEEE Trans Syst Man Cybern. SMC-3. 610-621.
4. Sophia Fox AJ, Bedi A, Rodeo SA. The basic science of articular cartilage: structure, composition, and function. Sports Health. 2009;1(6):461-468. doi:10.1177/1941738109350438.
5. Carballido-Gamio J, Link TM, Majumdar S. New techniques for cartilage magnetic resonance imaging relaxation time analysis: texture analysis of flattened cartilage and localized intra- and inter-subject comparisons. Magn Reson Med. 2008;59(6):1472-1477. doi:10.1002/mrm.21553
Figures