2971
GagCEST Imaging of Healthy and OA Patients at 7 Tesla1Radiology, University of Pennsylvania, Philadelphia, PA, United States, 2Siemens Medical Solutions USA Inc, Malvern, PA, United States, 3Penn Medicine, Rheumatology, Philadelphia Veterans’ Affairs Medical Center, Philadelphia, PA, United States
Synopsis
Imaging of knee cartilage is of enormous significance, particularly for patients with osteoarthritis (OA). In this work, we applied Glycosaminoglycans-weighted Chemical Exchange Saturation Transfer (GagCEST) magnetic resonance imaging (MRI) at 7 Telsa (7T) to OA and healthy patients. GagCEST MRI revealed an increase in GagCEST (%) values for control patients in comparison to OA patients and can serve as a sensitive molecular biomarker for quantifying early metabolic changes in cartilage.
Introduction
Osteoarthritis (OA) is among the most prevalent irreversible musculoskeletal diseases that is characterized by the degradation of cartilage or bone within synovial joints [1]. Glycosaminoglycans (Gag) are an essential building block of cartilage and contains hydroxyl moieties. Magnetic resonance spectroscopy (MRS) and chemical exchange saturation transfer (CEST) help to visualize the rate of exchange of Gag’s labile hydroxyl protons with bulk water. GagCEST is then used to determine the percentage of Gag present in a given ROI, namely of the articular knee cartilage. In this study, the OA and control patients were compared to show a relationship between the concentration of GagCEST to articular knee cartilage volume. A positive linear trend shows that higher GagCEST percentage is found in patients with larger cartilage volume.Methods
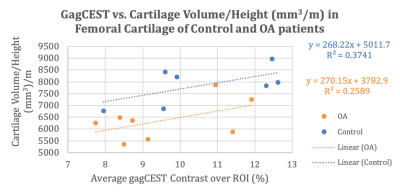
All patients were scanned under an approved Institutional Review Board protocol of the University of Pennsylvania with written informed consent obtained from each volunteer after explaining the study protocol. MRI scans were performed on 15 male subjects from 56 - 72 years old. Out of the 15 subjects, 8 subjects had OA and 7 subjects were healthy/control. All MR imaging studies were performed in a Siemens 7T whole body MRI scanner (MAGNETOM Terra, Siemens Healthcare, Erlangen, Germany) run in investigational mode using a circularly polarized (CP) transmit / 28-channel receive array knee coil (inner diameter = 15.4 cm to 18 cm, Quality Electrodynamics, Mayfield Village, OH). A custom sequence and calculations for CEST, B0 Map, and B1 Map in this experiment were used as described in Krishnamoorthy et al., 2016. For CEST, a train of five Hanning windowed pulses with a duration of 99.8ms separated by 0.2ms and a B1rms of 2.2 μT were used [2]. Water saturation shift referencing (WASSR) was used to generate the B0 correction by using a frequency-selective saturation pulse of two Hanning windowed saturation pulses and B1rms of 0.3μT [2]. The B1 map was generated by using two flip angles of 30° and 60°. The image is acquired by performing two preparation pulses with a 8000ms TR between the two pulses, the segment TR is between 6-8ms [2]. All image processing and data analysis were performed using in-house MATLAB (Mathworks, version R2017a). GagCEST values were computed from voxel-wise segmentation ROIs. Articular knee cartilage segmentation and volume calculation was performed using a free imaging analysis program, pyKNEEr (python knee reproducibility) [3]. These segmentations were then further analyzed and manually segmented to ensure accurate segmentation. To account for each patient’s knee cartilage volume relative to their height, each patient’s cartilage volume was divided by their height which creates a unit of (mm3/m).Results
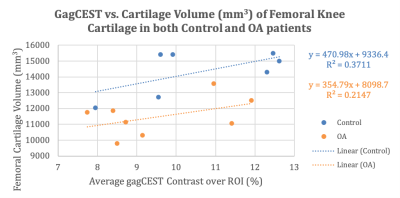
The control and OA patients both have correlative data between the GagCEST and femoral cartilage values. Figure 1 shows a positive linear relationship for all patients between the GagCEST (%) values and volumes for all patients. Figure 2 shows that control subjects have higher GagCEST values and femoral cartilage volumes with a stronger trendline compared to the OA patients. Figure 3 illustrates that the relationship for control subjects is still stronger adjusting for the patients’ respective height.Discussion & Conclusion
In this work, it is shown that compared to OA patients, healthy subjects have a higher concentration of GagCEST in their articular cartilage and have higher cartilage volumes. In this study, all the OA patients scanned had relatively advanced OA and as a result are accompanied with the varying degree of loss of cartilage volume. However, as shown previously, early metabolic changes in OA cartilage begin with the loss of Gag without any measurable changes in cartilage [4]. Continued progressive loss of Gag eventually leads to cartilage volume loss. Therefore, GagCEST MRI can serve as a sensitive molecular biomarker for quantifying early metabolic changes in cartilage and may help evaluate the efficacy of potential disease modifying therapies to halt the cartilage degeneration.Acknowledgements
Research reported in this publication was supported by the National Institute of Biomedical Imaging and Bioengineering of the National Institutes of Health under award Number P41EB015893. Research reported in this publication was supported by the National Institute of Biomedical Imaging and Bioengineering of the National Institutes of Health under award Number T32EB020087.References
[1] Bonaretti, S., Gold, G. E., & Beaupre, G. S. (2019). PyKNEEr: An image analysis workflow for open and reproducible research on femoral knee cartilage. In bioRxiv. https://doi.org/10.1101/556423
[2] Krishnamoorthy, G., Nanga, R. P. R., Bagga, P., Hariharan, H., & Reddy, R. (2017). High quality three-dimensional gagCEST imaging of in vivo human knee cartilage at 7 Tesla. Magnetic Resonance in Medicine, 77(5). https://doi.org/10.1002/mrm.26265
[3] Schmitt, B., Zbýň, Š., Stelzeneder, D., Jellus, V., Paul, D., Lauer, L., Bachert, P., & Trattnig, S. (2011). Cartilage quality assessment by using glycosaminoglycan chemical exchange saturation transfer and 23Na MR imaging at 7 T. Radiology. https://doi.org/10.1148/radiol.11101841
[4] Woolf, A. D., & Pfleger, B. (2003). Burden of major musculoskeletal conditions. In Bulletin of the World Health Organization. https://doi.org/10.1590/S0042-96862003000900007
Figures


