2968
Automated Knee Cartilage Thickness Measurement from Magnetic Resonance Images1Department of Imaging and Interventional Radiology, The Chinese University of Hong Kong, Hong Kong, China
Synopsis
We propose an automated method to measure knee cartilage thickness from MR images. The proposed method comprises the processes including cartilage and bone segmentation, cartilage boundary separation, surface normal estimation, and uncertainty estimation in thickness measurement. Compared with the conventional nearest neighbor approach, the proposed method provides more reliable measurement at the edges and the regions with thin cartilage.
Introduction
The measurement of the morphology of knee cartilage is important in the existing MRI-based scoring system for knee osteoarthritis (OA), such as the WORMS$$$^1$$$, KOSS$$$^2$$$, BLOKS$$$^3$$$, and MOAKS$$$^4$$$. These scoring systems are semi-quantitative and time-consuming. It can take, on average, up to 30 minutes to finish the scoring of one knee.$$$^2$$$ To reduce the workload of clinician for OA scoring, and provide objective results, the development and validation of an automated and quantitative MRI-based scoring system is desirable. Cartilage thickness measurement plays an important role in constructing such scoring systems. It is challenging to use the conventional methods to automatically and accurately measure cartilage thickness along the edge or at the regions where cartilage is very thin. In this work, we propose an automated method to address this issue.Methods
The method consists of three steps: (1) segmentation of bones and cartilages from a knee MR image, (2) separation of cartilage boundary, and (3) cartilage thickness measurement.For the segmentation task, we train a convolution neural network with U-Net$$$^5$$$ backbone and morphological attentions to segment the Femur, Tibia, Femoral Cartilage, and Tibial Cartilage. After the binary masks of cartilage and bone are obtained, the cartilage boundary is separated into two parts, including the bone-cartilage interface and the outer boundary. Considering the fact that there could be small gaps between the bone and the cartilage region or within each region, removal of isolated voxels, hole-filling, and bone region growing are performed to increase the robustness of this process.
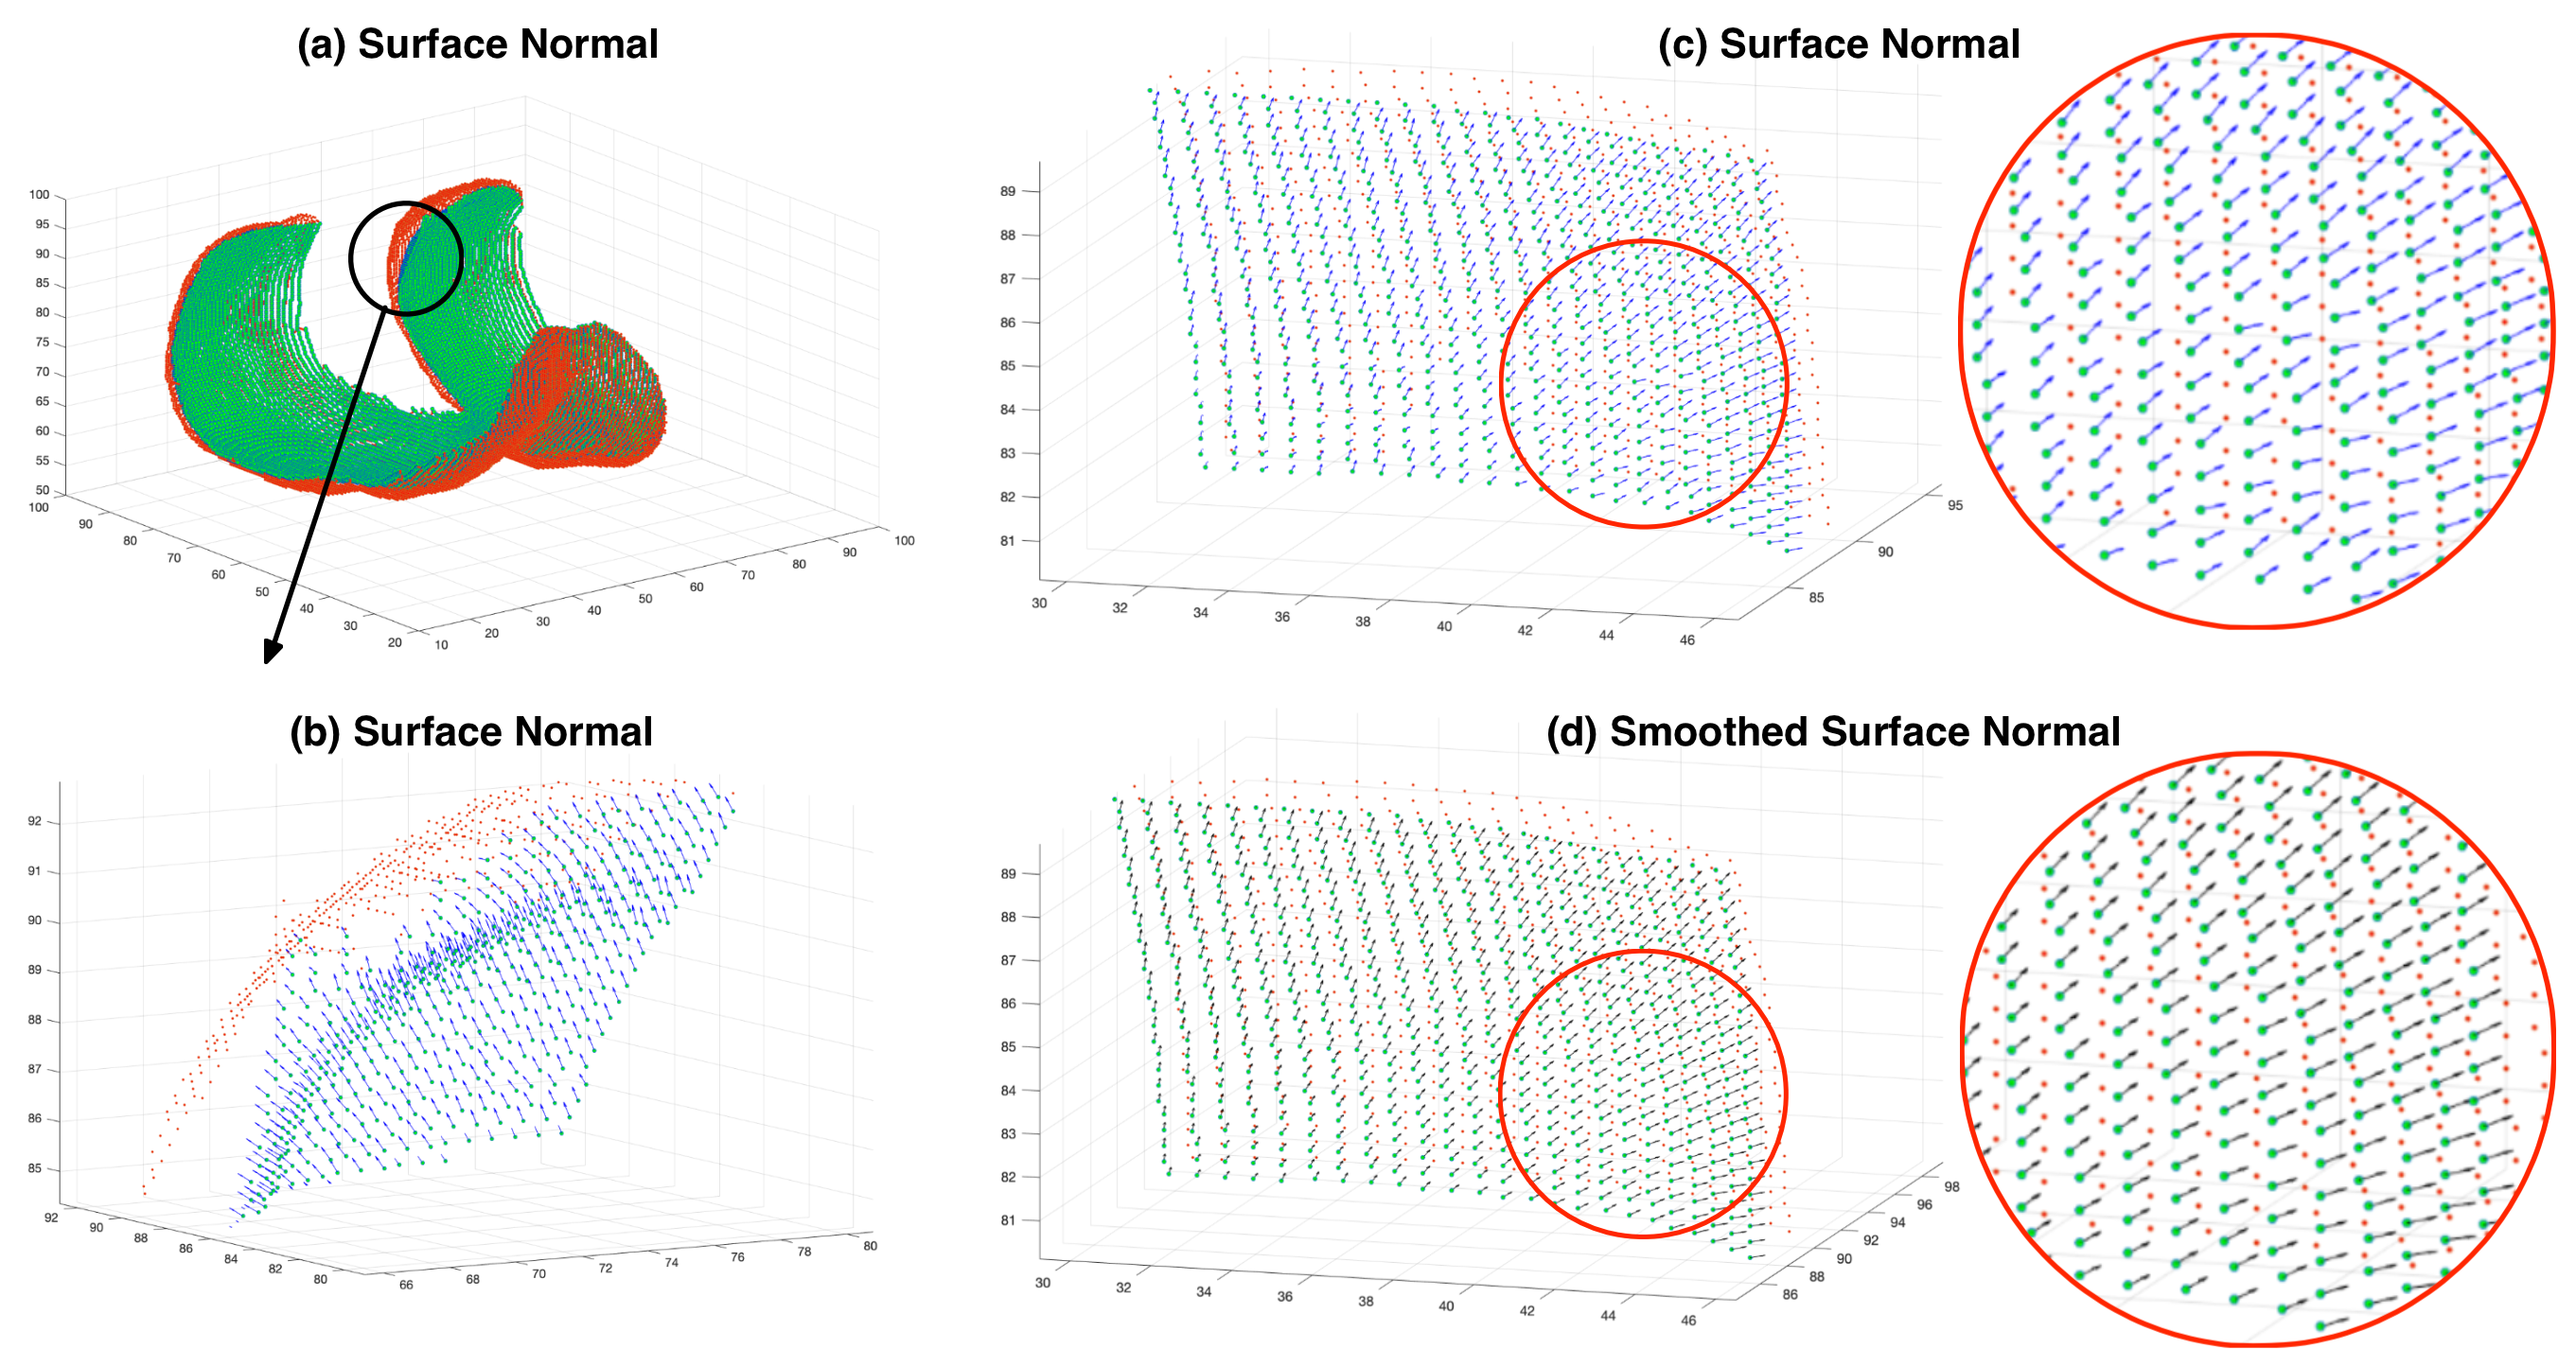
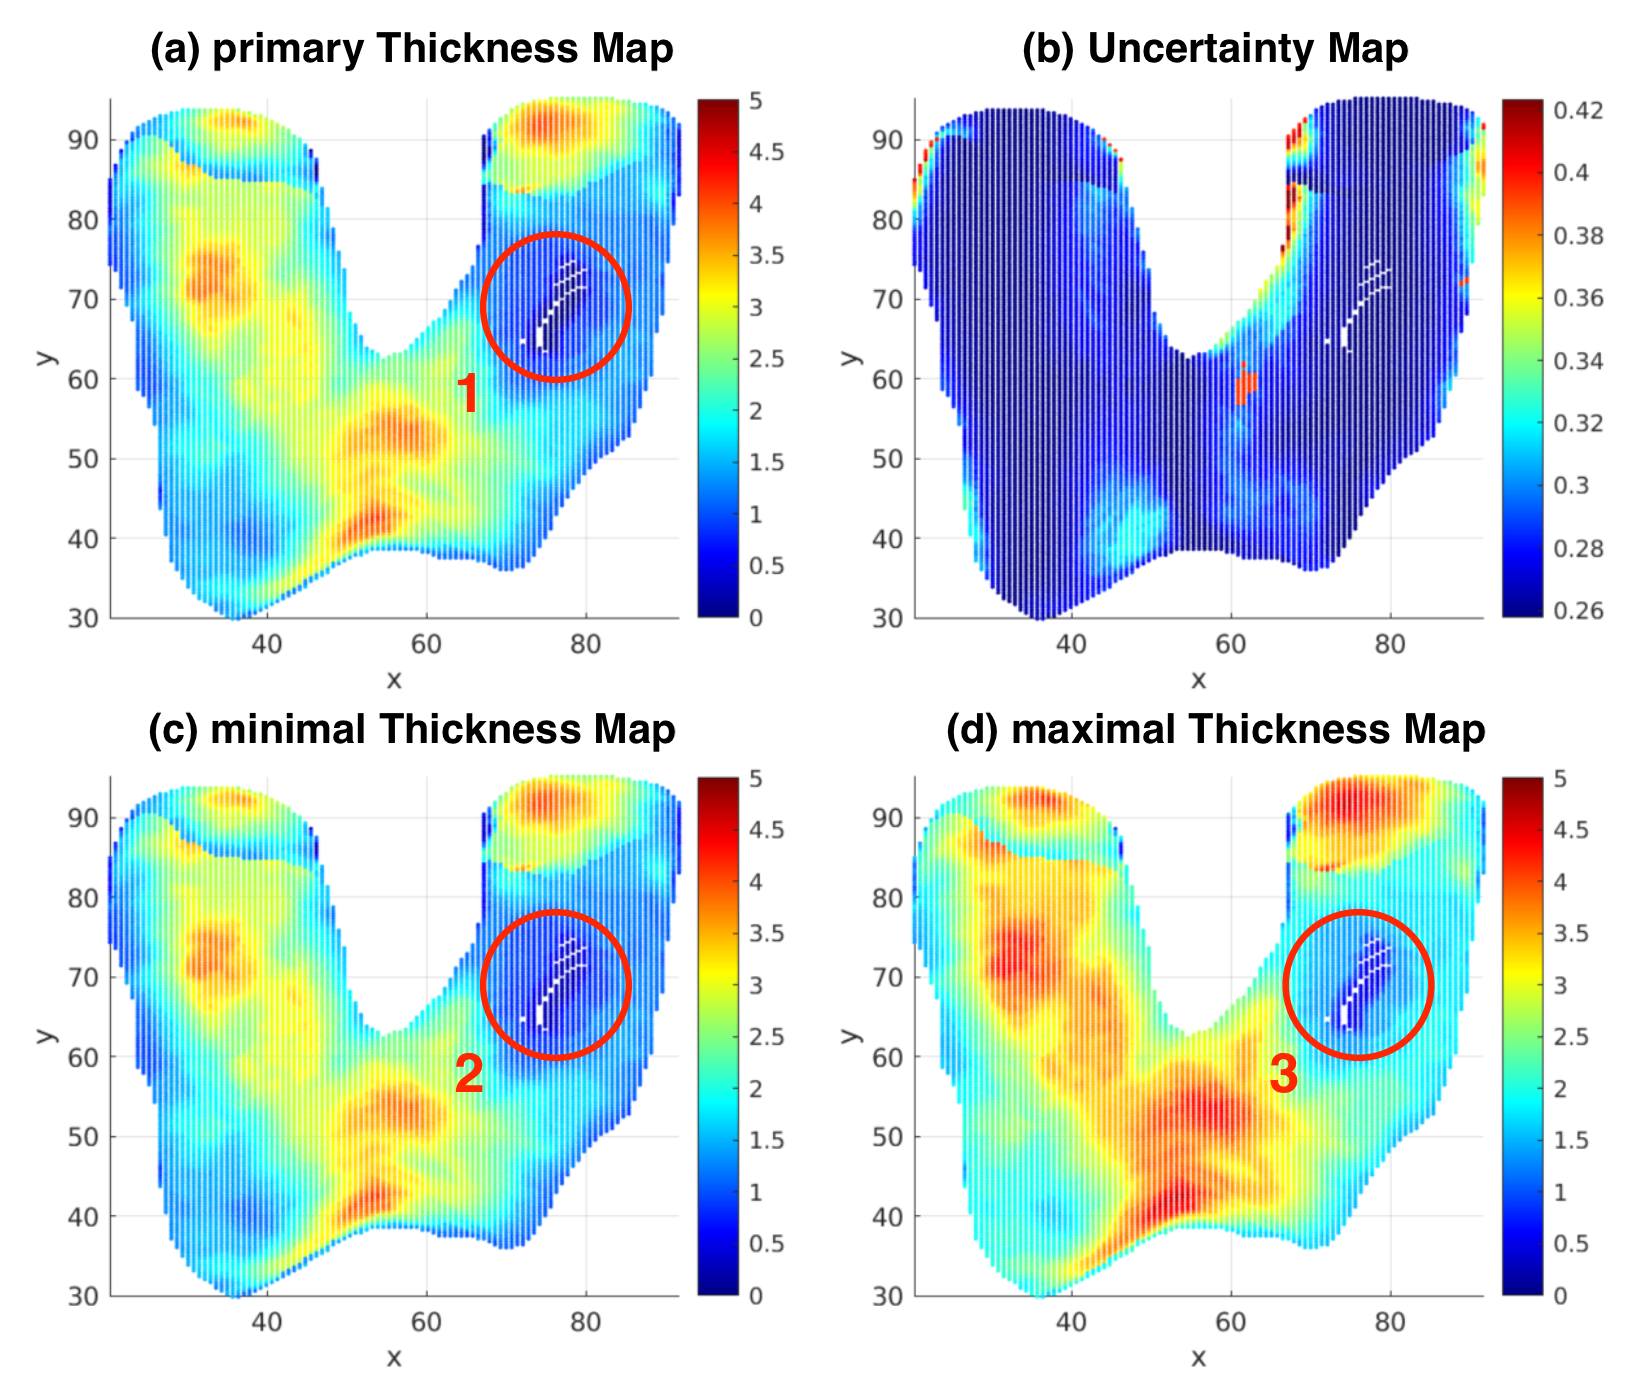
To perform reliable cartilage thickness measurement, we propose a surface normal (SN) based algorithm. Firstly, surface normals are estimated at each location of the bone-cartilage interface using singular value decomposition (SVD). For each voxel, its 8 nearest neighbors are added to form a point cloud where the SVD is applied. From SVD, the spatial component corresponding to the smallest singular value is used as the primary surface normal. Note that the primary surface normals are pointing arbitrarily inwards and outwards. An orientation-correction algorithm is developed and adopted. Secondly, the corrected surface normals are smoothed by average-smoothing of 8-neighbors. Finally, the intersection of the smoothed surface normal and the outer boundary is recognized, and the thickness is calculated as the Euclidean Distance between the intersection and the origin of normal vector. The output of this step is termed the primary thickness map.
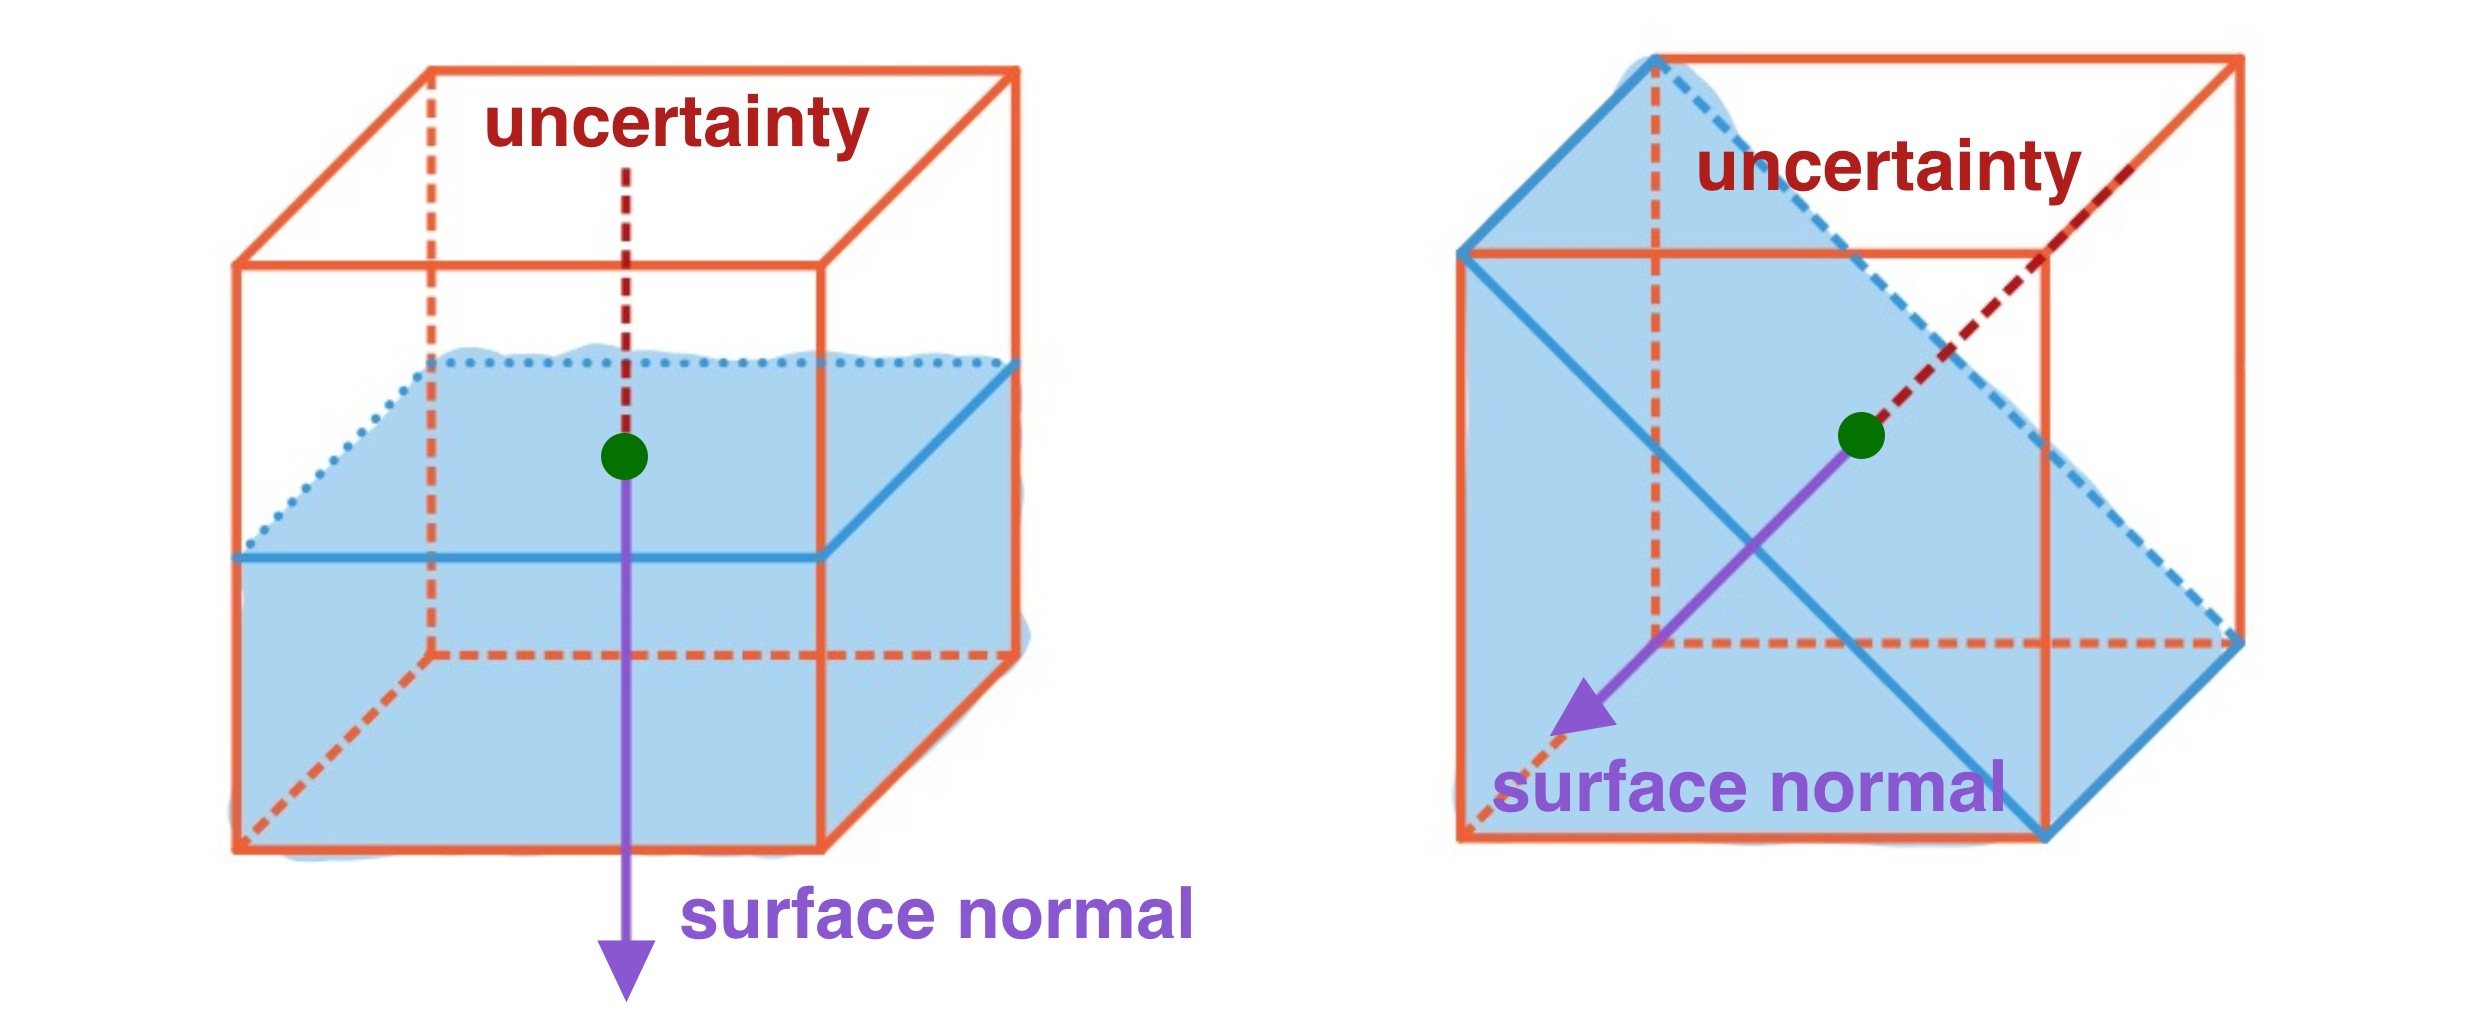
To tackle the problems of false thickness measurement at the regions with thin cartilage, the estimation of uncertainty map is proposed. For each voxel at the bone-cartilage interface, an uncertainty is estimated based on the orientation of the surface normal and the voxel size (Figure 1). The uncertainties are added to zero-thickness locations in the primary thickness map to form the minimal thickness map. The twofold uncertainties are added to all locations in the primary thickness map to form the maximal thickness map.
The proposed method are tested and validated on the public OAI-ZIB dataset$$$^6$$$. The results were compared to those obtained using the conventional 3-dimensional nearest neighbor (3dNN) approach.
Results
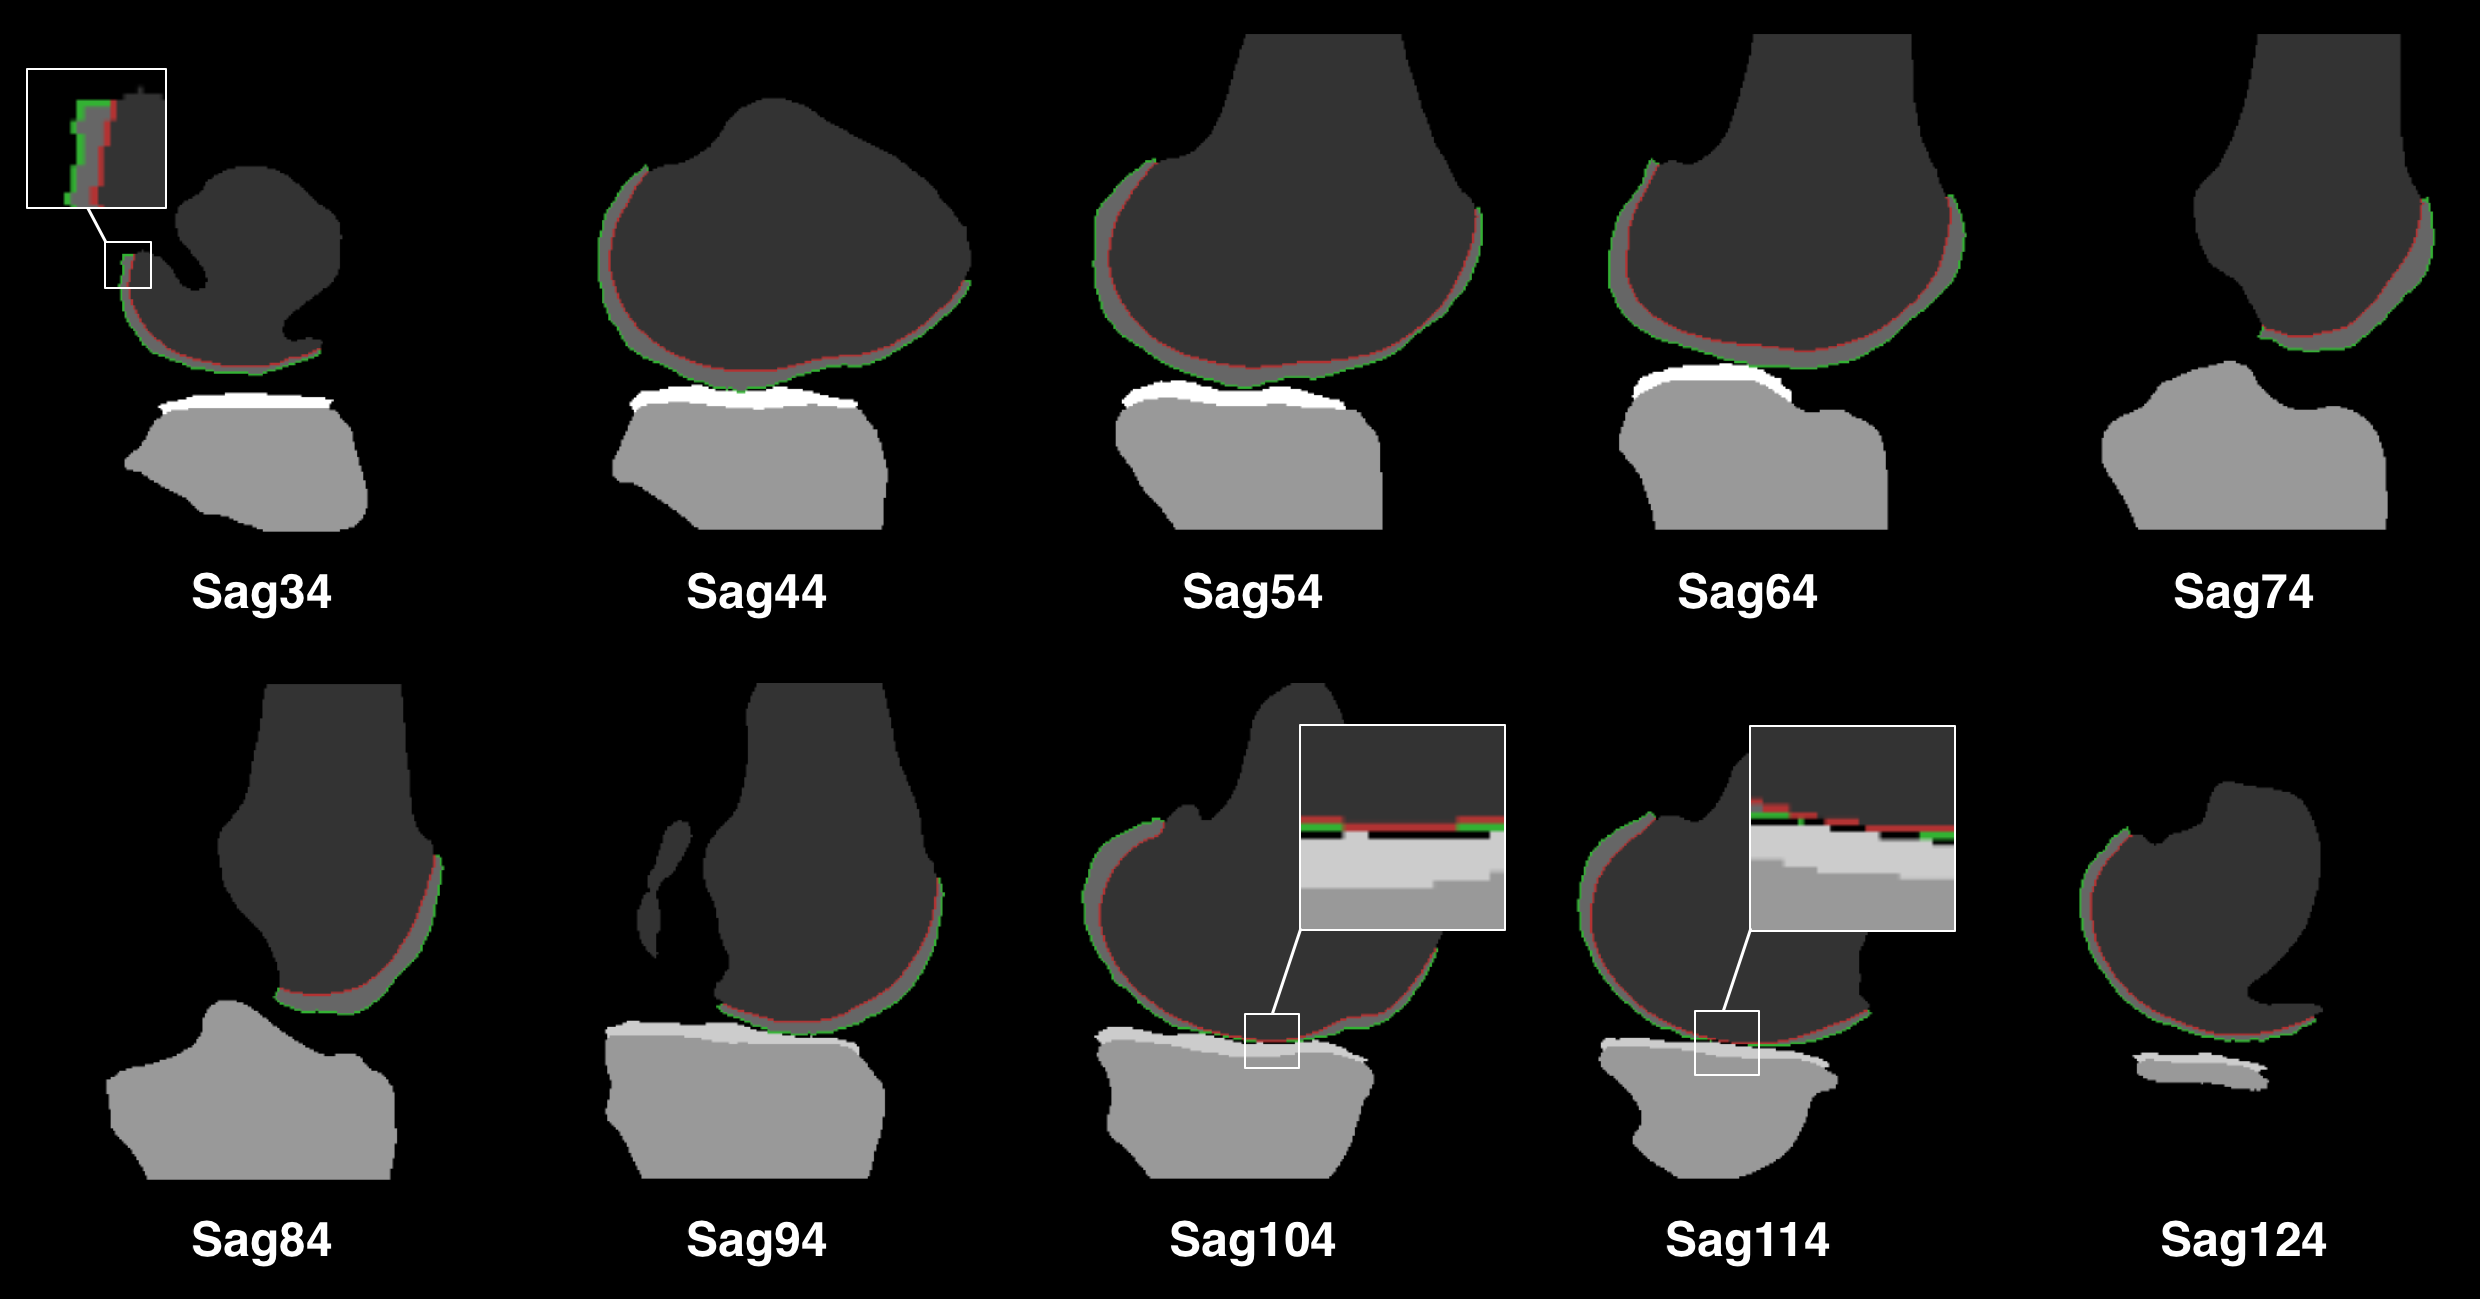
Figure 2 show satisfying performance of the proposed cartilage boundary separation method.Figure 3 shows the surface normal estimation. Note spatial smoothing increases the consistency of vectors in a small region, and thus improves the robustness and accuracy of the thickness measurement.
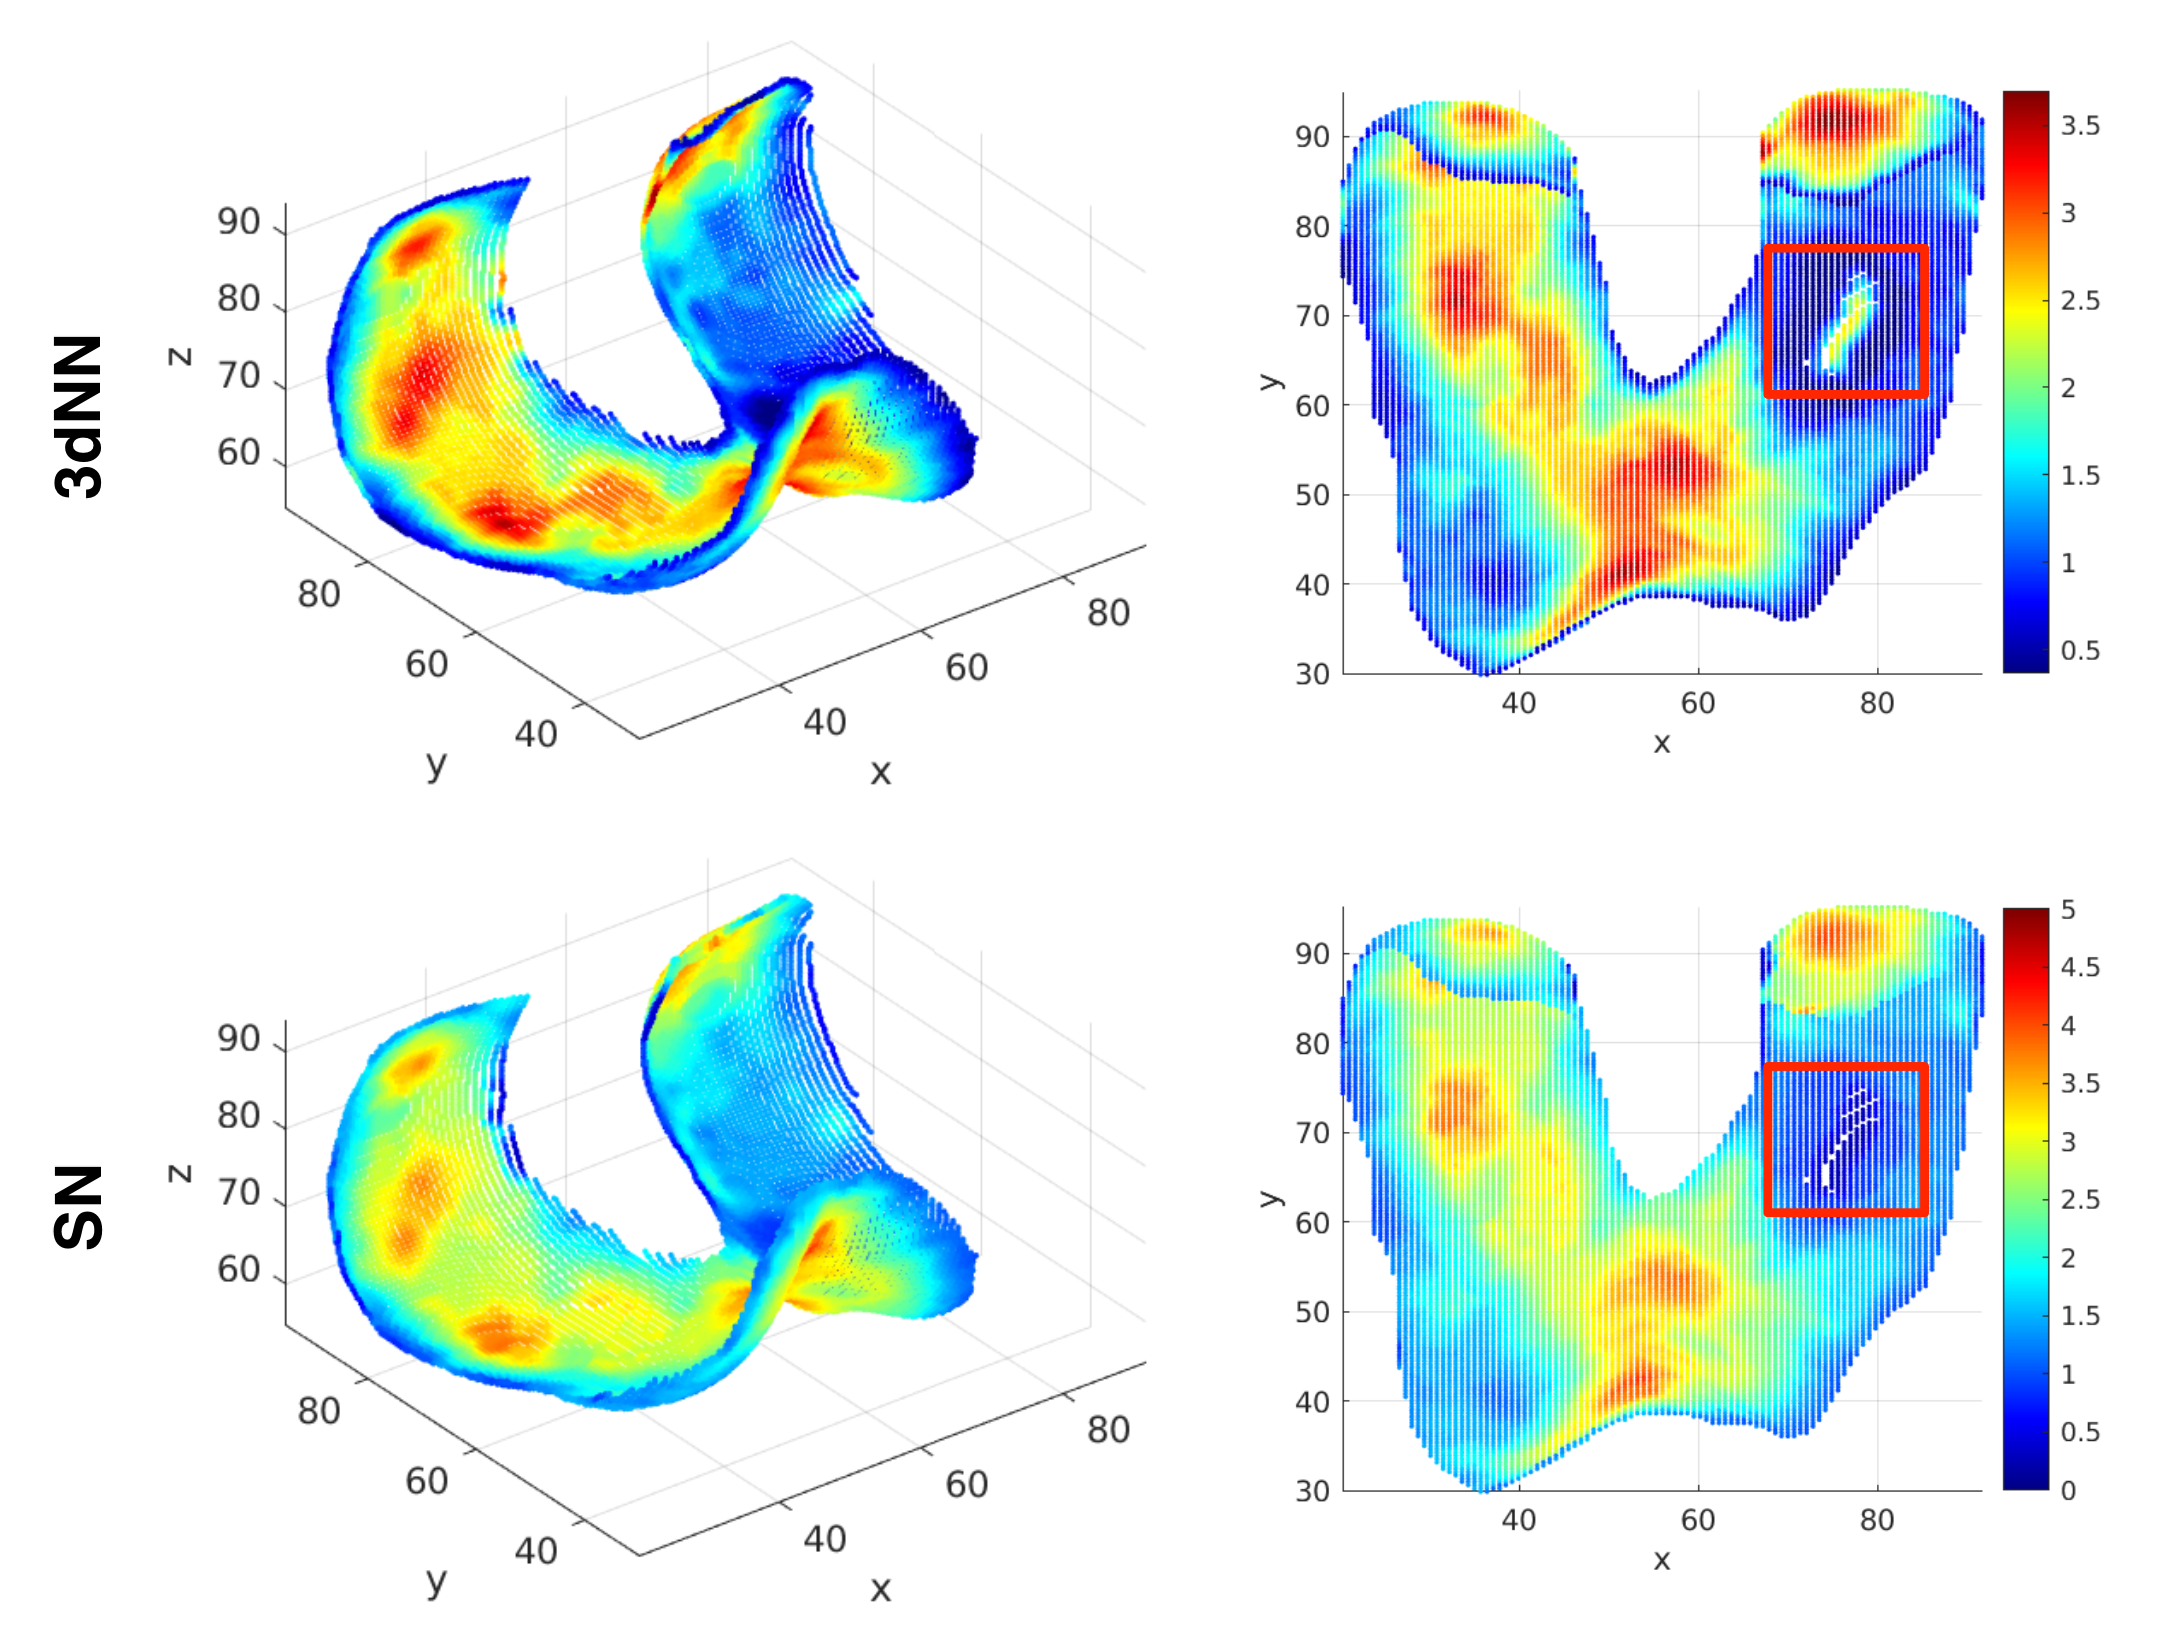
Figure 4 shows comparison of the performance of the proposed method and the 3dNN approach. Note both methods have similar results in the central regions of the cartilage, but obvious differences at the edges and the regions where cartilage is thin. As shown in the red square in Figure 4, the 3dNN method results in false thickness measurement at the region with sever cartilage wearing, while the proposed method has more reliable estimation at this region. The 3dNN method also has erroneous “thickness loss” appearance along the edge of the thickness map. Such effect is subtle when using our proposed approach.
Discussion
The use of uncertainty map in cartilage thickness measurement is due to partial volume effect. Voxels at the boundaries contain multiple tissues. The uncertainty estimation proposed here is subject to the assumption of two-tissue mixture. Under this assumption, boundaries can span half of the voxel volume, resulting in uncertainty in thickness measurement. At the regions where the cartilage only has one voxel along the thickness direction, as shown in Figure 2 (sagittal slice 104 & 114), the estimated primary thickness is zero (Figure 5a). The uncertainties are added to the primary thickness map to address this issue (Figure 5c). When calculating the distance between voxels from two boundaries, the uncertainty doubles. So we add twofold uncertainty map to the primary thickness map (Figure 5d).The estimation errors of 3dNN method at the edges and regions with thin cartilage is due to the nature of the nearest neighbor algorithm. The proposed approach is advantageous in handling these issues.
Conclusion
We proposed an automated method to measure knee cartilage thickness from MRI images. Compared with the traditional nearest neighbor method, the proposed method provides more reliable measurement at the edges and the regions with thin cartilage. With its nature of automated fast processing, it has potential to benefit the existing OA diagnosis.Acknowledgements
This study is supported by a grant from the Innovation and Technology Commission of the Hong Kong SAR (Project MRP/001/18X) and a grant from the Research Grants Council of the Hong Kong SAR (Project SEG CUHK02).References
1. Peterfy, C. G., Guermazi, A., Zaim, S., Tirman, P. F. J., Miaux, Y., White, D., ... & Genant, H. K. (2004). Whole-organ magnetic resonance imaging score (WORMS) of the knee in osteoarthritis. Osteoarthritis and cartilage, 12(3), 177-190.
2. Kornaat, P. R., Ceulemans, R. Y., Kroon, H. M., Riyazi, N., Kloppenburg, M., Carter, W. O., ... & Bloem, J. L. (2005). MRI assessment of knee osteoarthritis: Knee Osteoarthritis Scoring System (KOSS)—inter-observer and intra-observer reproducibility of a compartment-based scoring system. Skeletal radiology, 34(2), 95-102.
3. Hunter, D. J., Lo, G. H., Gale, D., Grainger, A. J., Guermazi, A., & Conaghan, P. G. (2008). The reliability of a new scoring system for knee osteoarthritis MRI and the validity of bone marrow lesion assessment: BLOKS (Boston–Leeds Osteoarthritis Knee Score). Annals of the rheumatic diseases, 67(2), 206-211.
4. Hunter, D. J., Guermazi, A., Lo, G. H., Grainger, A. J., Conaghan, P. G., Boudreau, R. M., & Roemer, F. W. (2011). Evolution of semi-quantitative whole joint assessment of knee OA: MOAKS (MRI Osteoarthritis Knee Score). Osteoarthritis and cartilage, 19(8), 990-1002.
5. Ronneberger, O., Fischer, P., & Brox, T. (2015, October). U-net: Convolutional networks for biomedical image segmentation. In International Conference on Medical image computing and computer-assisted intervention (pp. 234-241). Springer, Cham.
6. Ambellan, F., Tack, A., Ehlke, M., & Zachow, S. (2019). Automated segmentation of knee bone and cartilage combining statistical shape knowledge and convolutional neural networks: Data from the Osteoarthritis Initiative. Medical image analysis, 52, 109-118.
Figures