2967
Automated Pipeline for Quantitative MRI Evaluation of Knee Articular Cartilage in Longitudinal Osteoarthritis Trials1Department of Biomedical Imaging and Image-Guided Therapy, Medical University of Vienna, Vienna, Austria, 2Department of Orthopedics and Trauma Surgery, Medical University of Vienna, Vienna, Austria, 3Novartis Institutes for Biomedical Research, Basel, Switzerland
Synopsis
The purpose of this study was to develop a fully automated reproducible tool for analysis of morphological and compositional quantitative MR parameters in well-defined cartilage sub-fields across the human knee. This tool was deployed to proton and sodium MR images and the reproducibility was assessed by test re-test scan of ten patients at baseline and after eight days. Due to high reproducibility found in this study this tool may be considered as a good alternative to manual evaluation which, as being extremely expertise-dependent and time-consuming, could represents a considerable burden for large clinical osteoarthritis trials.
Introduction
Osteoarthritis longitudinal studies, whether related to the progression of the disease or the effect of new therapies, require very precise measurements of cartilage structure and in some cases of its composition [1]. Meanwhile new tools are also needed to meet the growing needs for fast and reliable image analysis [2][3]. The purpose of this study was to develop a fully automated reproducible tool for analysis of morphological and compositional quantitative MR parameters in well-defined cartilage sub-fields across the human knee. This tool was deployed to proton (1H) and sodium (23Na) MR images and the reproducibility was assessed by test re-test scan of patients at baseline and after eight days. .Materials and Methods
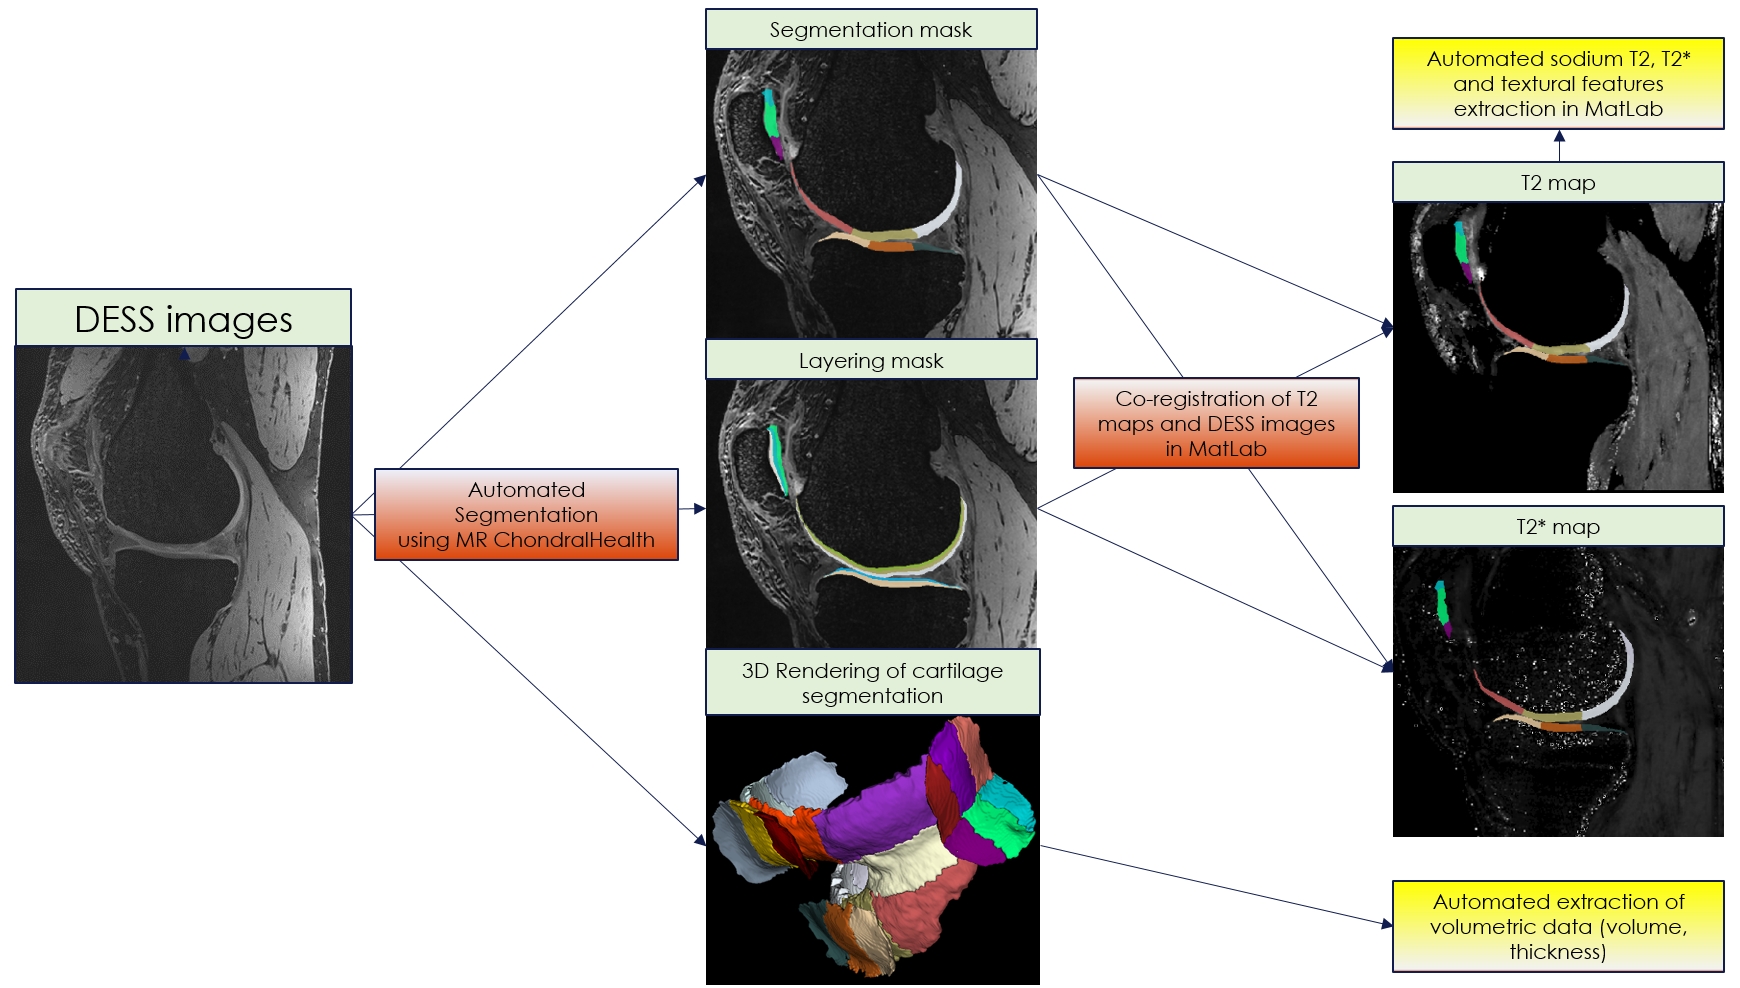
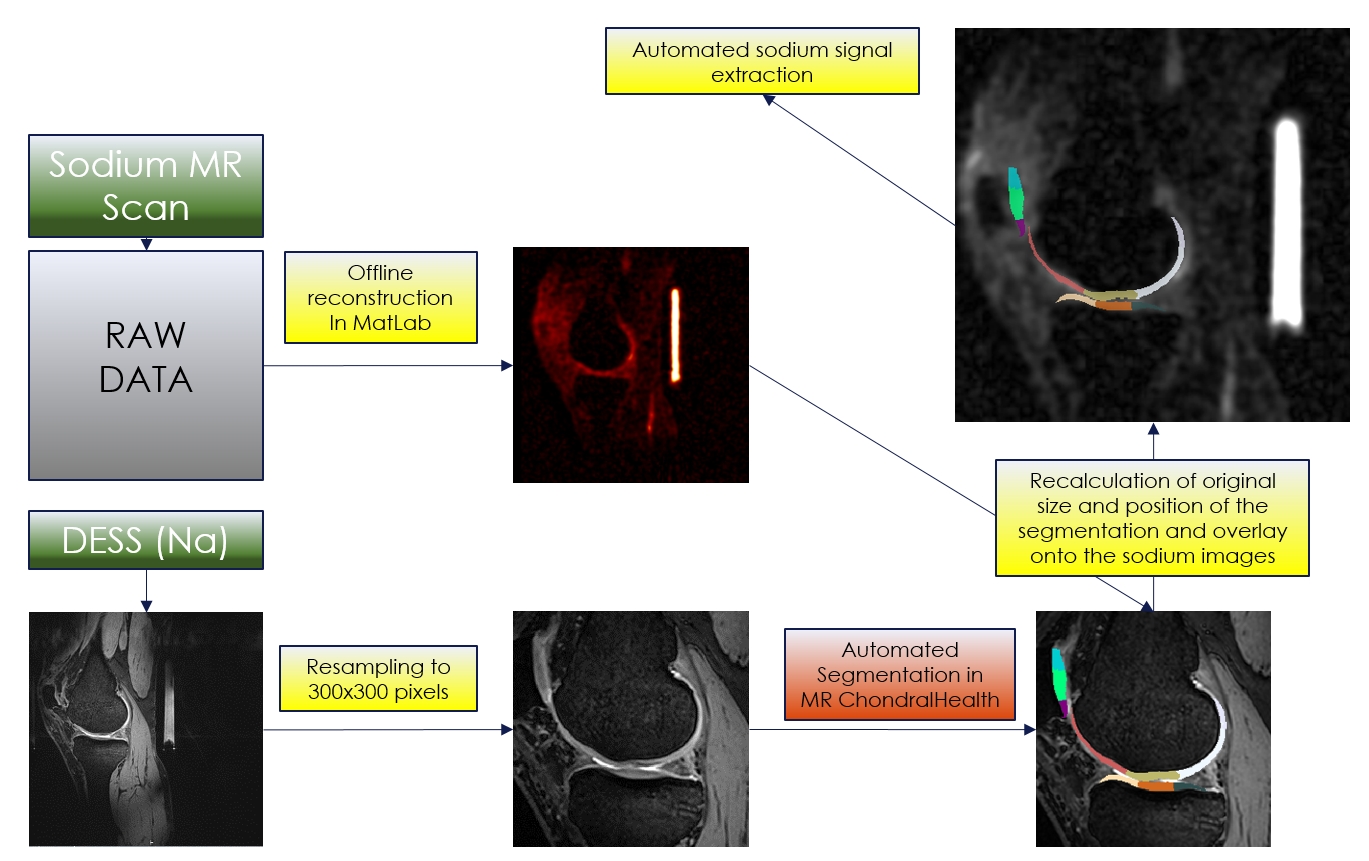
Ten patients with low-grade femoral cartilage defects were included in the study and were scanned twice on a 7T MRI scanner eight days apart. A three-dimensional double-echo steady-state (3D-DESS) sequence with isotropic resolution (0.45mm3) was used to acquire high-resolution MR images for automated cartilage segmentation, and T2 mapping, as a potential marker of cartilage quality, was performed using a 3D-triple-echo steady-state (3D-TESS) sequence. Sodium MR was also performed using a double-tuned sodium/proton coil to generate morphological images necessary for co-registration with sodium images and thus allow for assessment of glycosaminoglycan (GAG) content in specific cartilage regions of the knee. Each dataset was processed by MRChondralHealth software (Siemens Healthineers, Erlangen, Germany) for automated segmentation of knee articular cartilage and its reconstruction in 3D. Resulting segmentation files containing 21 sub-fields determined based on anatomical landmarks that are visible on MR images but also during arthroscopy were converted to nifty files and loaded in Matlab for further post-processing. T2, T2* and sodium maps were co-registered with 3D-DESS images and corresponding values were automatically extracted for each of the 21 sub-fields (Figure 1). In case of sodium, DESS images needed to be resampled and cropped before using in MRChondralHealth. Before co-registration with sodium images, all steps must be reverted (Figure 2). Then, a multimodal co-registration method was applied using spatial mapping of fixed images (DESS) and moving images (TESS). Affine transformation with 12 degrees of freedom was used. Optimizer function parameters were determined by a previous iterative process, while a similarity index map was used as a quantitative co-registration quality marker. The resultant optimizer parameters were: initial radius = 0.001; epsilon = 1.5e-4; growth factor = 1.01; and maximum iterations = 300. Finally, the resulting transformation was applied to the actual map. Cartilage volume, thickness, and mean T2, and sodium values were automatically extracted for each of the 21 cartilage sub-fields. Similarly, seven texture features were extracted from T2 maps from each sub-field using a Gray-Level Co-Occurrence Matrix (GLCM) approach. The reproducibility of each variable was expressed as a coefficient of variation (CV, %).Results
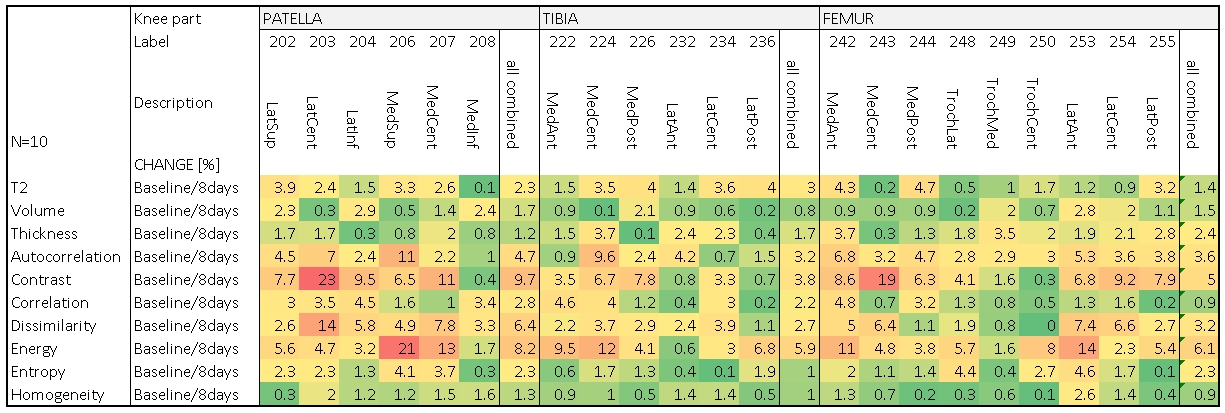
The mean analysis time for the 3D automated segmentation was 8.2 ± 2.0 minutes per dataset. In most cases, small corrections of the automated segmentation were required, most often in the lateral posterior femur, and the lateral anterior and posterior tibia, which took approximately 3 minutes per case. Test re-test analysis of automated cartilage segmentation and quantitative parameter extraction revealed excellent reproducibility for cartilage volume (mean CV of patella was 1,7%, tibia 0.8% and femur 1.5%) and thickness determination (mean CV of patella was 1,2%, tibia 1.7% and femur 2.4%). Similarly, T2 values from test re-test showed mean CV of 2.3% for the patella, 3.0% for the tibia and 1.4% for the femur. Sodium values from test re-test showed mean CV of 4.1% for the patella, 4.6% for the tibia and 3.2% for the femur. Finally, textural features such as homogeneity (mean CV of 1.0%), entropy (mean CV of 1.8%) and correlation (mean CV of 2.1%) were highly reproducible, while others such as autocorrelation (mean CV of 4.0%), contrast (mean CV of 6.8%), energy (mean CV of 6.7%) and dissimilarity (mean CV of 4.1%) revealed larger variability.Discussion/Conclusion
This newly developed fully automated analysis of knee articular cartilage combines quantitative morphological and compositional information from 21 anatomically well-defined subfields of the knee joint and provides reproducible and robust evaluation of the cartilage volume, thickness and composition throughout the whole knee, in particular collagen specific (T2 maps) and glycosaminoglycan specific (sodium MRI) parameters. Therefore, this approach may be considered as a good alternative to manual evaluation which, as being extremely expertise-dependent and time-consuming, could represents a considerable burden for large clinical osteoarthritis trials. MRChondralHealth can automatically segment knee cartilage from large variety of isotropic sequences with sufficient bone/cartilage contrast and obtained from both 7T and 3T scanners. Multi-center trials usually accommodate protocols based on the vendor-specific sequence capabilities, therefore a robust and protocol-independent tool is required for central-reading site. As another advantage, this tool can be easily extended to other parametric and quantitative MR techniques such as gagCEST or various types of T2 and T1 mapping method.Acknowledgements
This study was supported by the Austrian Science Fund, KLIF-541 B30. The financial support by the Austrian Federal Ministry for Digital and Economic Affairs and the National Foundation for Research, Technology and Development is gratefully acknowledged.References
[1] Glyn-Jones S. et al. Osteoarthritis, The Lancet, Volume 386, Issue 9991, 25–31 July 2015, Pages 376-387
[2] Ambellan F., et al, Automated segmentation of knee bone and cartilage combining statistical shape knowledge and convolutional neural networks, Medical Image Analysis, Volume 52, February 2019, Pages 109-118
[3] Norman B. et al. Use of 2D U-Net Convolutional Neural Networks for Automated Cartilage and Meniscus Segmentation of Knee MR Imaging Data to Determine Relaxometry and Morphometry, Radiology 2018; 288:177–185
Figures