2966
T2 mapping of normal and abnormal cartilage in the equine distal interphalangeal joint using low field MRI
Melissa E Baker1, Lucy E Kershaw2, Steve Roberts3, Richard Reardon1, Sionagh Smith1, and Sarah E Taylor1
1Royal (Dick) School of Veterinary Studies and The Roslin Institute, The University of Edinburgh, Edinburgh, United Kingdom, 2Centre for Cardiovascular sciences and Edinburgh Imaging, The University of Edinburgh, Edinburgh, United Kingdom, 3Hallmark Veterinary Imaging Ltd, Guildford, United Kingdom
1Royal (Dick) School of Veterinary Studies and The Roslin Institute, The University of Edinburgh, Edinburgh, United Kingdom, 2Centre for Cardiovascular sciences and Edinburgh Imaging, The University of Edinburgh, Edinburgh, United Kingdom, 3Hallmark Veterinary Imaging Ltd, Guildford, United Kingdom
Synopsis
Osteoarthritis is a common source of pain and lameness in horses of all ages. There are currently no diagnostic tests available to detect early cartilage lesions. A T2 mapping sequence was used on a low field 0.27 T open MR system to image the cartilage of 20 ex vivo equine distal interphalangeal joints. Results showed significantly increased mean T2 relaxation time 114±95 ms in lateral cartilage (higher OARSI grades) compared to 71±21 ms in medial cartilage (lower OARSI grades). This quantitative MRI technique could be used to diagnose early pathology in equine joints in the future.
Introduction
Osteoarthritis (OA) is a common musculoskeletal disease of the horse causing pain, lameness, poor performance and premature euthanasia. The prevalence is greater than 50% in horses >15 years and over 80% of horses >30 years [1]. The distal interphalangeal joint (DIPJ) is a common site for OA development. Currently, there are no diagnostic tools available for early detection of equine OA which has led to exploration of quantitative MRI techniques that detect tissue damage before morphological change is apparent [2]. During cartilage deterioration the collagen and proteoglycan content decreases and is replaced by water, increasing cartilage T2 [2]. Several studies have used this technique in the human knee [3-5] but only a small number have been performed in equine joints [6-9]. Low field standing magnets are the most widely available systems in UK equine practice and there is an unmet clinical need to develop T2 mapping for this system.Methods
A 0.27 T open system (Hallmarq Veterinary Imaging Ltd©, Surrey, UK) was used to scan 8 phantoms with known T2 values (Leeds Test Objects Ltd, Leeds, UK) for sequence validation, using a 2D multi echo gradient echo T2 mapping sequence (Table 1). Twenty DIPJs from 10 horses euthanised for clinical reasons were obtained from the Dick Vet Equine Hospital, University of Edinburgh (Veterinary Medicine Ethical Review Committee approval 9314 and 4.18, informed consent obtained for all cases). The feet were removed via disarticulation at the metacarpophalangeal or metatarsophalangeal joint and imaged within 12 hours of euthanasia using the T2 mapping sequence as above. After imaging the DIPJ was opened, gross changes observed and cartilage and subchondral bone sections were removed from the surface of the second phalanx (P2) using a cast saw. Specimens were initially fixed in 10% neutral buffered formalin and immersed in Histo-Decal® for 7-10 days then embedded in paraffin wax. Four-micron sections were cut and stained with haematoxylin and eosin and safranin O to assess the cartilage and proteoglycan content. Sections were examined and graded using the OARSI scoring system [10]. Differences between medial and lateral OARSI scores were assessed using the Wilcoxon signed rank test. Fiji imageJ software [11, 12] with the MRIAnalysisPak plugin [13] was used to calculate T2 maps by fitting a single exponential to the signal intensities on a voxel-by-voxel basis. ROIs were drawn over the medial and lateral condylar P2 cartilage and corresponding articulating third phalanx (P3) cartilage on the TE=22 ms image slice (figure 1) which matched the histological sample location. ROIs were transferred to the T2 maps to calculate mean T2 for the medial and lateral regions. These regions were chosen because gross and histological pathology indicated these regions of the joint were most frequently affected by OA. Two observers drew ROIs and one observer repeated the method twice. Differences in T2 between the medial and lateral cartilage were determined using Student’s t-test (P<0.05). Intra and inter-rater variability was quantified using the intraclass correlation coefficient (ICC) (one-way ANOVA and two-way mixed-effects model respectively).Results
There was close agreement between the nominal and measured T2 relaxation times in the phantom study (figure 2). The mean T2 was higher in the lateral vs medial cartilage (114±95 vs 71±21 ms, p=0.00002) (figure 3). Figure 4 shows an example T2 map colour overlay on the corresponding TE=22 ms image. Mean OARSI grade was significantly higher in the lateral vs medial side (1.7±0.6 vs 1.2±0.5, Wilcoxon signed-rank test p=0.038). The intra-rater agreement for observer one was 0.98 and 0.99 for the lateral and medial side respectively (ICC). Inter-rater agreement was 0.82 (ICC).Discussion
The results of the phantom study provided quantitative validation for the T2 mapping sequence developed on the 0.27 T system, demonstrating close agreement for the range of T2 measured in the study. Longer T2 values (>200 ms) had wider standard deviations and were more difficult to measure precisely because the longest echo time was 110 ms. We showed significant differences in T2 between the medial and lateral regions of the DIPJ. Examination of histological sections from both regions demonstrated that lateral sections had higher OARSI scores than medial sections, indicating increased disease in the lateral cartilage. Damaged cartilage has a higher water content which increases T2, therefore the increased T2 in the lateral sections suggests detection of diseased cartilage tissue. There are limited reports in the equine literature of cartilage T2 values however one experimental study reported values ranging from 40.7 - 61.6 ms in normal cartilage [6]. The mean T2 reported here is higher suggesting measurement of abnormal cartilage but it is important to note that the ROIs were drawn over two cartilage surfaces (P2 and P3) inevitably incorporating synovial fluid. This was not the case in the previous study where one surface of the femoral articular cartilage was measured. The ICC values demonstrated excellent intra-rater variability and good inter-rater variability (ICC >0.90: excellent, 0.75-0.90: good, 0.50-0.75: moderate, <0.50: poor [14]).Conclusion
Low-field T2 mapping of the equine DIPJ was repeatable and reliable ex vivo. The research has shown significantly different T2 values between lateral and medial regions of the DIPJ which also had significantly different OARSI grades. This technique warrants further evaluation in live horses.Acknowledgements
This work was generously funded through a PhD scholarship by the Horse Trust. Hallmarq Advanced Veterinary Imaging© supported the research by providing a T2 mapping sequence to use on the 0.27 T standing magnet.References
- Ireland, J.L., et al., Disease prevalence in geriatric horses in the United Kingdom: veterinary clinical assessment of 200 cases. Equine Vet J, 2012. 44(1): p. 101-6.
- Mosher, T.J. and B.J. Dardzinski, Cartilage MRI T2 relaxation time mapping: overview and applications. Semin Musculoskelet Radiol, 2004. 8(4): p. 355-68.
- David-Vaudey, E., et al., T2 relaxation time measurements in osteoarthritis. Magn Reson Imaging, 2004. 22(5): p. 673-82.
- Liebl, H., et al., Early T2 changes predict onset of radiographic knee osteoarthritis: data from the osteoarthritis initiative. Ann Rheum Dis, 2015. 74(7): p. 1353-9.
- Joseph, G.B., et al., Texture analysis of cartilage T2 maps: individuals with risk factors for OA have higher and more heterogeneous knee cartilage MR T2 compared to normal controls--data from the osteoarthritis initiative.Arthritis Res Ther, 2011. 13(5): p. R153.
- White, L.M., et al., Cartilage T2 assessment: differentiation of normal hyaline cartilage and reparative tissue after arthroscopic cartilage repair in equine subjects. Radiology, 2006. 241(2): p. 407-14.
- Menendez, M.I., et al., Direct delayed human adenoviral BMP-2 or BMP-6 gene therapy for bone and cartilage regeneration in a pony osteochondral model. Osteoarthritis Cartilage, 2011. 19(8): p. 1066-75.
- Pownder, S., Koff, M.F., Fortier, L., Castiglione, E., Saska, R., Bradica, G., Novakofski, K. and Potter, H.G., Quantitative and Morphologic Evaluation of Cartilage Repair in an Equine Model in Proceedings of the International Society for Magnetic Resonance in Medicine. 2011. p. 499.
- Clark, D.J., Jia, G., Menendez, M.I., Choi, S., Miller, C.J., Sammet, S., Flanigan, D.C., Bertone, A.L. and Knopp, M.V., In Vivo Quantification of Cartilage Regeneration in an Equine Model at 3T Following Gene Therapy in Proceedings of the International Society for Magnetic Resonance in Medicine. 2010. p. 232.
- Pritzker, K.P.H., et al., Osteoarthritis cartilage histopathology: grading and staging. Osteoarthritis and Cartilage, 2006. 14(1): p. 13-29.
- Schindelin, J., et al., Fiji: an open-source platform for biological-image analysis. Nature Methods, 2012. 9(7): p. 676-682.
- Rueden, C.T., et al., ImageJ2: ImageJ for the next generation of scientific image data. BMC Bioinformatics, 2017. 18(1): p. 529.
- Schmidt, K., MRIAnalysisPak Manual. 2004, Center for Comparative Neuroimaging (CCNI) at the University of Massachusetts Medical School and The Small Animal MRI Laboratory at Harvard Medical School/Brigham & Women’s Hospital.
- Koo, T.K. and M.Y. Li, A Guideline of Selecting and Reporting Intraclass Correlation Coefficients for Reliability Research. J Chiropr Med, 2016. 15(2): p. 155-63.
Figures
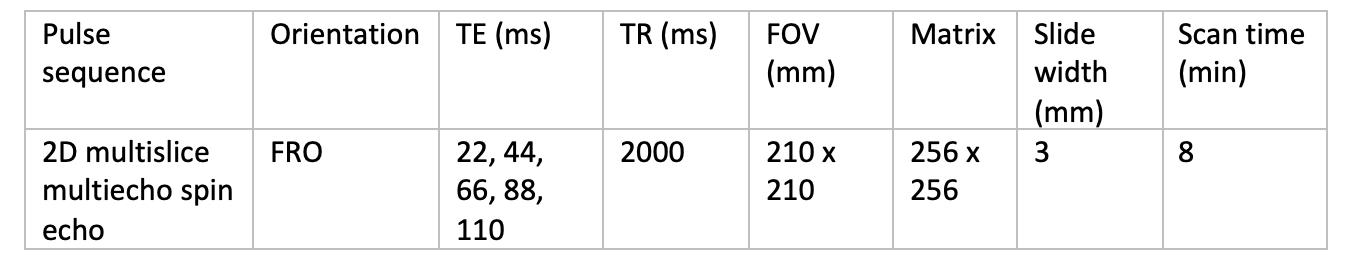
Table 1: Pulse sequence parameters for T2 mapping using low field open (0.27 T) MRI system
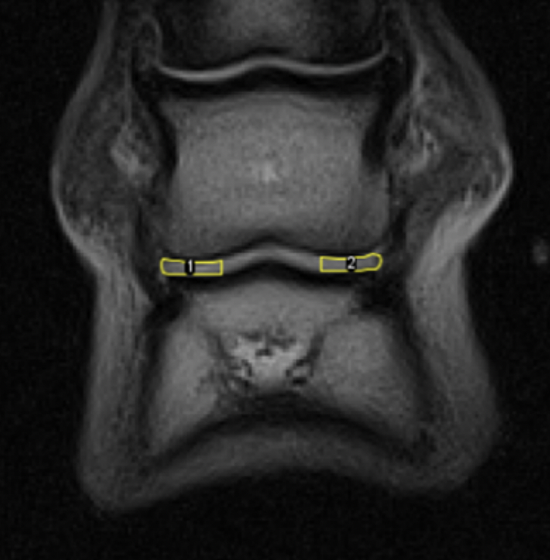
Figure 1. Example of a left fore foot frontal TE=22 ms image slice depicting the ROIs; medial (1) and lateral (2) condylar articular cartilage surface of P2 and articulating P3.
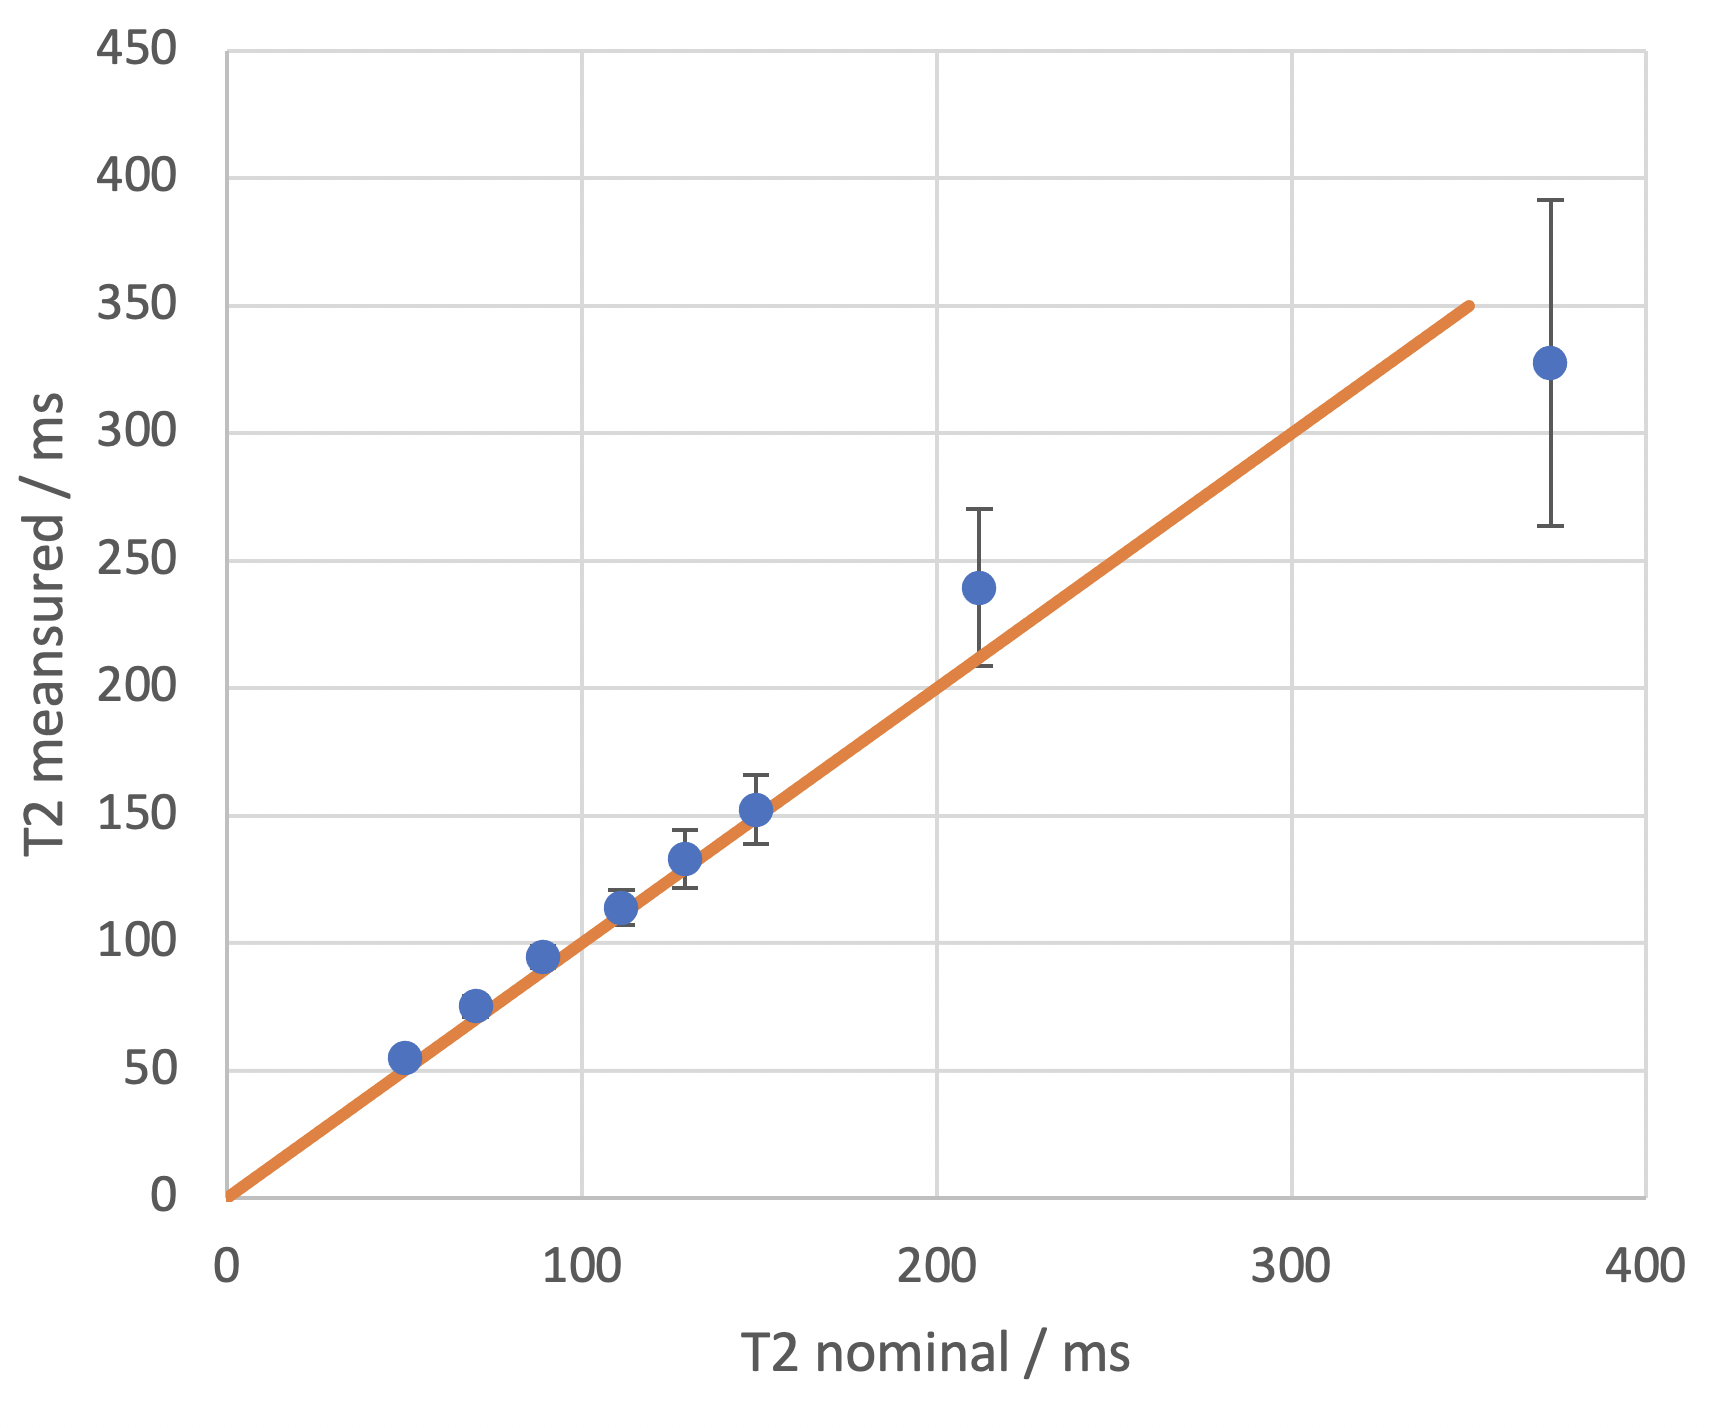
Figure 2. Mean T2 ± standard deviations vs nominal T2 values. Close agreement is seen in the first 6 phantoms in the lower T2 range (50-150 ms). Orange line is the line of identity
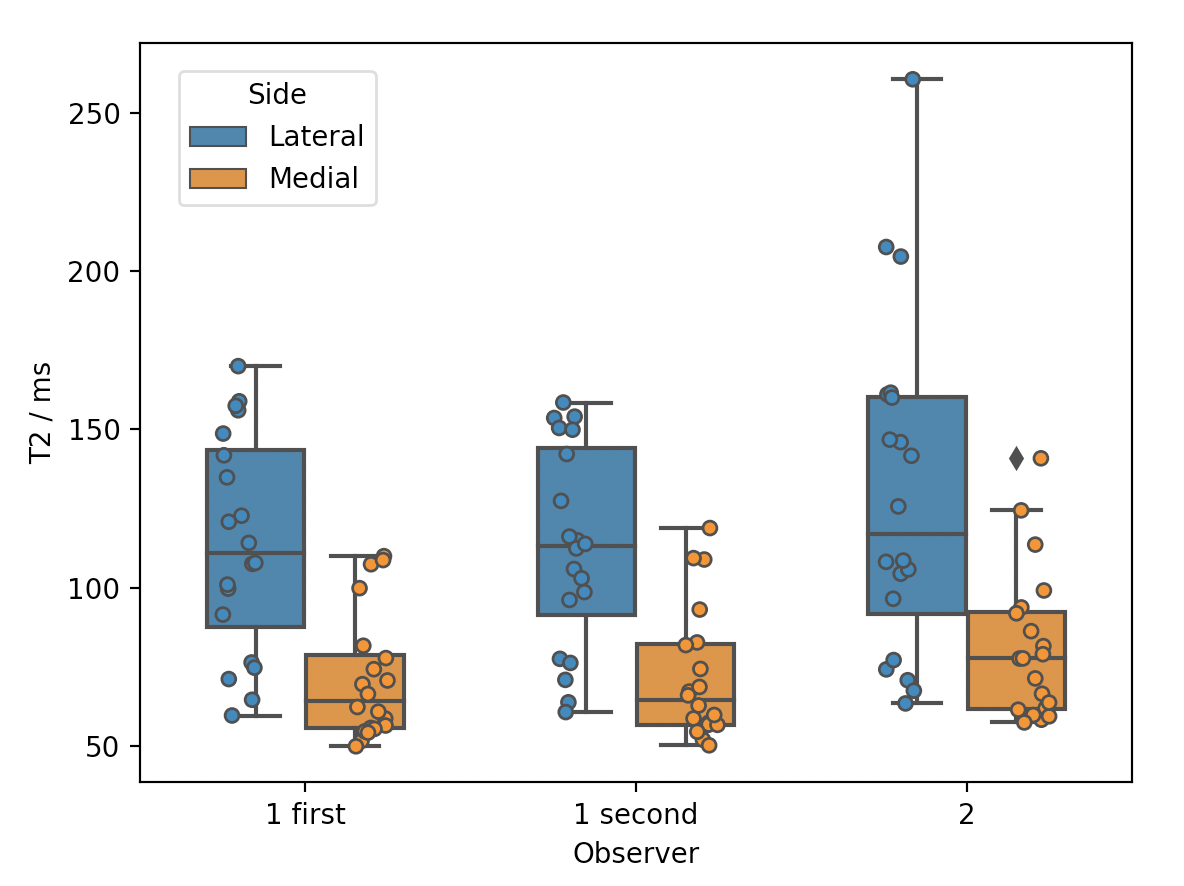
Figure 3. Box plots of observer one’s first and second lateral (blue) and medial (orange) T2 measurements and observer two’s first measurements. Boxes show minimum T2, median with interquartile range and maximum T2, along with individual data points.
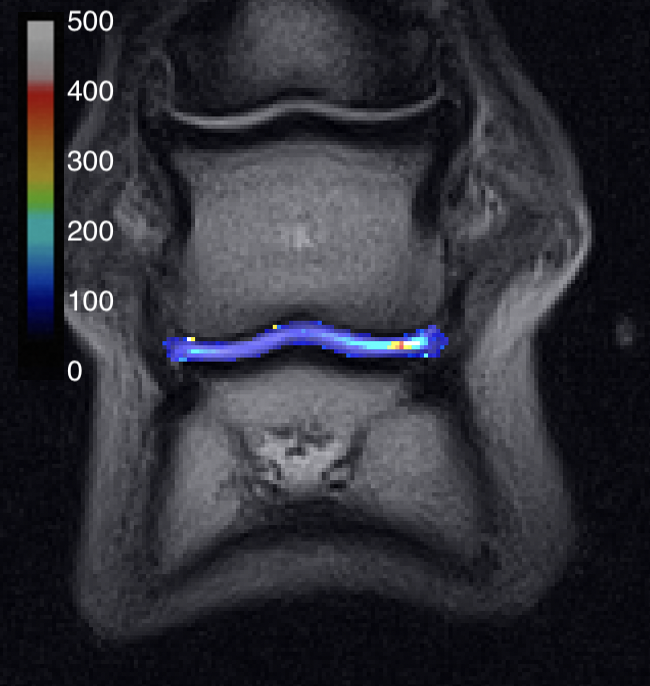
Figure 4. Example T2 map depicting increased T2 in the lateral condylar articular cartilage of P2 and articulating P3. Colour bar in ms.