2961
Imaging hyaluronan-mediated inflammation in articular cartilage1New York University Langone Health, New York, NY, United States, 2New York University Tandon School of Engineering, New York, NY, United States, 3University of Western Ontario, Ontario, ON, Canada
Synopsis
The objective of this work is to develop and validate a molecular imaging approach to image inflammation in articular cartilage. We targeted hyaluronan (HA)-mediated inflammation, which is a common inflammatory pathway activated in cartilage, with contrast agents designed using a 15-mer peptide that modulates HA-cell interactions. We identify optimal imaging times and demonstrate that contrast agent accumulates in areas of macroscopic damage. In vivo, MRI detected accumulation of the contrast agent in cartilage of PTOA joints but not in controls. Cartilage in all but one ACL-injured joint showed T1-changes indicative of inflammation, demonstrating that HA-mediated inflammation is a common finding.
INTRODUCTION
Posttraumatic osteoarthritis (PTOA) is a common and debilitating consequence of joint injury responsible for the increasing rates of early disability in the young population.1 A driving factor for the progression to PTOA is perpetuation of the inflammatory response to injury into chronic inflammation.2-4 We are very limited in our ability to image inflammation. Contrast-enhanced MRI ingeniously exploits the increased vascularity of inflamed tissue but has little use in avascular tissues like cartilage. To overcome this limitation, we propose a molecular imaging approach. We targeted hyaluronan (HA)-mediated inflammation, which is a common inflammatory pathway activated in cartilage by HA breakdown fragments. We used a promising 15-mer peptide, P15-1, that functions by altering HA-mediated pro-inflammatory signaling.5 P15-1 peptide when combined with high molecular weight(HMW)HA shows in chondrocytes anti-inflammatory and anabolic signaling.6METHODS
Contrast agents. Four peptide conjugates of P15-1 were synthetized, including the unlabeled parent peptide (P15-1), a fluorescent dye-labelled version (Cy5.5-P15-1), a fluorescent dye-labelled scrambled version (Cy5.5-Sc-P15-1) and a gadolinium-DOTA-conjugated version of the peptide (Gd-DOTA-P15-1).Animal model. We induced PTOA in male Sprague-Dawley rats (14-16 weeks)7 by anterior cruciate ligament (ACL) rupture by mechanical loading (ACLR) that mimics human ACL rupture.8 Contralateral limbs of ACLR did not undergo any intervention. All experiments were approved by NYU IACUC.
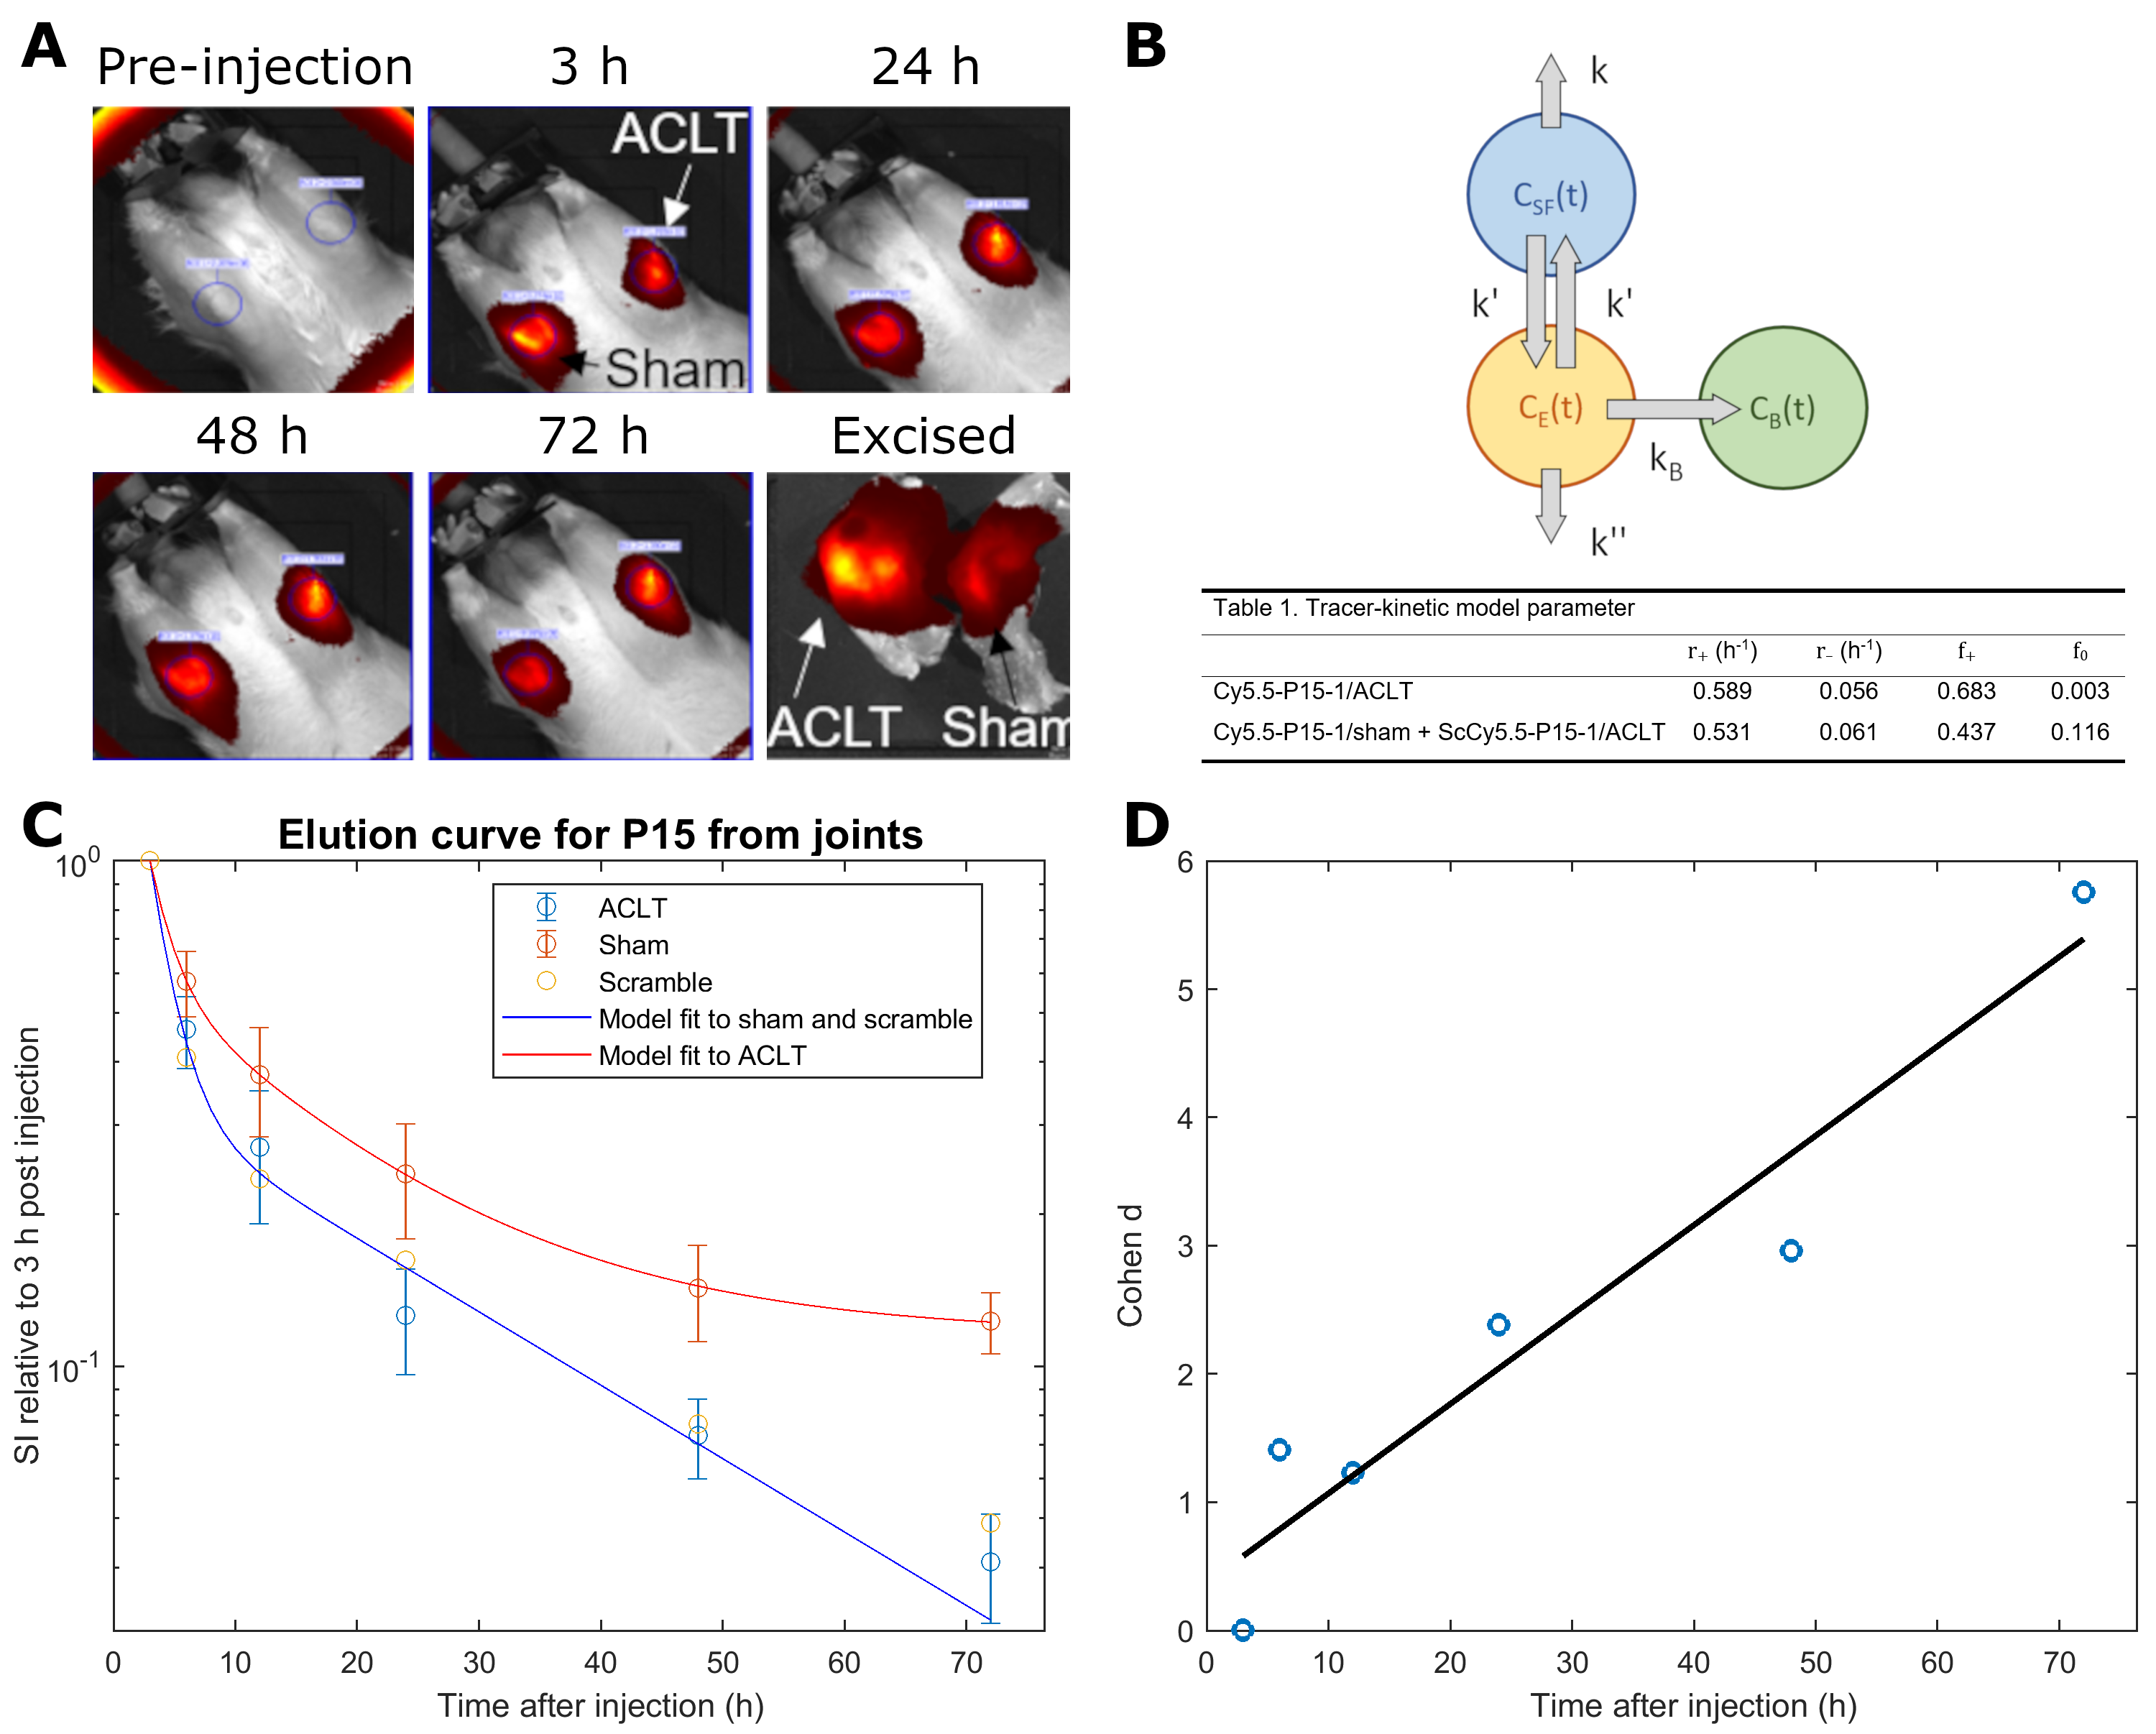
Elution curve of Cy5.5-P15-1 for optimal imaging points. Eight weeks after injury, animals (n=8) underwent bilateral intraarticular injection of Cy5.5-P15-1 (62µM). One additional animal was injected with Cy5.5-ScP15-1 (62µM). Optical imaging was acquired at 3, 6, 12, 24, 48 and 72h after injection. After imaging joints were harvested for histology. We fitted a three-compartment tracer-kinetic model to Cy5.5-P15-1/Cy5.5-ScP15-1 signal (Fig.1).
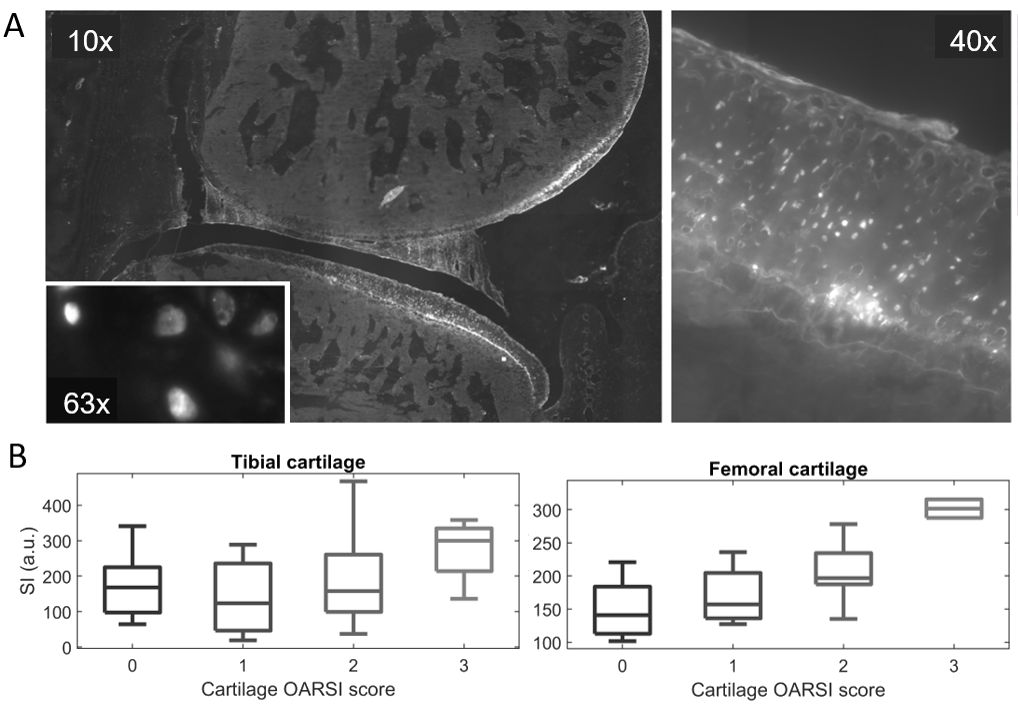
Histology analysis. Excised rat joints were flash-frozen and cryosectioned.9 Cryosections were scanned using a fluorescence microscope to study agent distribution. We segmented articular cartilage and menisci and calculated the average Cy5.5-P15-1 signal. Cartilage and menisci damage was graded with the OARSI score (Cartilage: 0–5; meniscus: 0–4).10
Validation of Gd-DOTA-P15-1 for MRI. We validated Gd-DOTA-P15-1 in 12 animals with ACL injury. Contralateral joints were used as controls. MRI of both limbs was acquired within 2 days of IA injection of Gd-DOTA-P15-1 (3.2mM) and 24 and 48h after injection.
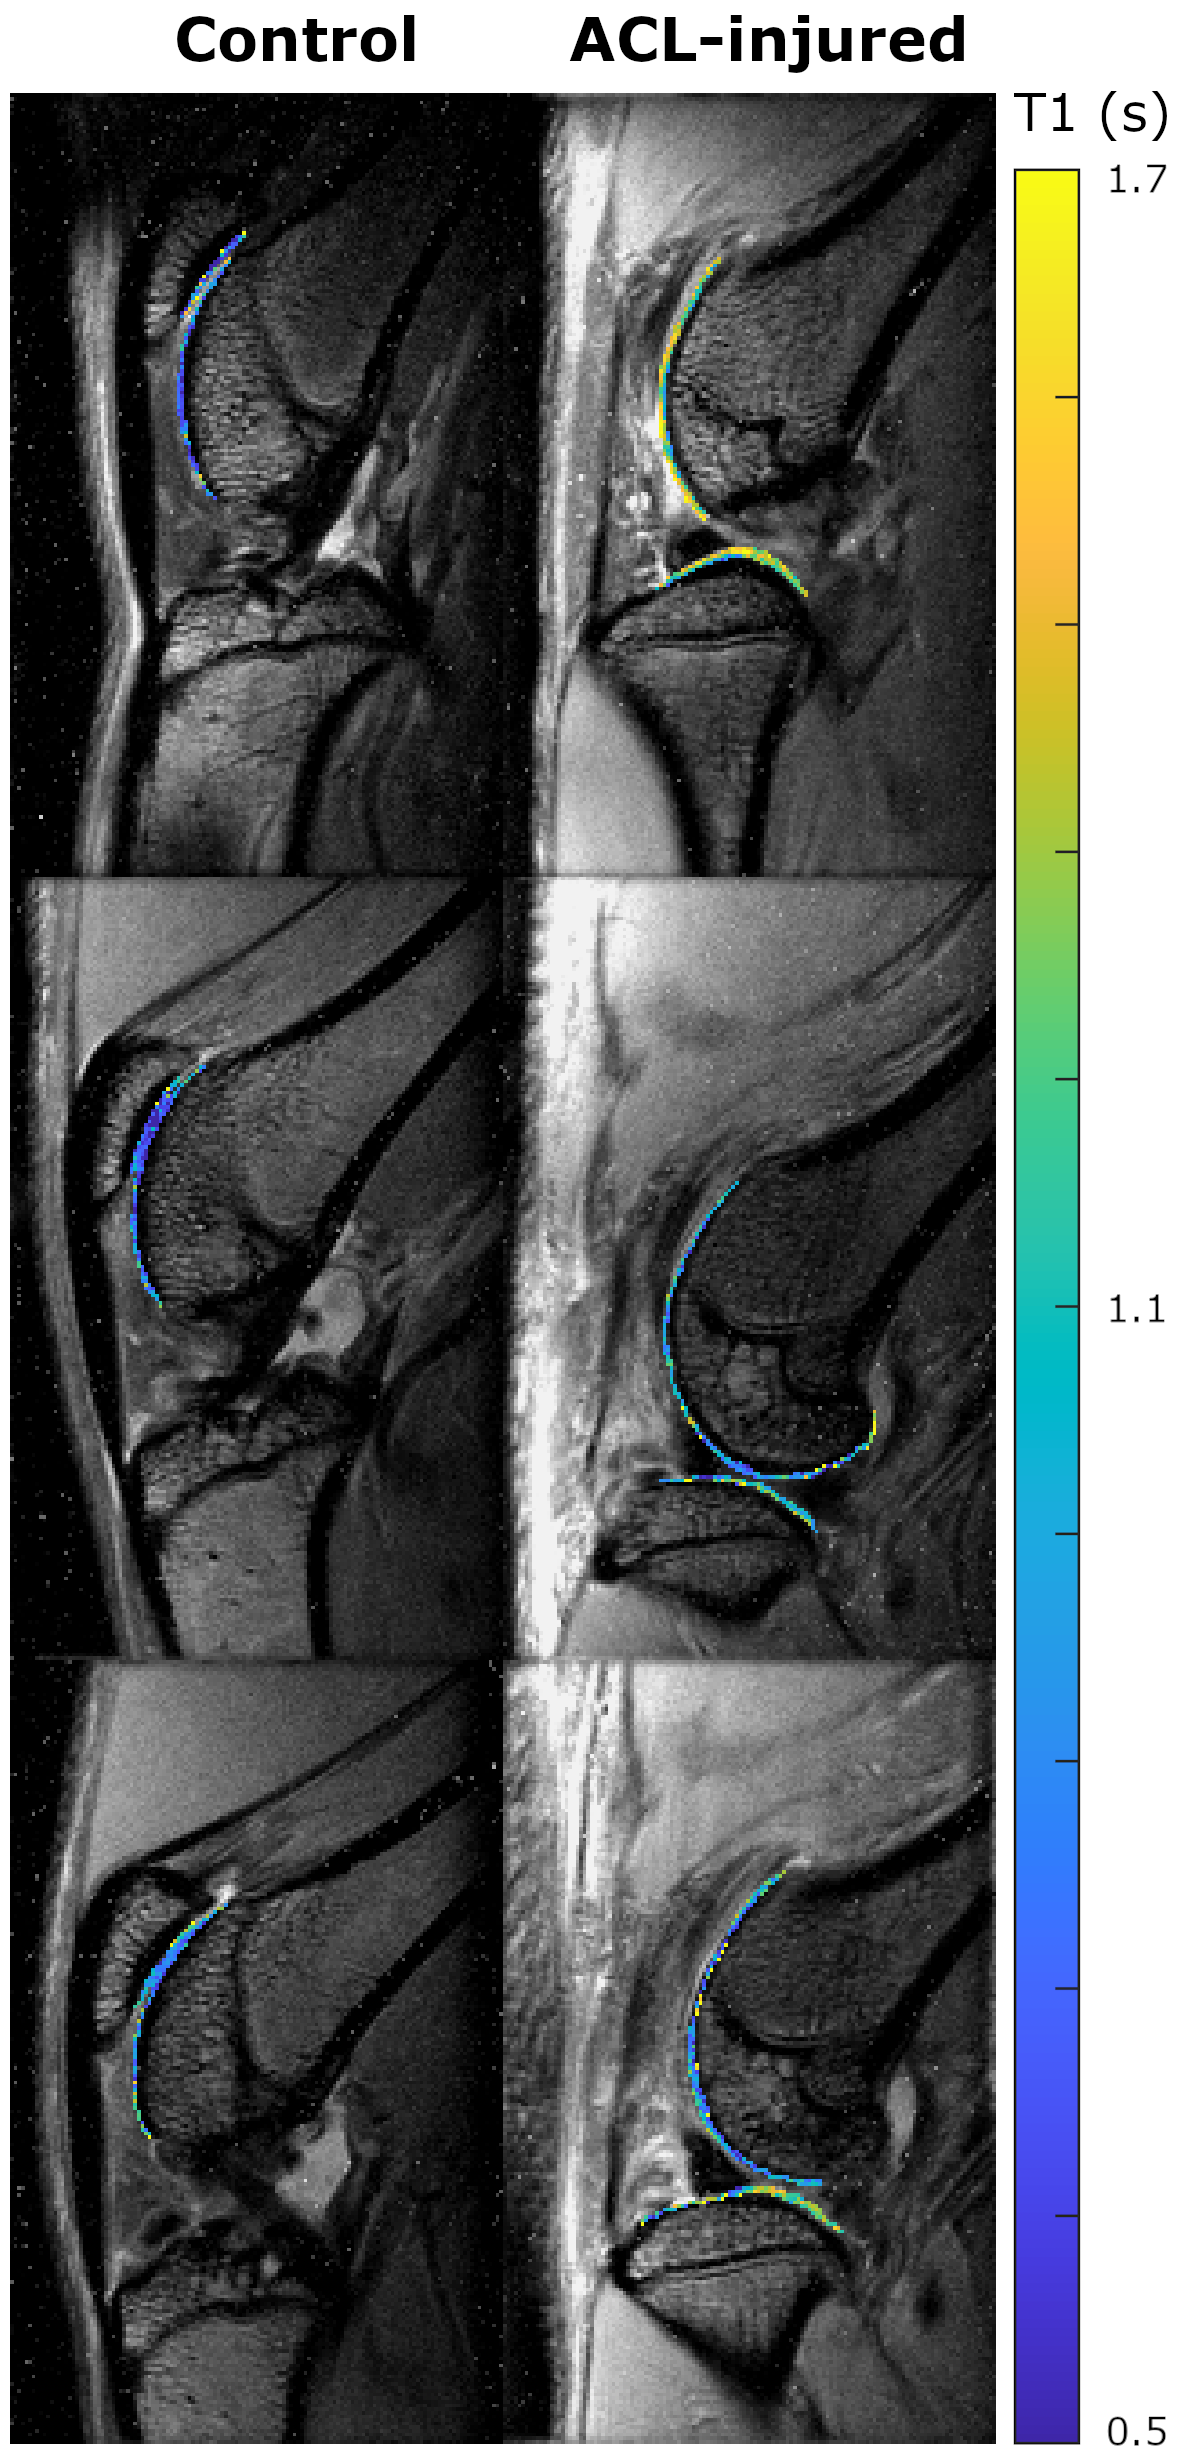
MRI. MRI was performed on a 7T Bruker system using a 4-channel receive surface coil. An inversion-recovery turbo-spin echo sequence was used to measure T1 (TE/TR=12.5/5343ms, TSE factor=5, echo spacing=6.25ms, 8 slices, resolution=100×100×800μm3, 12 inversion times from 0.15 to 5s, acquisition time=31min/limb). Images were acquired in the sagittal plane. Cartilage was segmented and average T1 was calculated for each cartilage plate (patella, tibia and femur). Accumulation of contrast agent was measured by the difference in T1 between pre-injection and post injection images (ΔT1).
Statistical analysis. We used one-way ANOVA with Bonferroni correction to study group differences. Pearson’s correlations between OARSI scores and Cy5.5-P15-1 intensity were calculated. Logistic regression was used to identify optimal diagnostic thresholds for ΔT1 between ACL injured and controls. A p-value of 0.05 indicated significance.
RESULTS
Elution curves of Cy5.5-P15-1. Elution curve of the contrast agent from 8 animals is shown in Fig. 1. Cy5.5-P15-1 signal was significantly higher in ACLR limbs for all time points after 12h with increasing effect-size over time. Longest time constant of the contrast agent was 11.3/12.4h for ACLR/sham groups and fraction of contrast agent retained in the joint was 12/0.25% for the ACLR/sham group (Fig.1B).Histology analysis. Cy5.5-P15-1 accumulated on chondrocytes (Fig. 2). Quantitative analysis showed a significant higher accumulation of Cy5.5-P15-1 in cartilage of ACLR joints compared to controls (+40.9%). Uptake of Cy5.5-P15-1 was largest in femur (+57.0%), followed by patella (+23.1%) and tibia (+16.6%). There was a significant correlation between tissue damage and Cy5.5-P15-1 accumulation for femoral (ρ=0.57) and tibial cartilage (ρ=0.32) and meniscus (ρ=0.48).
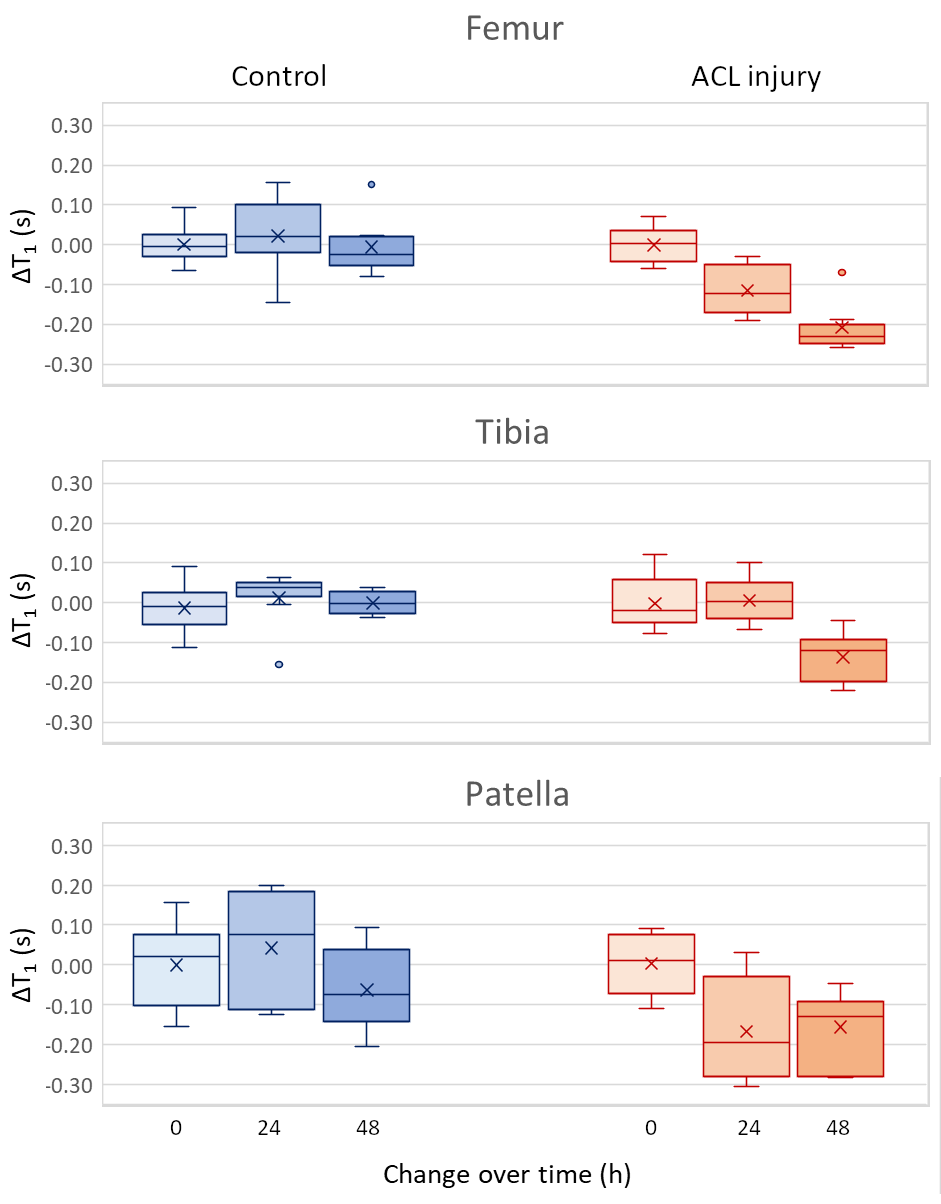
Validation of Gd-DOTA-P15-1. The relaxation rate of Gd-DOTA-P15-1 was 2.4mM-1s-1 (r2=0.994). ACL-injured limbs showed increased T1 values compared to controls in all cartilage plates (p<0.05, Fig. 3). At 48 hours T1 dropped in ACL-injured knees -15% (p<0.05) while it did not change in control groups (-2%, p=0.86, Fig. 4). A logistic regression model (ACLR~constant+ΔT1) identified an optimal threshold (ΔT1=-0.1s) to differentiate ACL injured and controls. All but one ACL-injured joints had ΔT1 below -0.1s, while all control limbs had ΔT1>-0.1s.
DISCUSSION
Assessment of inflammation in cartilage in vivo is challenging because of its avascular character and thin anatomy (~200μm in rats). We have used a combination of MRI and optical imaging. Optical imaging provides quick assessment of contrast agent elution and can be detected in histology, but has poor in vivo resolution (~2 mm). MRI has resolutions of 50–100μm and excellent contrast to identify cartilage. However, MRI is less sensitive to contrast agents (concentration>50μM) than optical imaging (>50nM). Elution curve identified optimal imaging time to be at least 24h after administration. In vitro experiments have shown that P15-1 forms a stable binding and does not get metabolized.6 ΔT1 is due to accumulation of the contrast agent. The fact that all but one ACL-injured limb showed a decrease bellow -0.1s shows that HA-related inflammation is common.CONCLUSION
This study is the first direct in vivo indication for the involvement of inflammation in cartilage after injury and highlights the potential of molecular imaging applied to PTOA.Acknowledgements
Research reported in this manuscript was supported by the National Institute of Arthritis and Musculoskeletal and Skin Diseases (NIAMS) of the National Institute of Health (NIH) under award numbers R21AR066897 and RO1AR067789. Histopathology studies were partially founded by the NYUCI Center Support Grant NIH/NCI 5 P30CA16087. MRI was partially supported by the Small Animal Imaging Core at NYU School of Medicine. We thank Michael Cammer from NYU Langone’s Microscopy Laboratory. The content is solely the responsibility of the authors and does not necessarily represent the official views of the NIH.References
1 Brown TD, Johnston RC, Saltzman CL, Marsh JL, Buckwalter JA. Posttraumatic osteoarthritis: a first estimate of incidence, prevalence, and burden of disease. J Orthop Trauma. Nov-Dec 2006;20(10):739-744.
2 Olson SA, Horne P, Furman B, et al. The role of cytokines in posttraumatic arthritis. J Am Acad Orthop Surg. 2014;22(1):29-37.
3 Lieberthal J, Sambamurthy N, Scanzello CR. Inflammation in joint injury and post-traumatic osteoarthritis. Osteoarthritis and cartilage / OARS, Osteoarthritis Research Society. 2015;23(11):1825-1834.
4 Furman BD, Mangiapani DS, Zeitler E, et al. Targeting pro-inflammatory cytokines following joint injury: acute intra-articular inhibition of interleukin-1 following knee injury prevents post-traumatic arthritis. Arthritis research & therapy. 2014;16(3):R134.
5Tolg, C. et al. A RHAMM mimetic peptide blocks hyaluronan signaling and reduces inflammation and fibrogenesis in excisional skin wounds. Am J pathology. 2012;181:1250-1270.
6Shortt C, Luyt LG, Turley EA, Cowman MK, Kirsch T. A Hyaluronan-binding Peptide (P15-1) Reduces Inflammatory and Catabolic Events in IL-1β-treated Human Articular Chondrocytes. Scientific Reports. 2020;10(1):1441.
7Boyan BD, Tosi LL, Coutts RD, Enoka RM, Hart DA, Nicolella DP, Berkley KJ, Sluka KA, Kwoh CK, O'Connor MI, Kohrt WM, Resnick E. Addressing the gaps: sex differences in osteoarthritis of the knee. Biology of sex differences. 2013;4(1):4.
8Ramme AJ, Lendhey M, Raya JG, Kirsch T, Kennedy OD. A novel rat model for subchondral microdamage in acute knee injury: a potential mechanism in post-traumatic osteoarthritis. Osteoarthritis and cartilage. 2016;24(10):1776-1785
9Dyment NA, Jiang X, Chen L, Hong SH, Adams DJ, Ackert-Bicknell C, Shin DG, Rowe DW. High-Throughput, Multi-Image Cryohistology of Mineralized Tissues. J Vis Exp. 2016;115. 25.
10Gerwin N, Bendele AM, Glasson S, Carlson CS. The OARSI histopathology initiative - recommendations for histological assessments of osteoarthritis in the rat. Osteoarthritis Cartilage. Oct 2010;18 Suppl 3:S24-34.
Figures