2959
Learned knee cartilage and meniscus shape features are associated with osteoarthritis incidence1University of California, San Francisco, San Francisco, CA, United States
Synopsis
We derive cartilage and meniscus point clouds from 40,796 high resolution knee MR images and train point cloud networks to extract osteoarthritis shape features. We demonstrate the utility of these learned features by assessing their relative contributions in a Cox Proportional Hazard Regression model with existing clinical risk factors predicting incident radiographic osteoarthritis. Shape biomarkers for tibiofemoral joint cartilage and menisci had significantly increased hazard ratios. The best performing shape biomarker– tibial and femoral cartilage shape– combined with clinical risk factors achieved a concordance index of 0.759. Our findings suggest point cloud learned shape features are promising OA biomarkers.
Introduction
Osteoarthritis (OA) is a painful, whole joint disease responsible for over $15 billion in direct healthcare costs annually in the United States. Greater understanding of modifiable and non-modifiable OA risk factors is needed to improve preventative care. Several studies have reported distinct cartilage thickness patterns [1,2] and meniscal shapes [3,4] across subjects with increasing disease severity. While these studies have successfully identified morphological features associated with current OA, less research exists on identifying morphological features that could be risk factors for future OA or indications of preclinical OA. In this work, we parametrize knee cartilage and menisci as sparse point clouds, learn OA shape features directly from these points sets, and use output probabilities in Cox Proportional Hazard (PH) regression models for OA incidence. We achieve a c-index of up to 0.759 when the femoral-tibial cartilage shape feature is combined with clinical risk factors.Methods
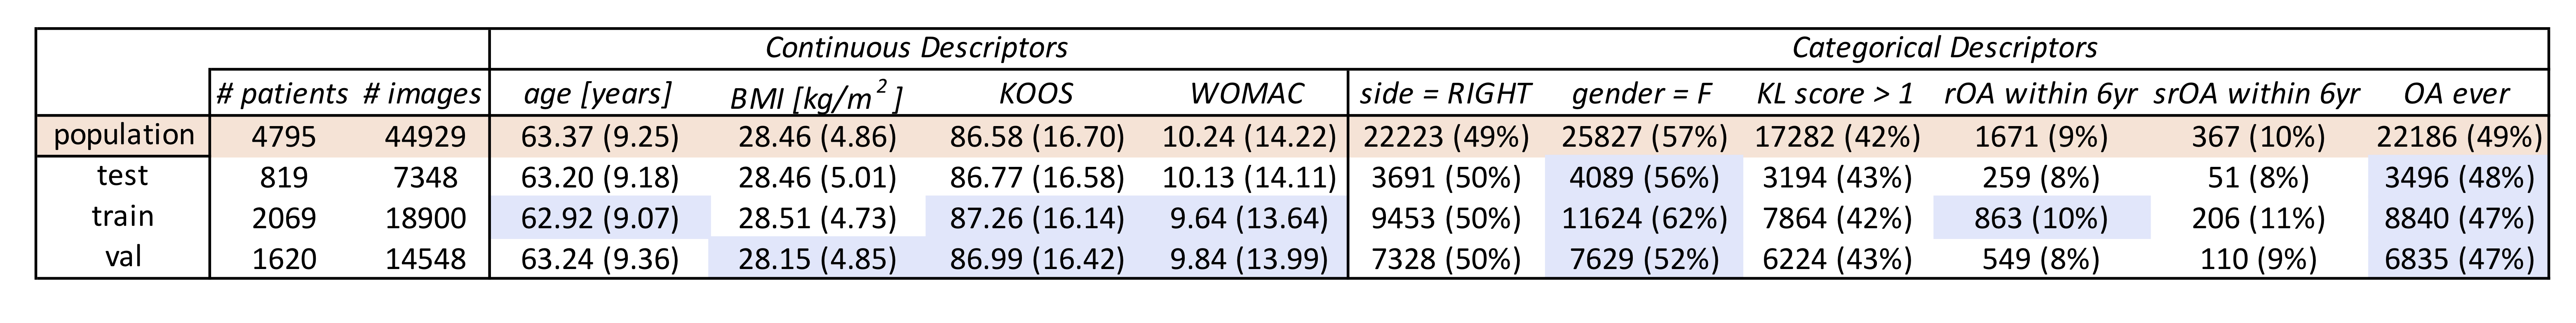
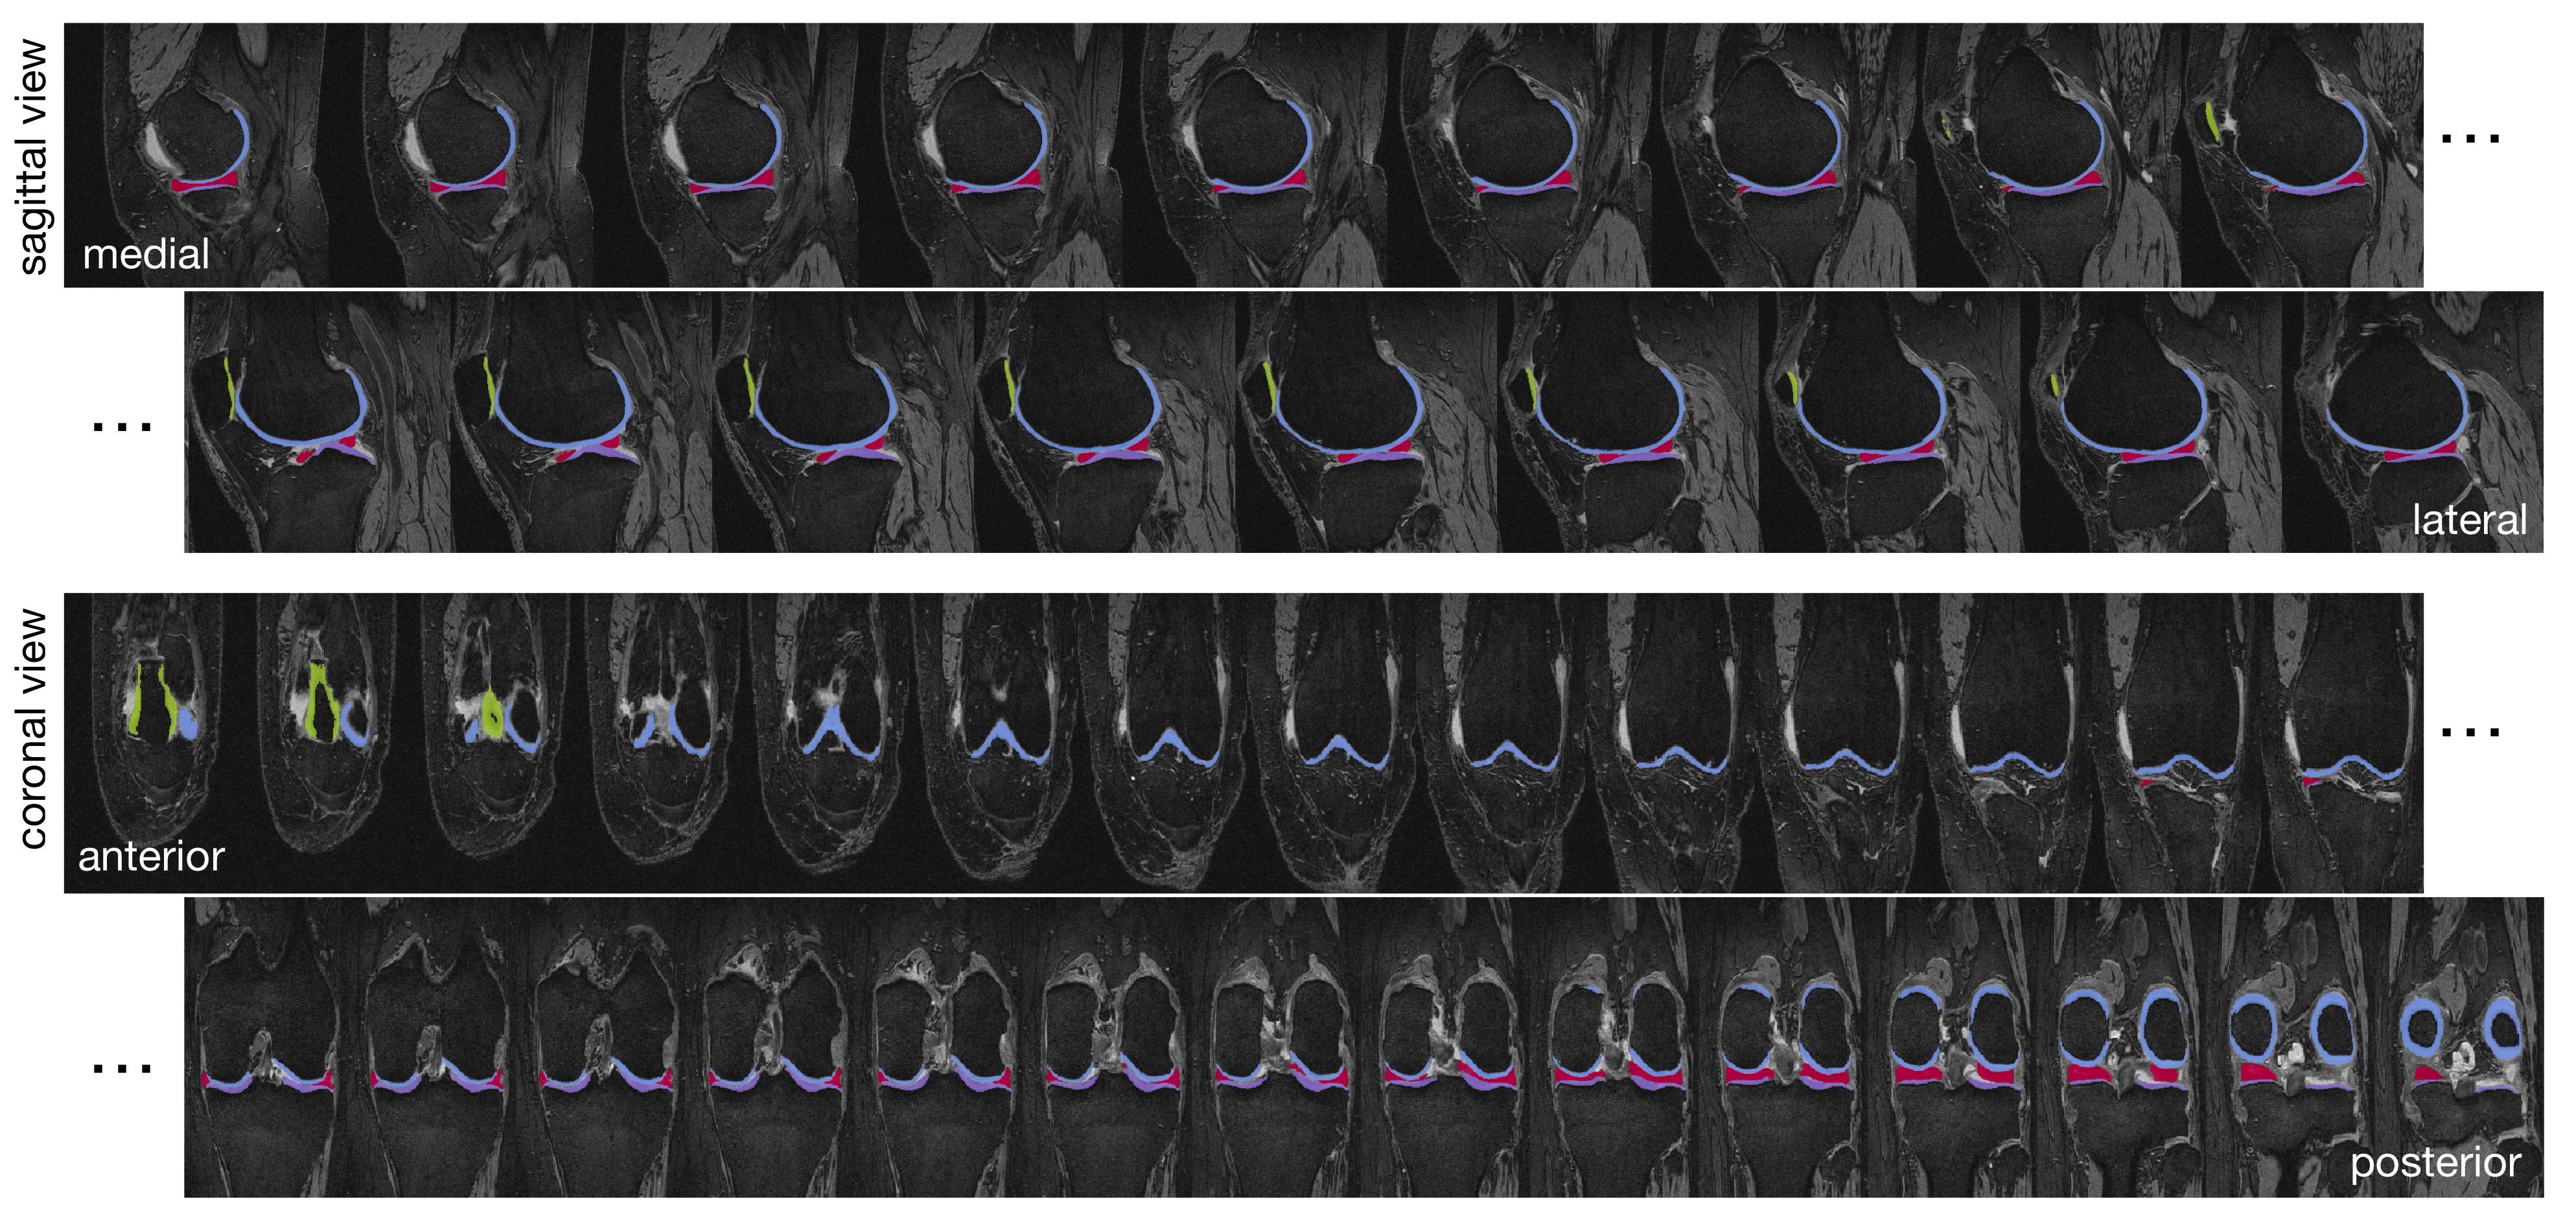
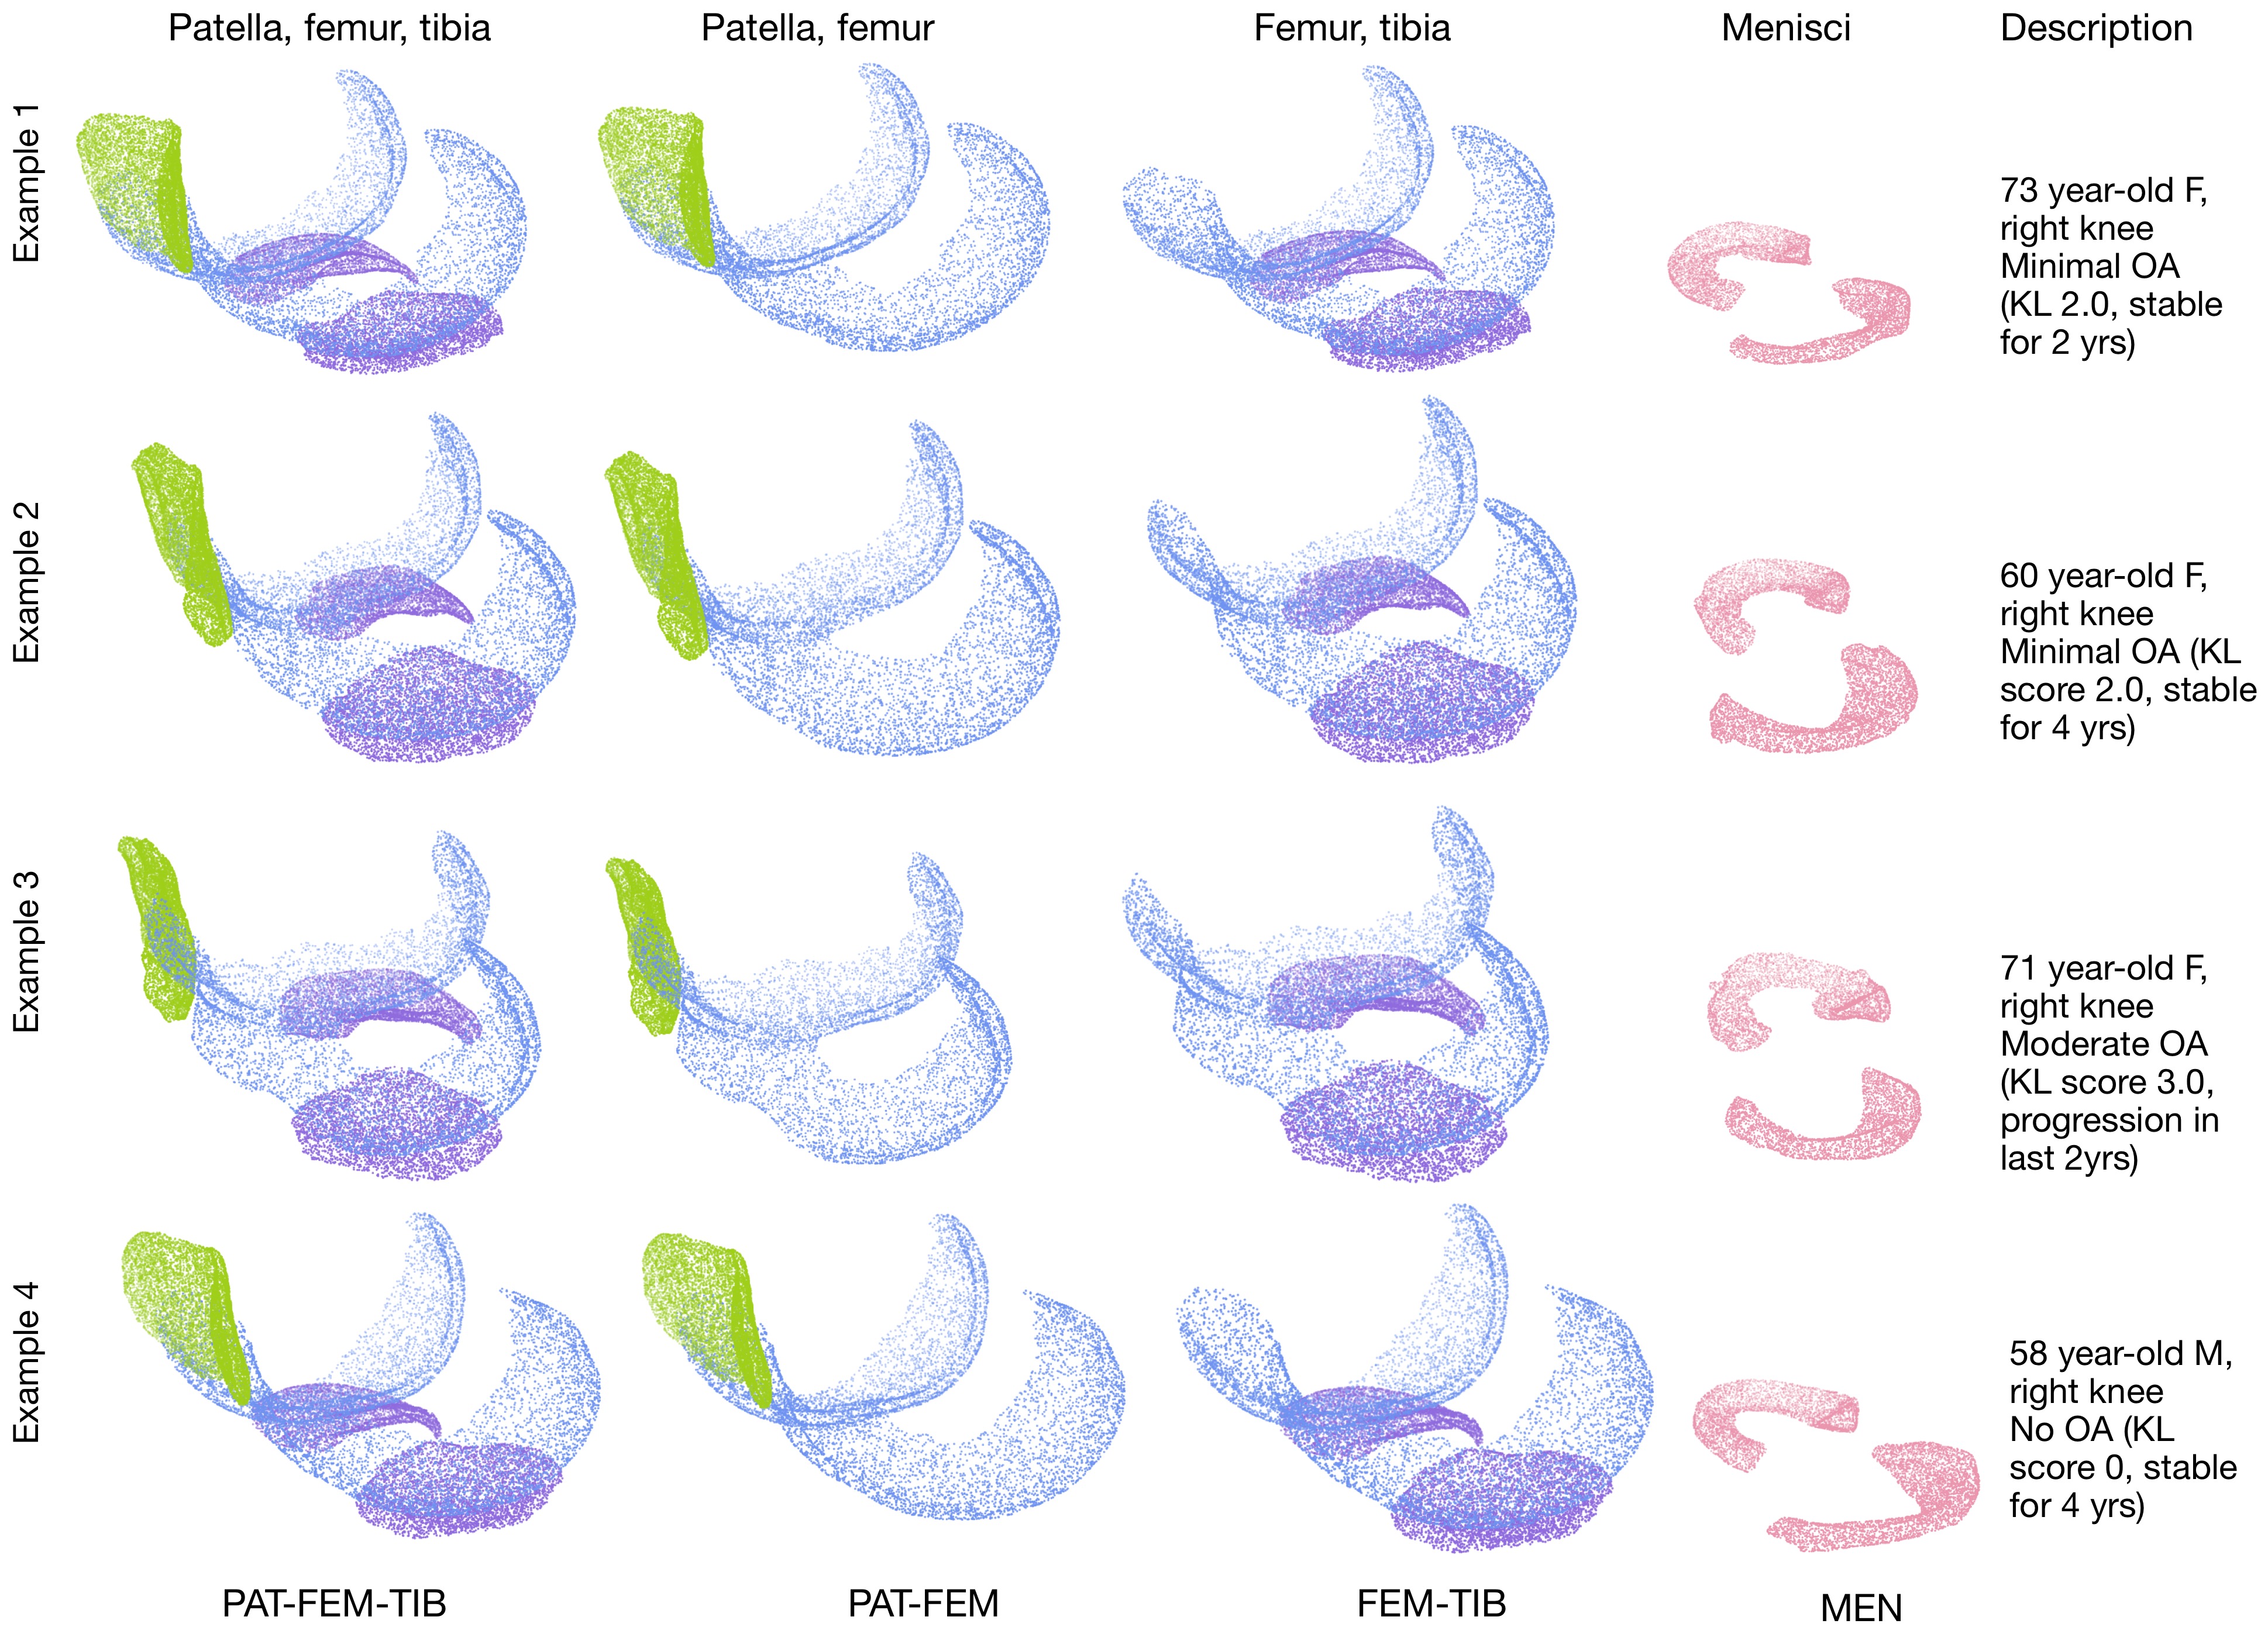
4,508 subjects in the Osteoarthritis Initiative dataset with valid Kellgren-Lawrence (KL) grades and MR images, were split into train/val/test (46%,36%,18%) roughly stratified by demographics and outcomes, dataset description in Figure1. MR imaging parameters and segmentation network details in [5]. Briefly: a hybrid 2D/3D neural network ensemble achieved a test time Dice score (std) of 0.890(0.023) femoral, 0.880(0.036) tibial, and 0.850(0.068) patellar cartilage, and menisci 0.874(0.024). Inference was run on the Double-Echo-Steady-State (DESS) sequence for all subjects, example segmentation overlays in Figure2. Cartilage and menisci point clouds were created using marching cubes and random mesh sampling of 8192 points per tissue. Point clouds were selected as lightweight, permutation invariant representations of tissues without requiring point-to-point correspondence. Shape features were learned from four unique point cloud sets: PAT-FEM-TIB, PAT-FEM, FEM-TIB, and MEN (Figure3) composed of patella (PAT), femoral cartilage (FEM), tibial cartilage (TIB) and menisci (MEN). Each point cloud set was zero centered and -1 to 1 normalized. A PointNet++like network architecture (LSAnet[6,7] 2.3M parameters) with attention layers for geometric encoding was trained for each set: batch size 20, learning rate 0.001, class weighted cross entropy with 0.2 label smoothing, for 20 epochs on NVIDIA-V100-32GB-GPU. Diagnosis of current radiographic OA (KL score>=2) was defined as the pretext task for learning OA related shape features. Mathews Correlation Coefficient was used to monitor network validation and select the highest performing checkpoint at test time. From the test set, patients without radiographic OA at baseline were selected for regression, extracting right censored time-to-event data for radiographic OA incidence (860 observations, 103 events). Model concordance index is compared between a baseline clinical Cox PH model and four models each including a different point cloud combination to investigate added value for each shape biomarker (p(OA) of point cloud model).Results
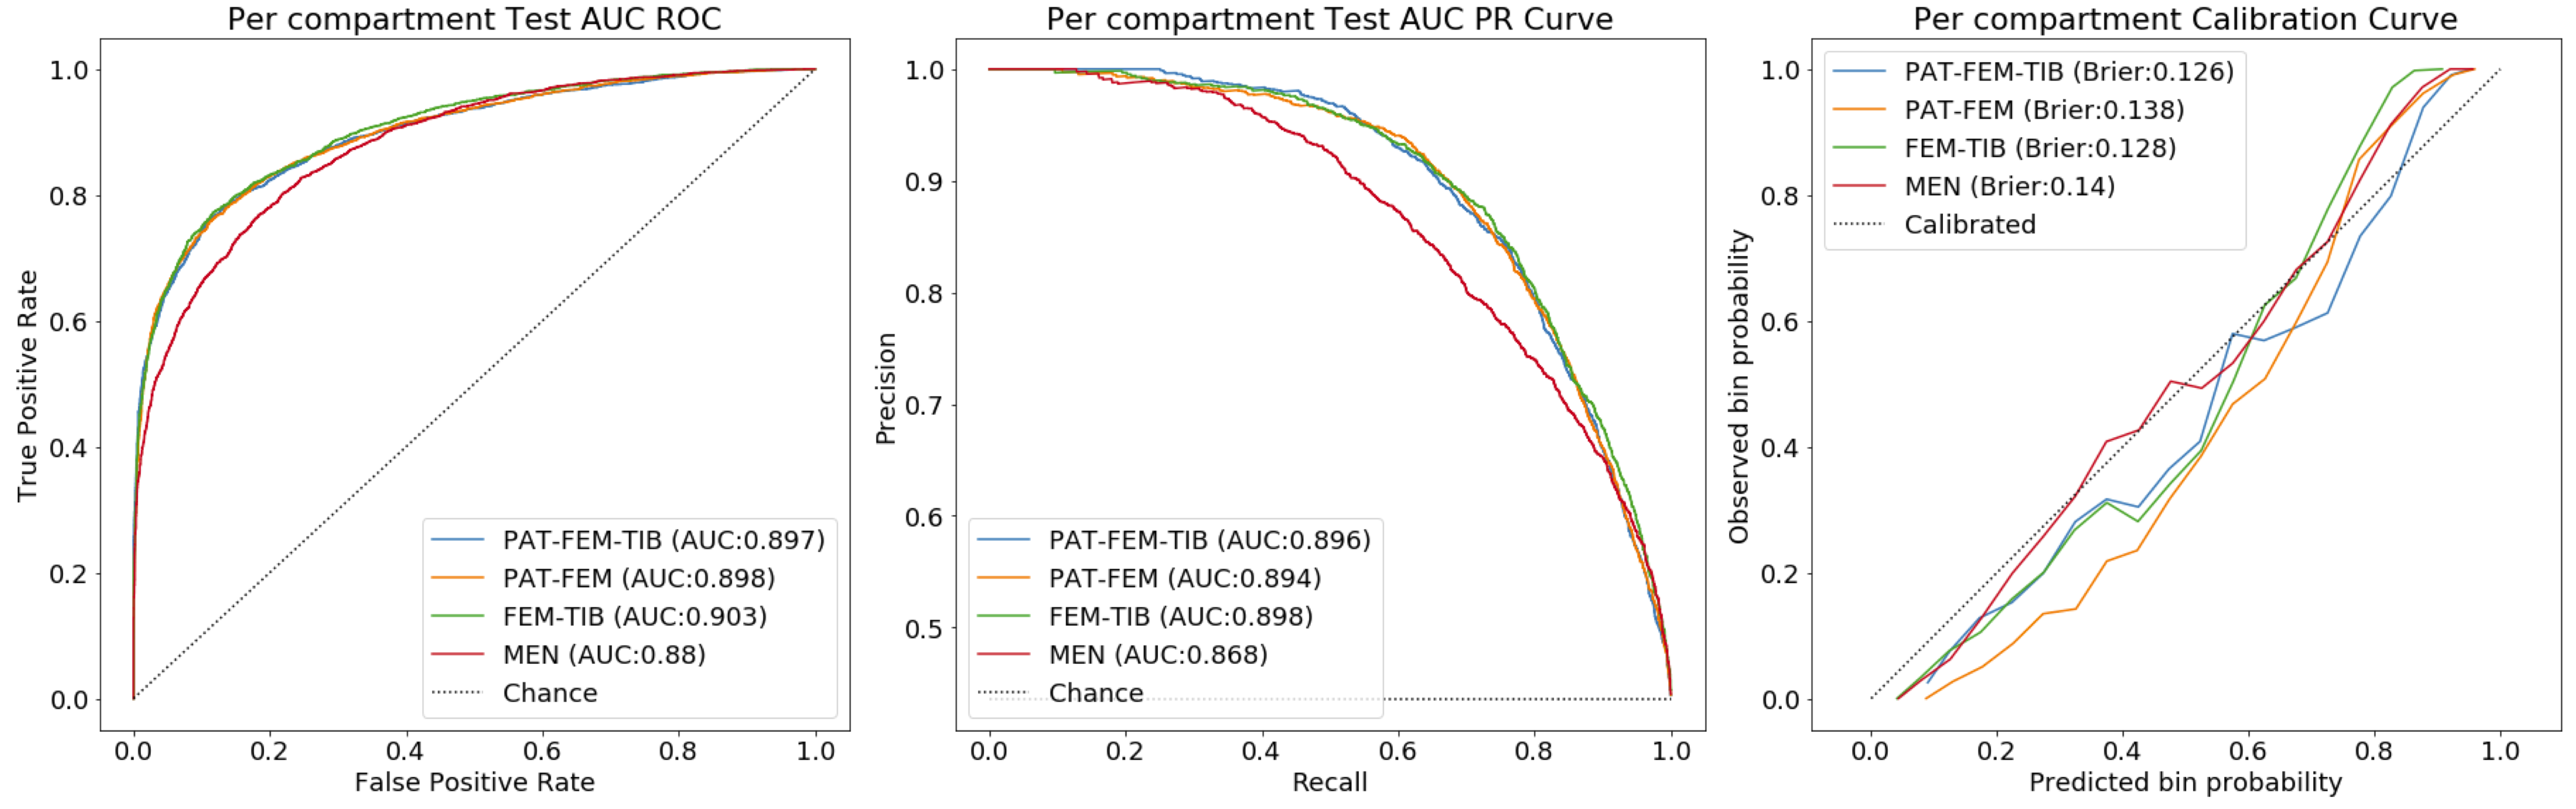
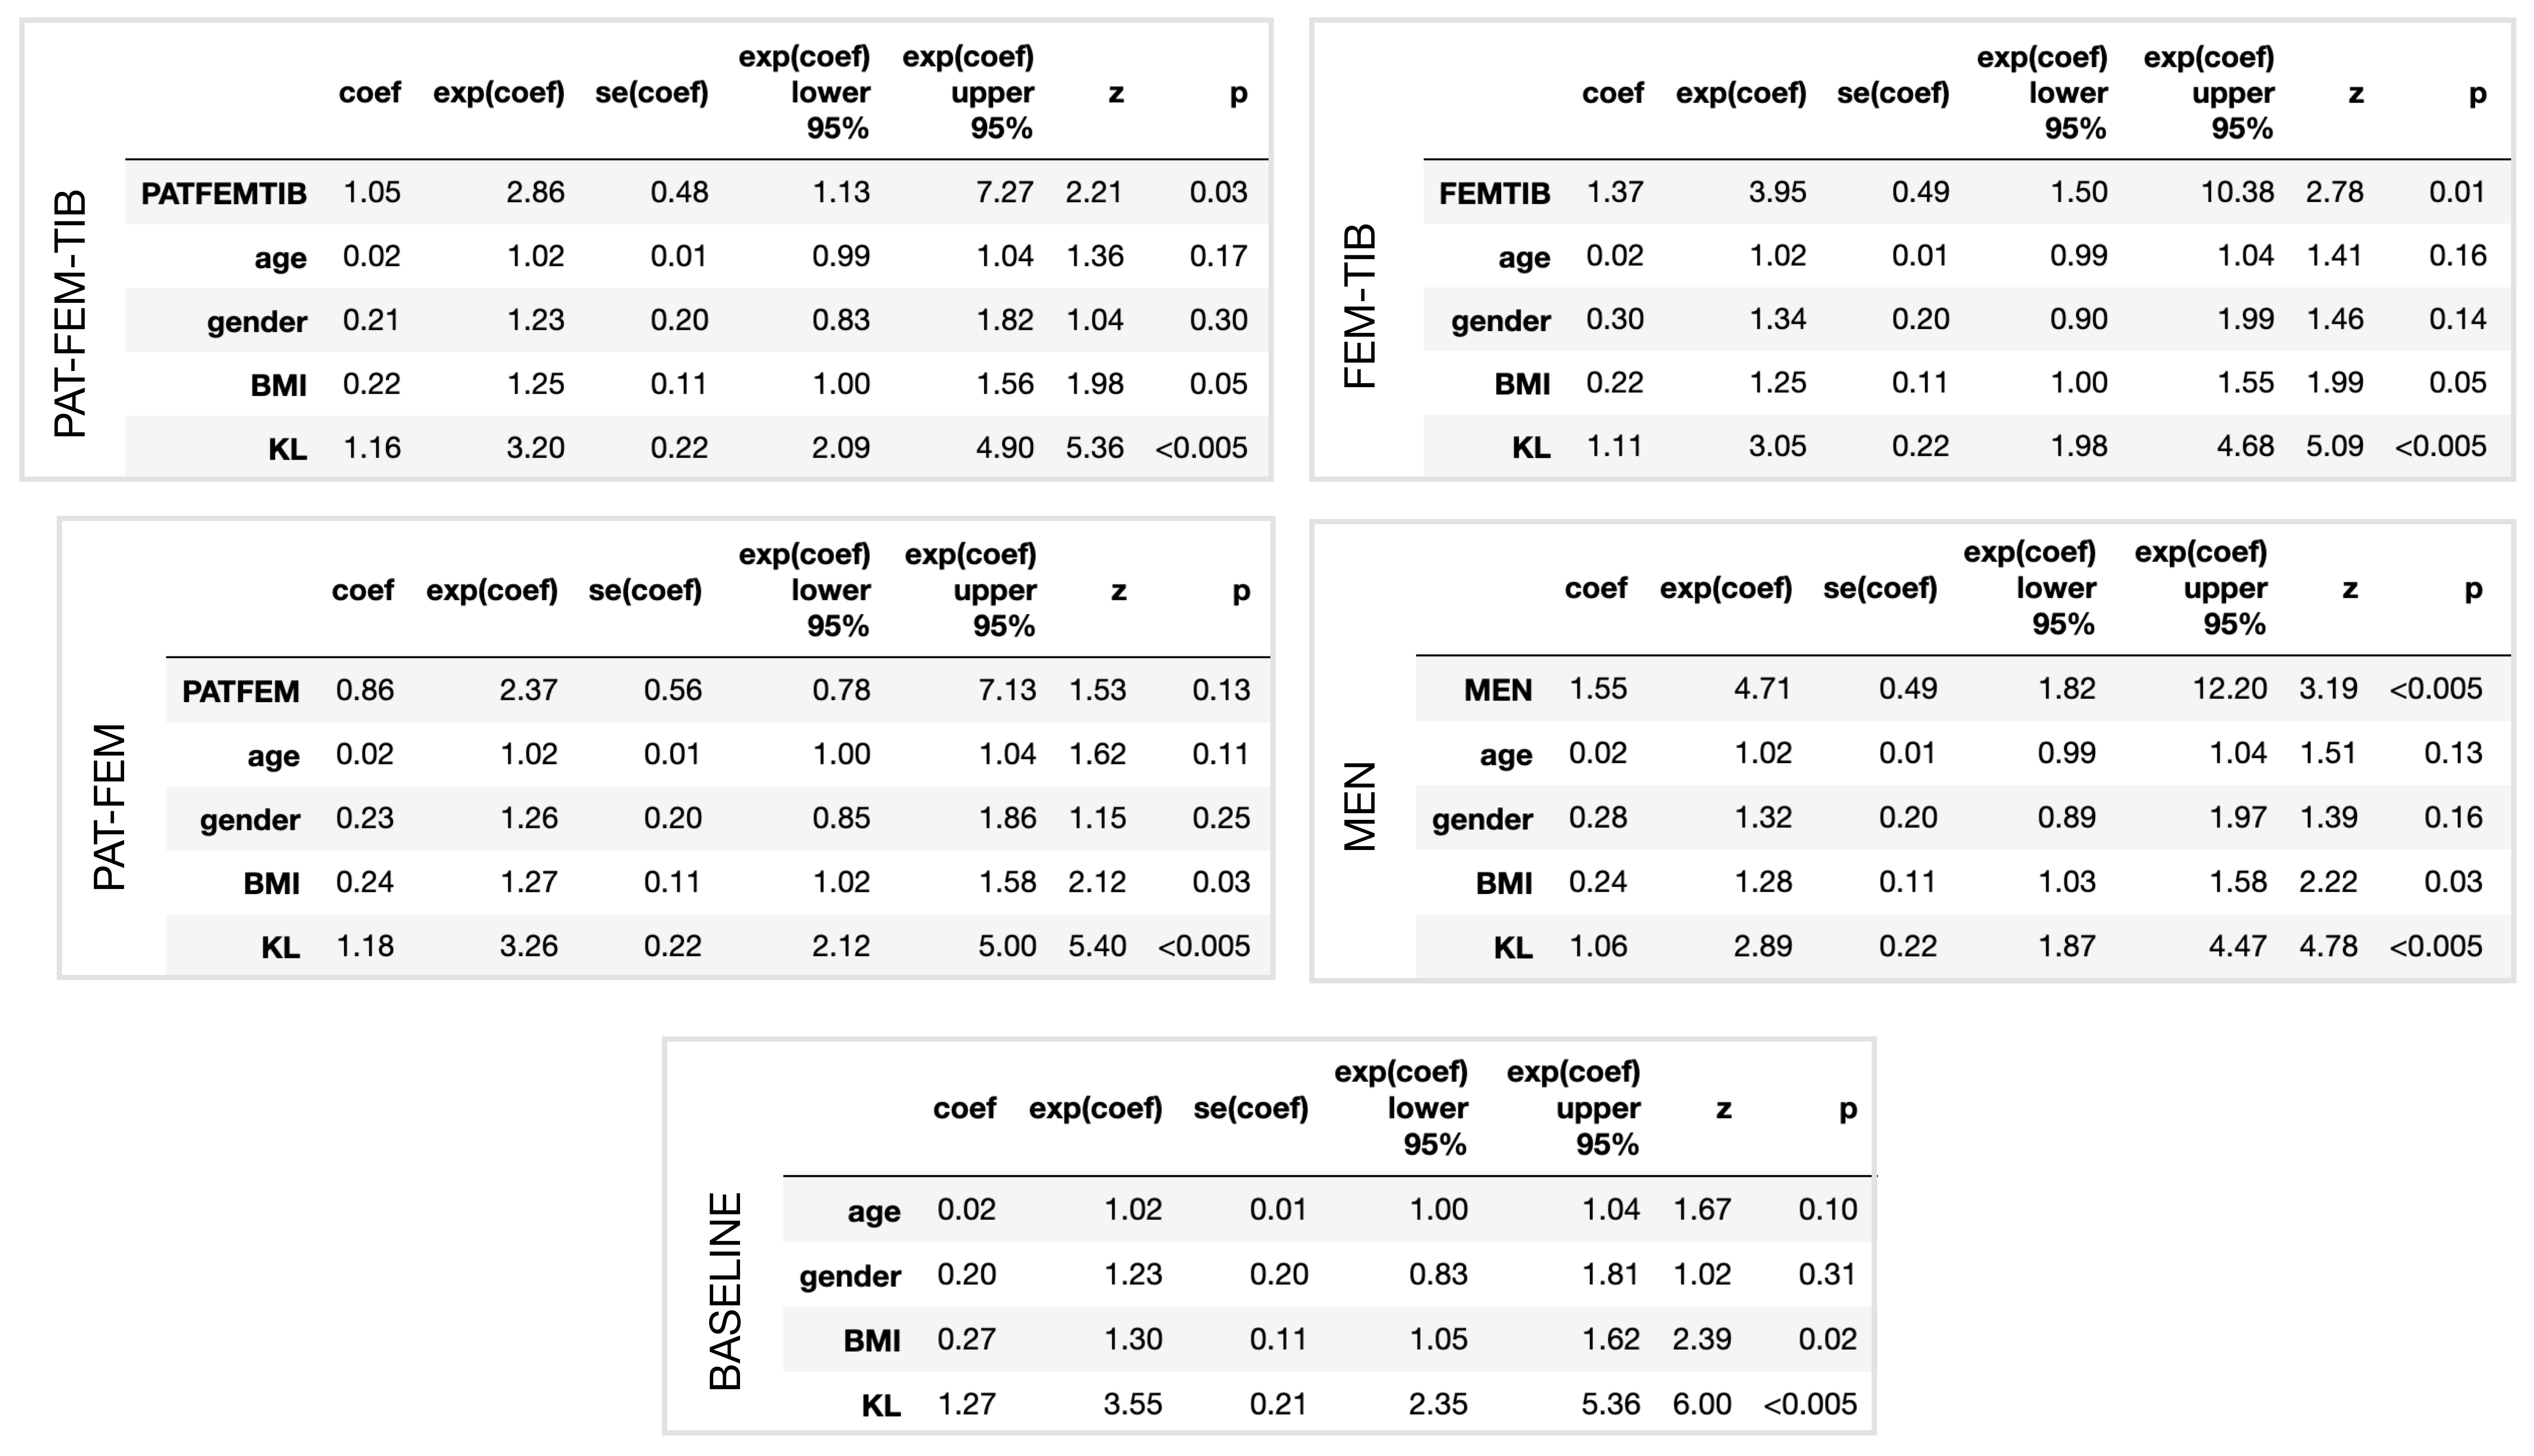
Pretext task performance is visualized in Figure4. FEM-TIB/PAT-FEM/PAT-FEM-TIB show comparable test ROC AUC values: 0.903/0.898/0.897 respectively, while MEN is lower at 0.88. Similarly, the PR curve AUC values are 0.898/0.894/0.896 and 0.868 for MEN. Test calibration curves for these models highlight differences. Label smoothing was used during model training to encourage learning calibrated outputs and prevent overconfident predictions: predicted probability of OA should reflect the actual probability of sample OA. PAT-FEM-TIB was the best calibrated, followed by FEM-TIB, PAT-FEM, and MEN (Brier scores of 0.126, 0.128, 0.138, 0.14). As a group, the cartilage model predictions between 0.2 and 0.7 overestimated probability of OA while >0.7 underestimated the probability of OA, while MEN calibration did not show a consistent trend. Baseline Cox PH Regression with age, gender, BMI category, and KL score resulted in a c-index of 0.742, while the addition of each shape biomarker increased c-index to 0.752-0.759. Age and gender coefficients were not significant in any of the models. All shape biomarkers except PAT-FEM were significant, with hazard ratios (95%CI) for PAT-FEM-TIB of 2.86(1.13, 7.27), FEM-TIB 3.95(1.50, 10.4), and MEN 4.71(1.82, 12.2). Tabulated Cox PH model results in Figure5.Discussion
Time-to-event analysis with Cox PH Regression allowed for modeling of radiographic OA incidence while accounting for right censored subject data (either due to drop-out or completion of the OAI study period). Interestingly, PAT-FEM-TIB had the greatest number of points in the point cloud (24576 total) and the most information on knee joint positioning (patella-femur, femur-tibia), yet it did not encode shape features that outperformed FEM-TIB or MEN. Since KL grading assesses tibiofemoral joint space narrowing and osteophyte formation using bilateral frontal xrays, it is possible that the pretext task of current radiographic OA diagnosis resulted in networks that overly emphasized this region. We also observe that MEN network was less effective at the pretext task but had the highest hazard ratio for incident OA, suggesting that high pretext task performance is not a necessary condition for meaningful feature encoding. Overall, our results support existing literature on shape differences between healthy and OA tissues, while demonstrating the potential of point cloud shape feature learning.Conclusion
Point cloud learned shape features are promising biomarkers for incident radiographic OA, even after adjustment for clinical risk factors. Shape biomarkers for tibiofemoral joint cartilage and menisci had significantly increased hazard ratios for incident radiographic OA. Future work will focus on shape feature interpretability and validating performance on external datasets, with particular interest on predicting incidence in high risk groups.Acknowledgements
R01AR069006 R00AR070902 R61AR073552References
[1] Favre, J., Erhart‐Hledik, J. C., Blazek, K., Fasel, B., Gold, G. E., & Andriacchi, T. P. (2017). Anatomically standardized maps reveal distinct patterns of cartilage thickness with increasing severity of medial compartment knee osteoarthritis. Journal of orthopaedic research, 35(11), 2442-2451.
[2] Eckstein, F., Collins, J. E., Nevitt, M. C., Lynch, J. A., Kraus, V. B., Katz, J. N., ... & Hunter, D. J. (2015). Brief report: cartilage thickness change as an imaging biomarker of knee osteoarthritis progression: data from the Foundation for the National Institutes of Health Osteoarthritis Biomarkers Consortium. Arthritis & rheumatology, 67(12), 3184-3189.
[3] Emmanuel, K., Quinn, E., Niu, J., Guermazi, A., Roemer, F., Wirth, W., ... & Felson, D. (2016). Quantitative measures of meniscus extrusion predict incident radiographic knee osteoarthritis–data from the Osteoarthritis Initiative. Osteoarthritis and cartilage, 24(2), 262-269.
[4] Wenger, A., Wirth, W., Hudelmaier, M., Noebauer‐Huhmann, I., Trattnig, S., Bloecker, K., ... & Englund, M. (2013). Meniscus body position, size, and shape in persons with and persons without radiographic knee osteoarthritis: quantitative analyses of knee magnetic resonance images from the osteoarthritis initiative. Arthritis & Rheumatism, 65(7), 1804-1811.
[5] Iriondo, C., Liu, F., Calivà, F., Kamat, S., Majumdar, S., & Pedoia, V. (2020). Towards understanding mechanistic subgroups of osteoarthritis: 8‐year cartilage thickness trajectory analysis. Journal of Orthopaedic Research®.
[6] Qi, C. R., Yi, L., Su, H., & Guibas, L. J. (2017). Pointnet++: Deep hierarchical feature learning on point sets in a metric space. Advances in neural information processing systems, 30, 5099-5108.
[7] Chen, L. Z., Li, X. Y., Fan, D. P., Wang, K., Lu, S. P., & Cheng, M. M. (2019). Lsanet: Feature learning on point sets by local spatial aware layer. arXiv preprint arXiv:1905.05442.
Figures