2958
Disruption of collagen fiber architecture after DMM surgery using high-resolution DTI1Radiology and Imaging Sciences, Indiana University, Indianapolis, IN, United States, 2Department of Orthopaedic Surgery, Duke University, Durham, NC, United States, 3Department of Radiology, Duke University, Durham, NC, United States
Synopsis
Nondestructively probing the 3D collagen fiber architecture of articular cartilage is still challenging for both clinical and preclinical studies. Diffusion tensor imaging (DTI) is able to resolve the collagen fiber directions by quantifying the unique water diffusion properties in soft tissues. Applying DTI and tractography in cartilage is limited but may provide noninvasive imaging biomarkers for Osteoarthritis (OA). In this study we imaged rat knees after 8 weeks destabilization of the medial meniscus (DMM) surgery using a modified 3D diffusion-weighted spin-echo pulse sequence at both high spatial resolution and high angular resolution.
Purpose
To evaluate the 3D collagen fiber disruption after DMM surgery using diffusion tractography.Introduction
Osteoarthritis (OA) is the most common joint disorder and a leading cause of disability in the United States, affecting about 30.8 million population1. Before the earliest clinical diagnosis of OA, a series of complex events at various molecular and structural levels has already taken inside different depth of the articular cartilage. Preclinical studies of different animal OA models are particularly crucial in understanding evolution in disease models and efficacy of experimental drugs. DTI of the knee joint is technically challenging due to the magic angle effect, complex anatomy, short T2 relaxation times, and the presence of multiple tissue types2,3. Recently, tractography has been successfully performed in ligament, tendon, cartilage, and growth plate. However, whether tractography can be used to detect the cartilage 3D collagen fiber architecture change after OA is still unknown.Methods
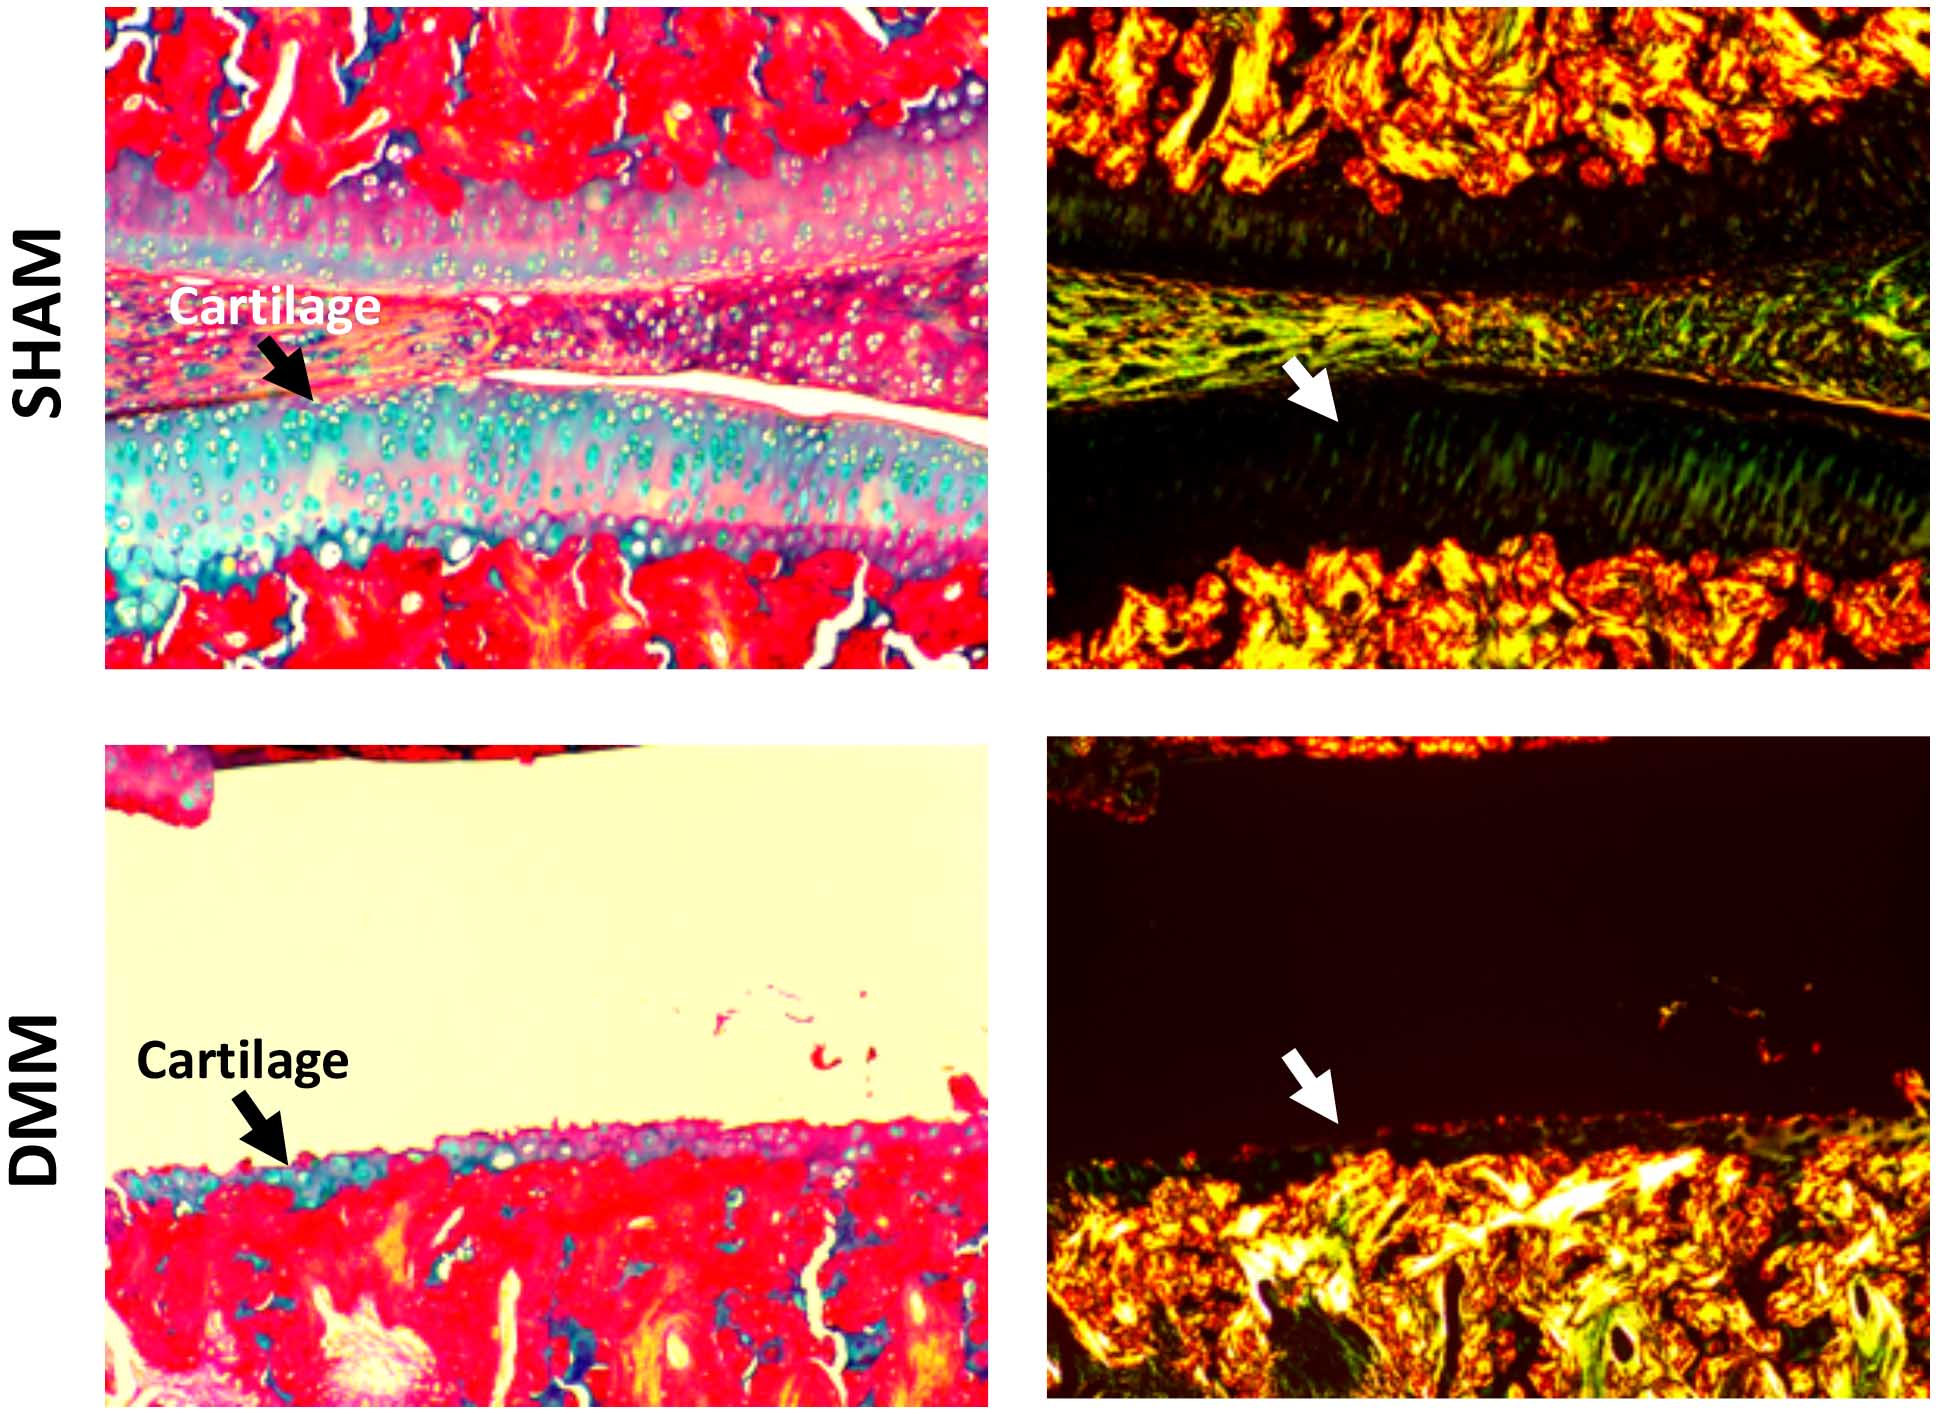
Animal experiments were carried out in compliance with the Duke University Institutional Animal Care and Use Committee. The destabilization of the medial meniscus (DMM) surgery was performed on the adult rats at the age of 12 weeks. Animals were sacrificed and perfusion fixed with a 1:10 mixture of ProHance-buffered formalin. The knee joints (DMM and SHAM) were immersed in buffered formalin for 24 hours and then moved to a 1:200 solution of ProHance/saline to shorten T1 and reduce the scan time. The specimens were scanned at 9.4 T (Oxford 8.9-cm vertical bore) with maximum gradient strength of 2000 mT/m on each axis. A modified 3D Stejskal-Tanner diffusion-weighted (DW) spin-echo pulse sequence was performed by fully sampling the readout dimension and undersampling the phase dimensions by 8 times. Scan parameters were as follows: matrix size = 420 × 256 × 256, FOV = 18.9 × 11.52 × 11.52 mm3, TE = 7.6 ms, TR = 100 ms, 43 unique diffusion directions with a b value of 1000 s/mm2 and 4 non-diffusion-weighted (b0) measurements. CS reconstruction was applied to the under sampled k-space data as described in previous studies4,5. The DTI model was used to calculate the tensor and tractography using DSI studio software5. After microscopic MRI, histological slices were stained for Alcian blue/Picrosirius red staining and polarized light microscopy (PLM) imaging6.Results
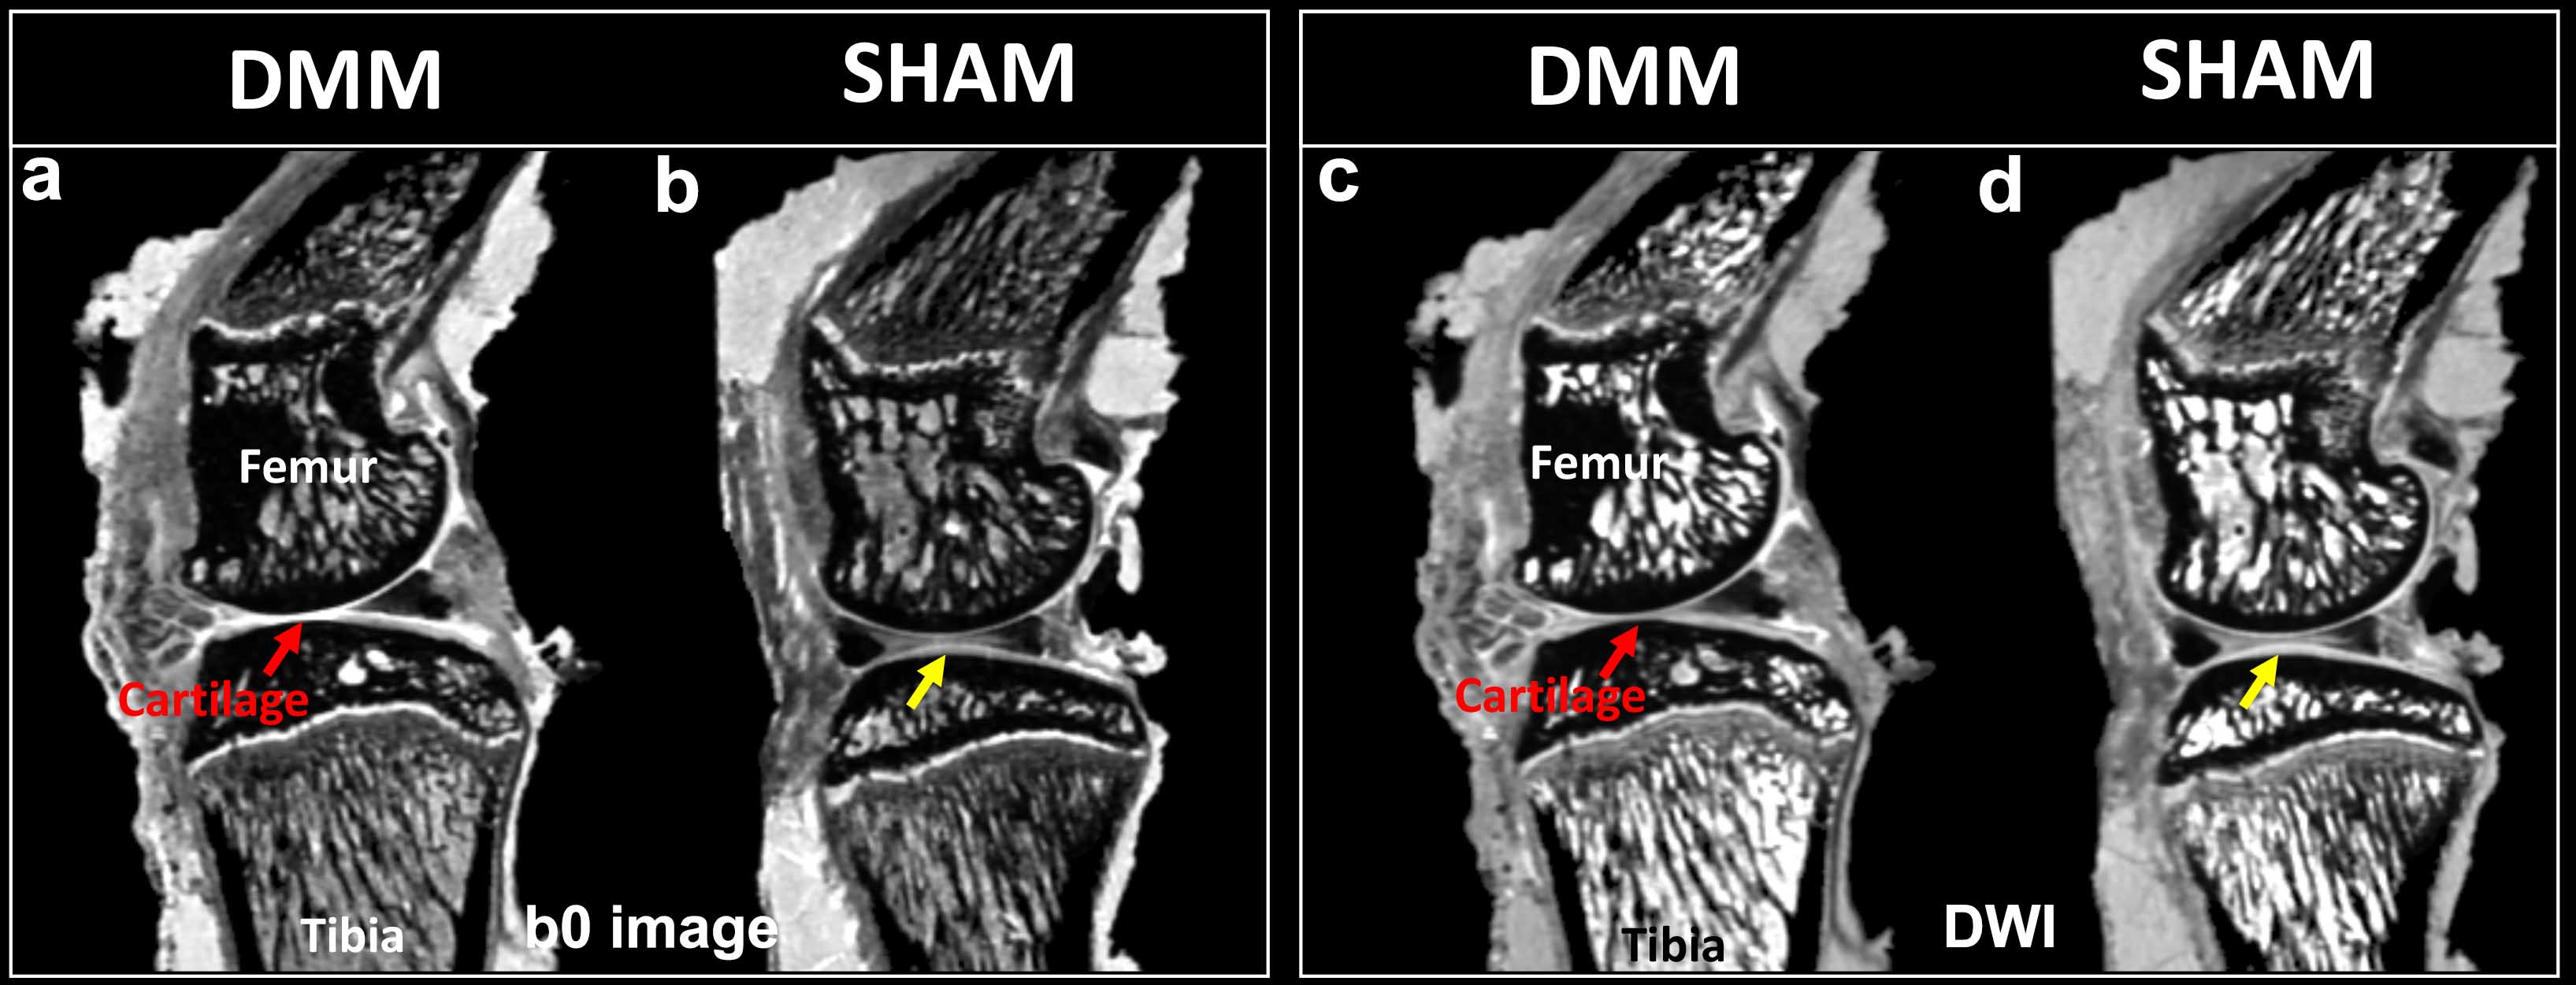
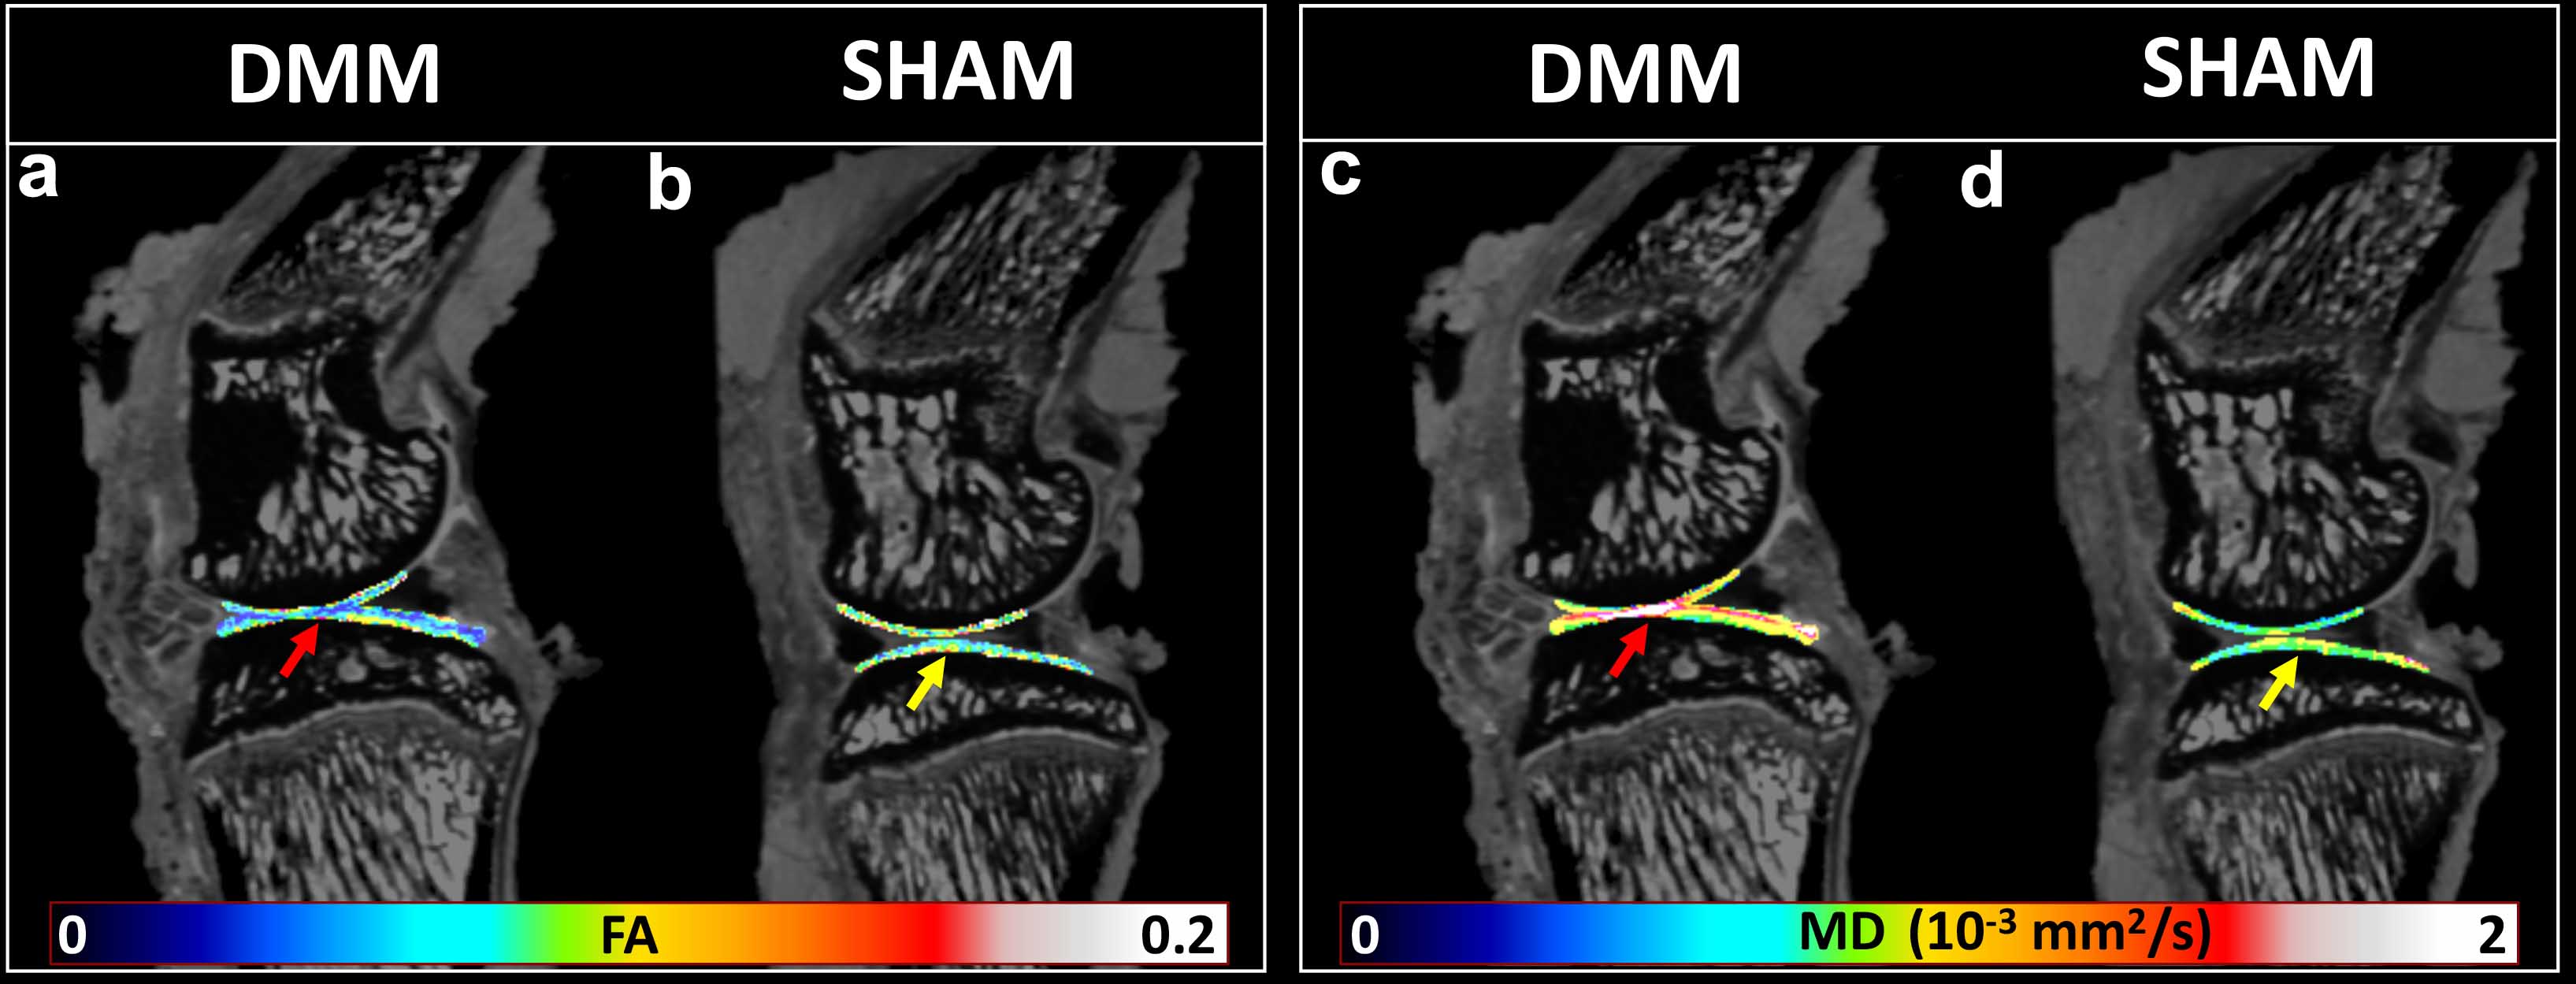
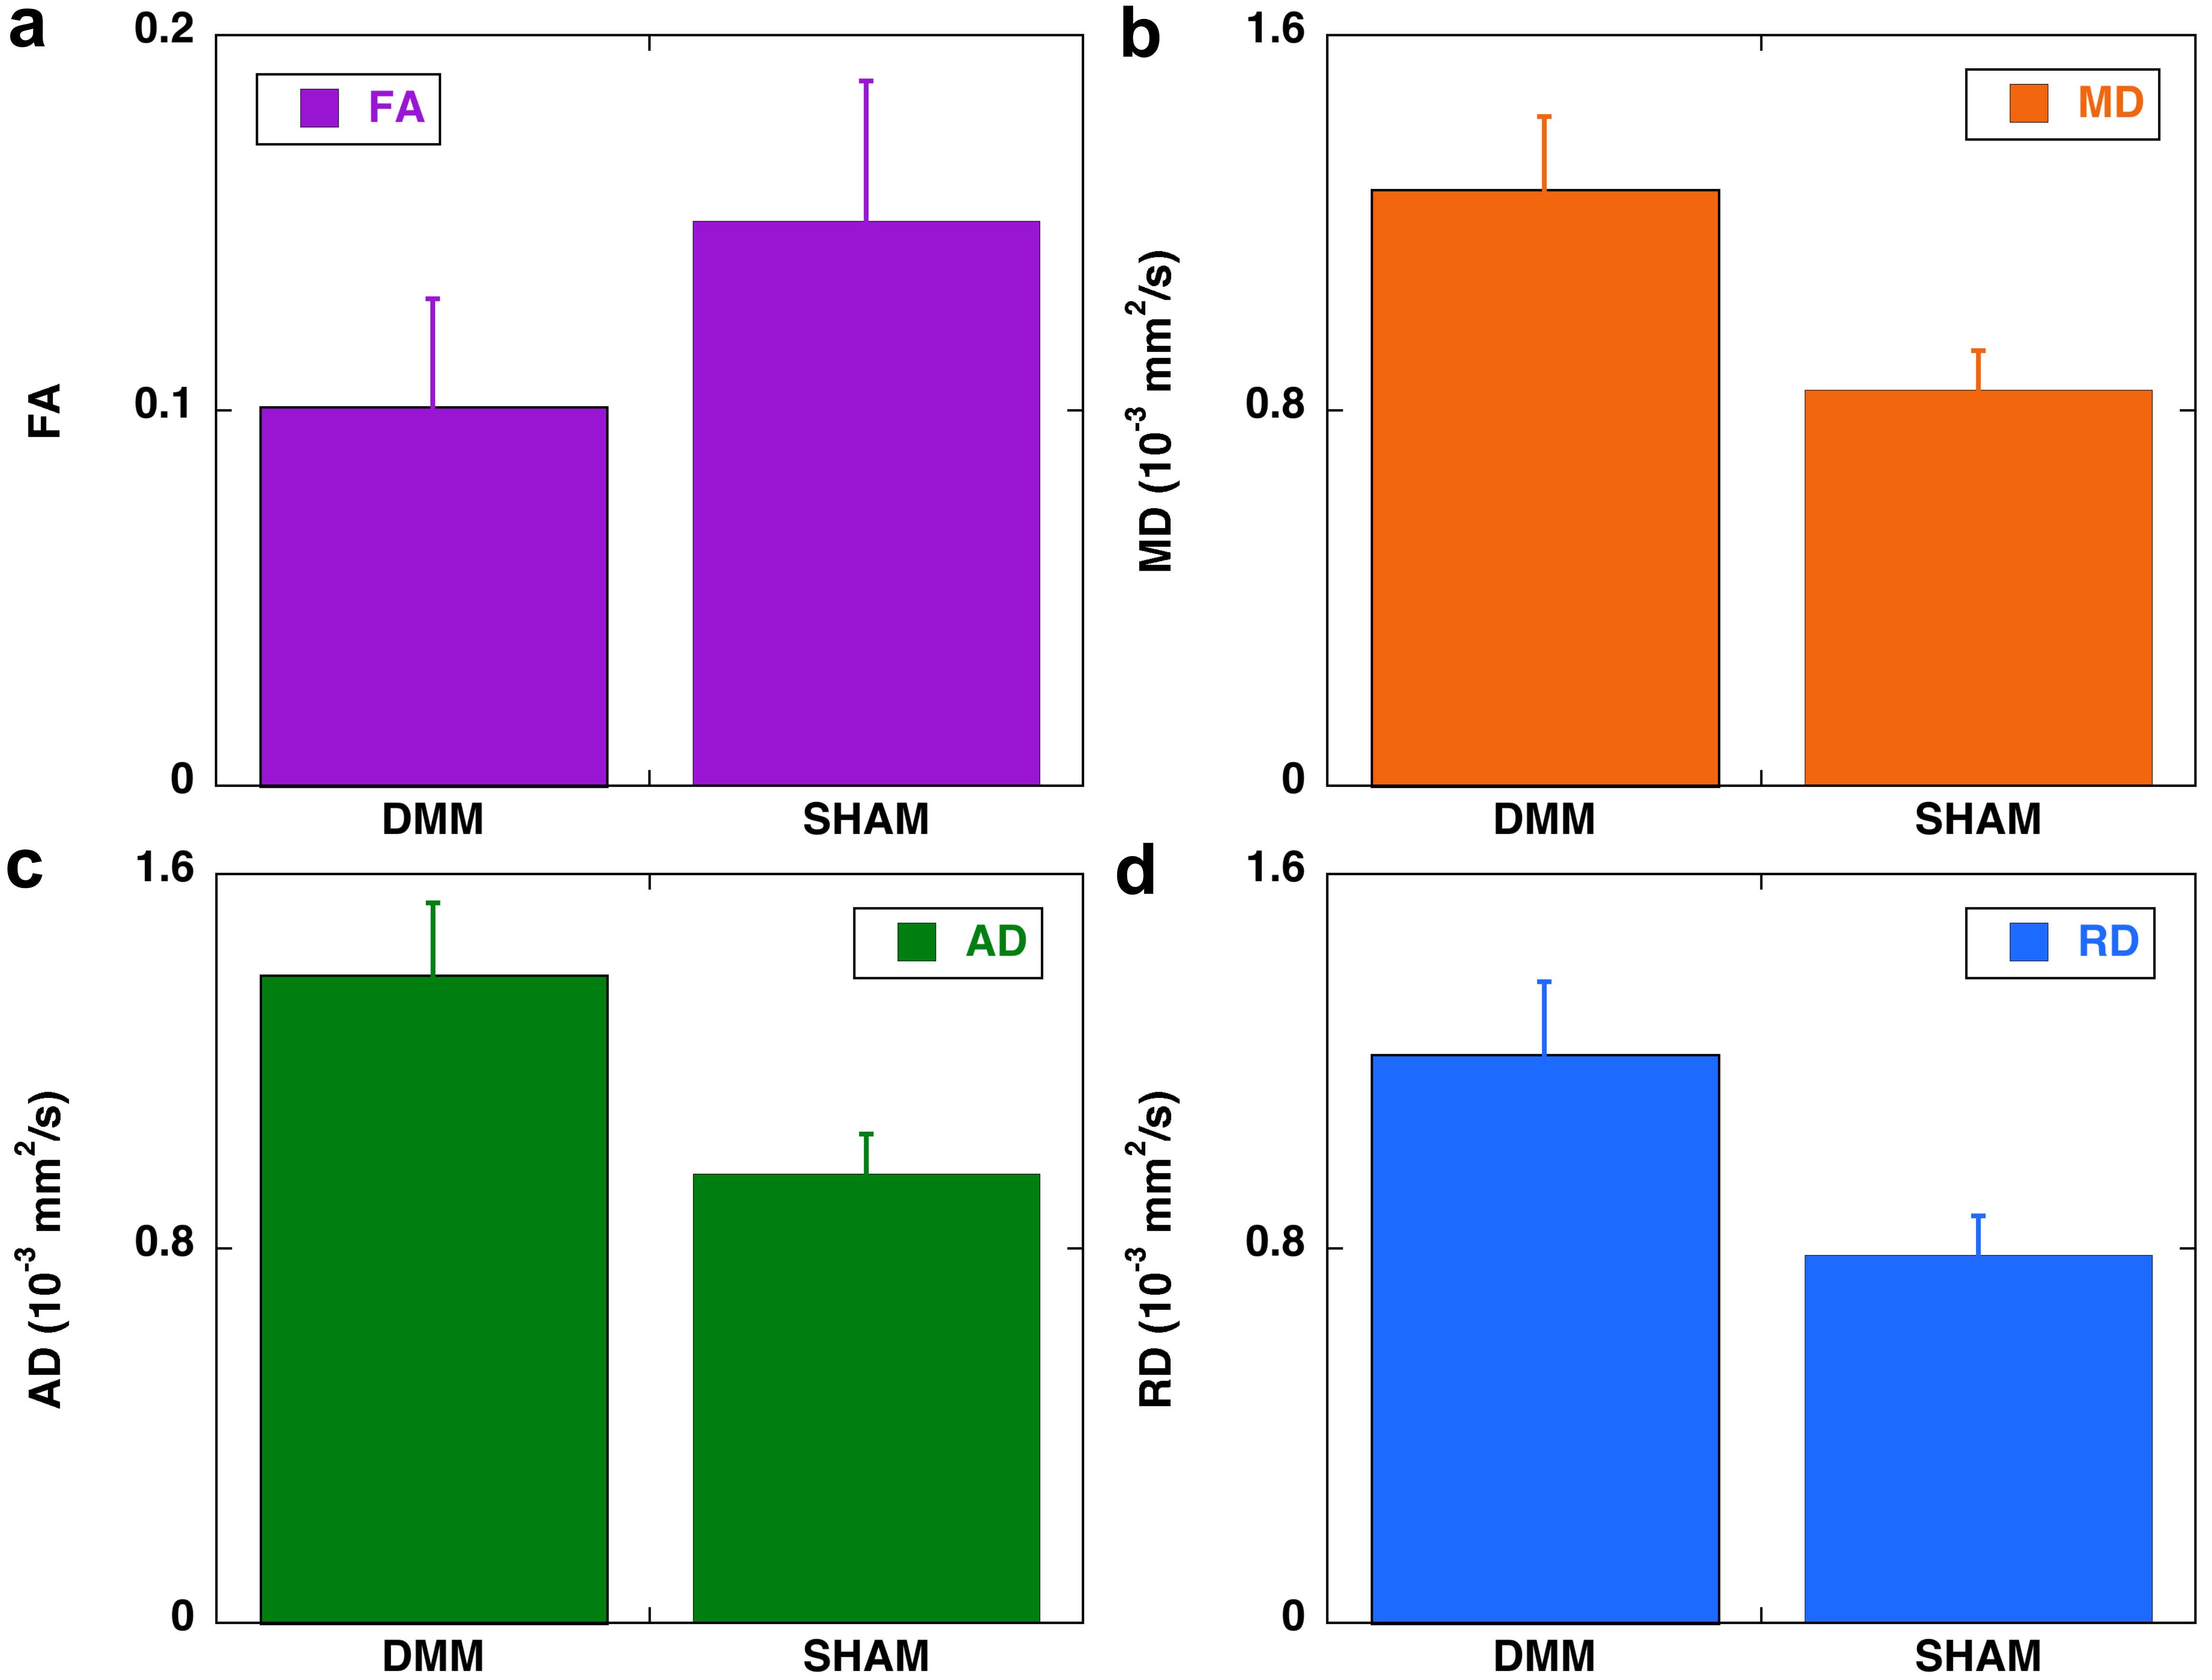
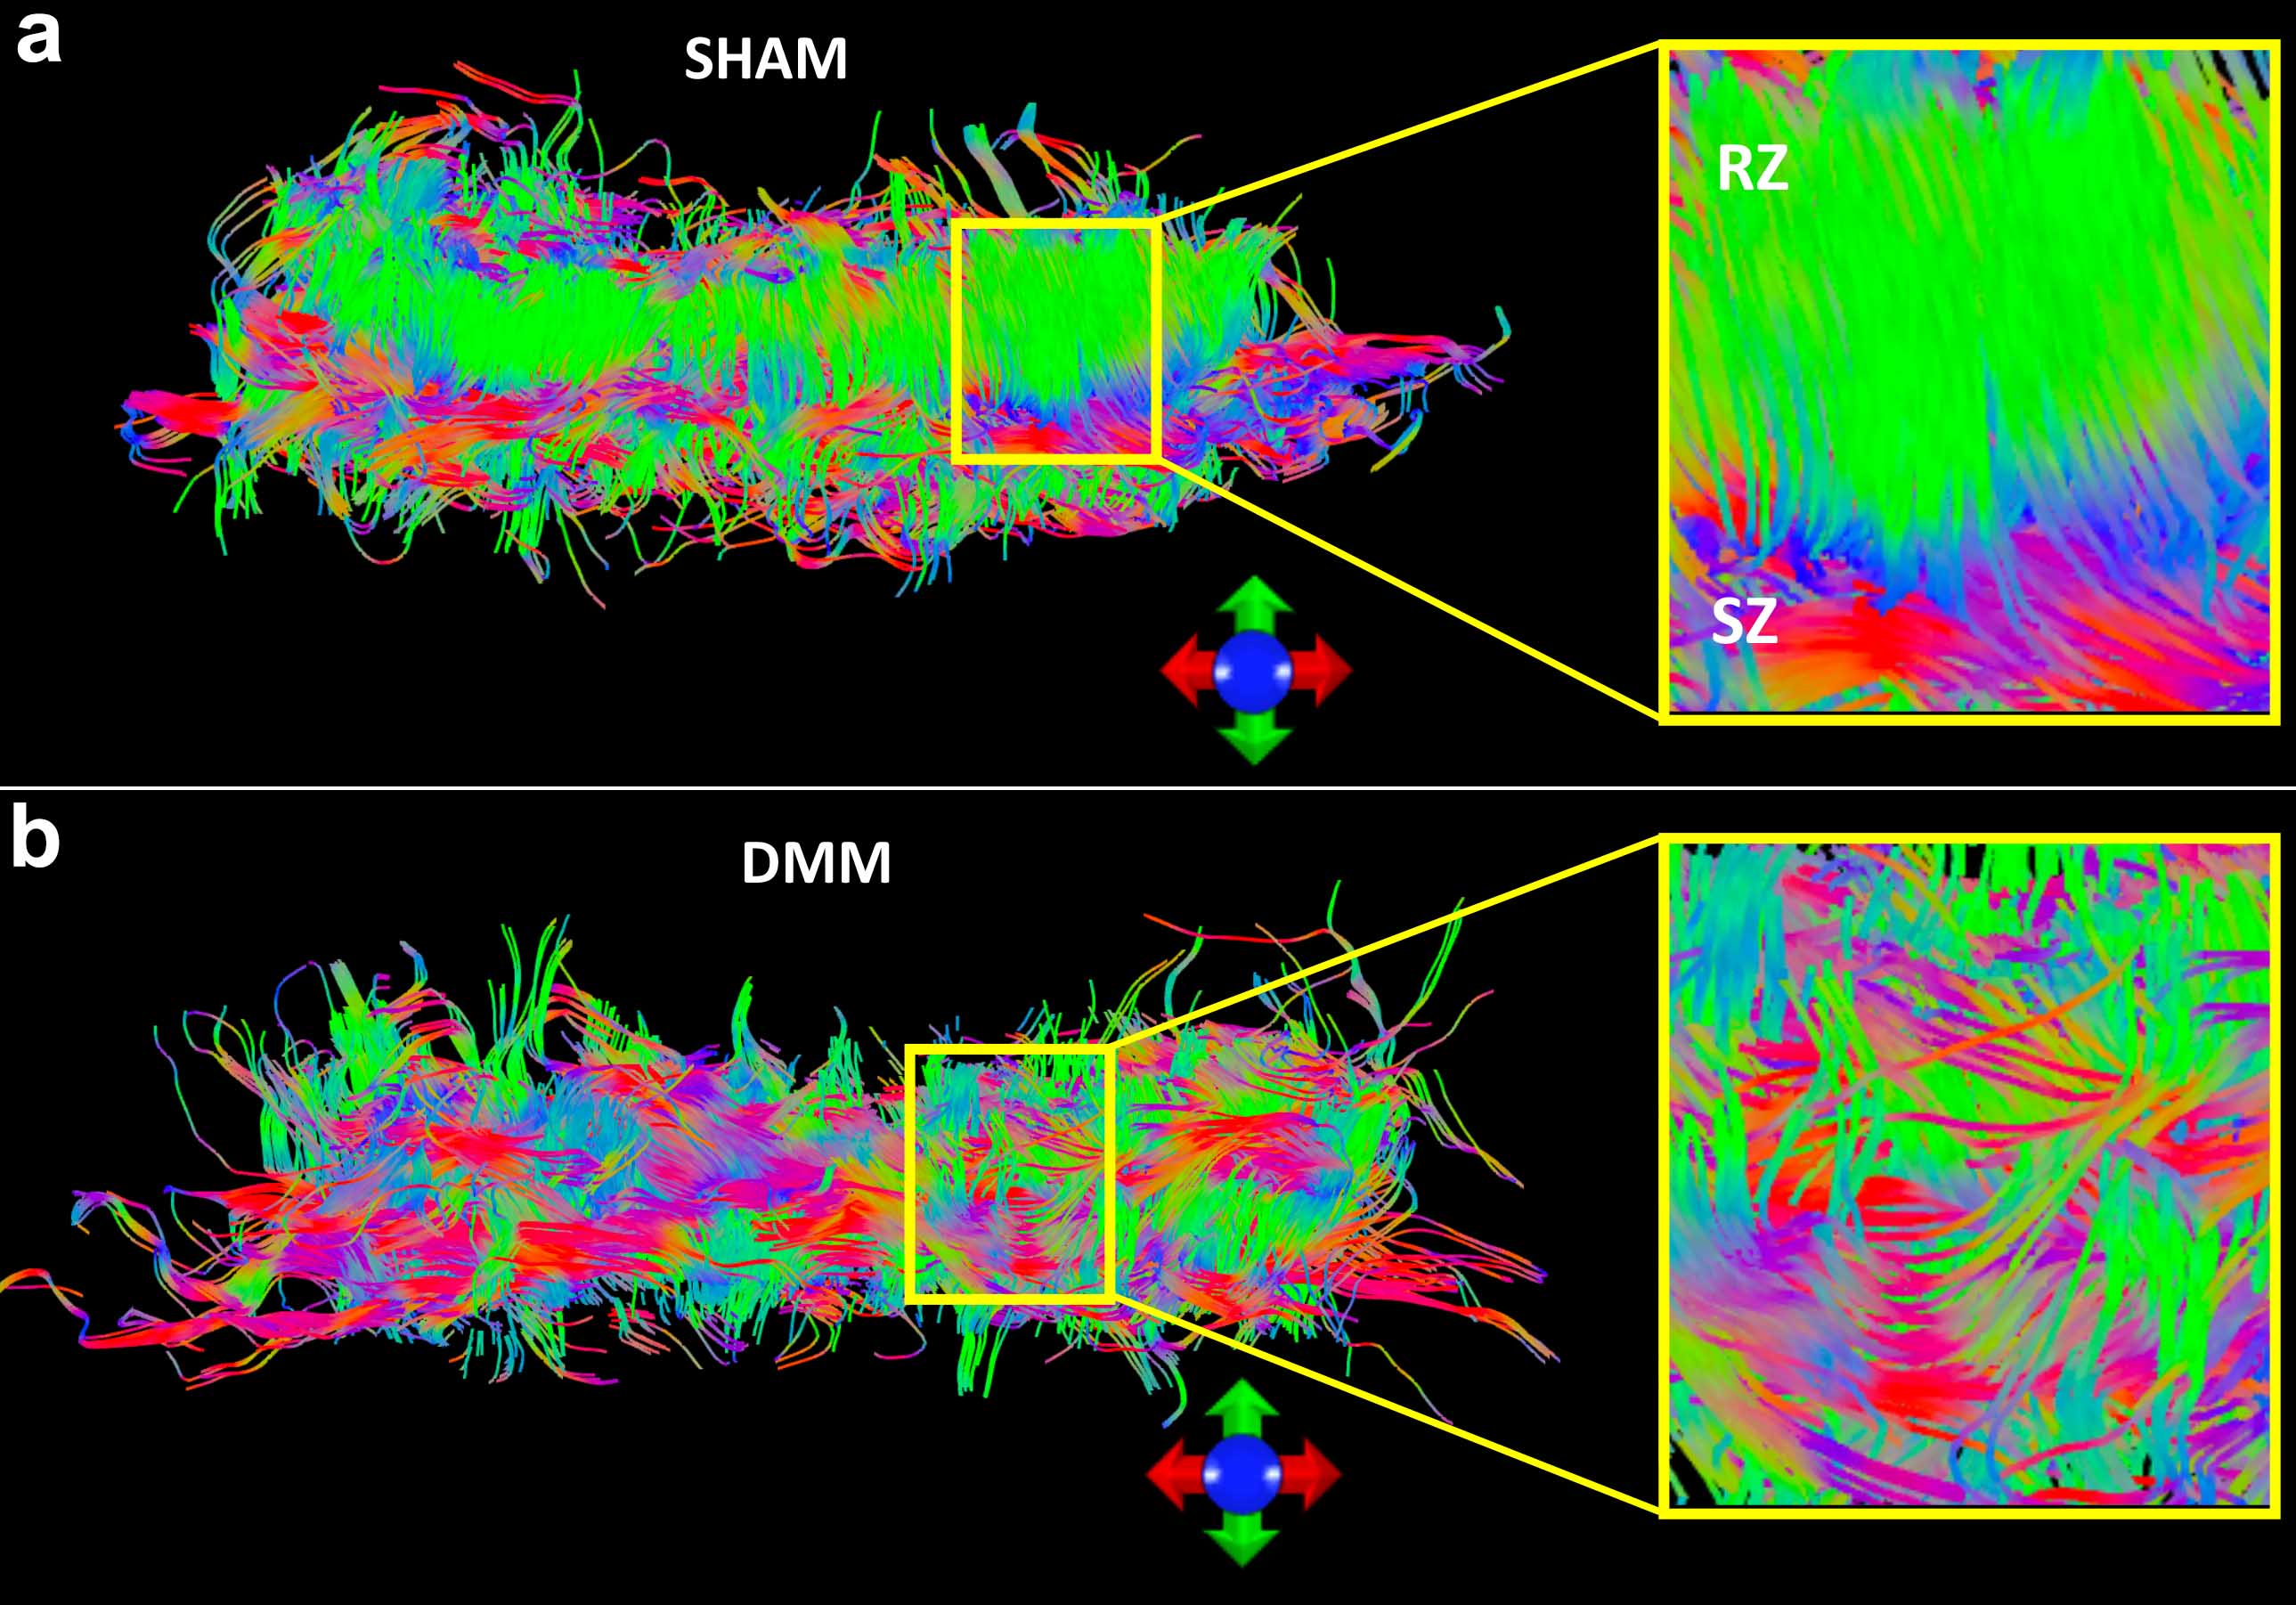
Figure 1 shows b0 and diffusion-weighted images of DMM and SHAM rat knees at 45 µm3 isotropic resolution. Compared to the SHAM group, the cartilage thickness reduced significantly in DMM group with higher intensity in b0 images. The quantitative fractional anisotropy (FA) and mean diffusivity (MD) maps of articular cartilage were illustrated in Figure 2. The FA values reduced after DMM surgery, while the MD values increased after DMM surgery. To quantify the variations of DTI metrics between DMM and SHAM, the mean FA, MD, axial diffusivity (AD), and radial diffusivity (RD) were plotted in Figure 3. The AD values increased about 44.3%, while the MD values increased about 50.1%. The largest variation was found in RD (+ 54.8%), and the smallest variation was found in FA (-32.7%). Figure 4 showed the fiber tracts of articular cartilage for both DMM and SHAM rats. The cartilage of SHAM group exhibited well organized collagen fiber architecture, where radial zone and superficial zone showed orthogonal fiber directions. In contrast, the collagen fiber structure was disrupted after 8 weeks DMM surgery. The cartilage thickness was reduced in DMM by Alcian blue/Picrosirius red stain (Figure 5) and the collagen fiber structure was altered after 8 weeks DMM surgery.Discussion and Conclusion
Lack of noninvasive and molecular-specific markers to detect the early degradation of knee has so far prevented a fundamental understanding the development of OA. The scalar metrics derived from DTI can be more readily to depict both the collagen architecture and proteoglycan concentrations compared to conventional MRI measurements. The dramatic changes in FA and diffusivity properties between DMM and SHAM suggest that high-resolution DTI may provide robust and quantitative biomarkers for exploring the degradation of cartilage. Diffusion tractography affords a unique way to visualize the 3D collagen fiber architecture and the probe the integrity of the soft tissue.Acknowledgements
This work was supported by NIH/NIBIB P41 EB015897, NIH 5R01AR063071, and Charles E. Putman MD Vision Award of the Department of Radiology, Duke University School of Medicine.References
1. Reicher MA, Rauschning W, Gold RH, Bassett LW, Lufkin RB, Glen W, Jr. High-resolution magnetic resonance imaging of the knee joint: normal anatomy. AJR Am J Roentgenol 1985;145(5):895-902.
2. Raya JG. Techniques and applications of in vivo diffusion imaging of articular cartilage. J Magn Reson Imaging 2015;41(6):1487-1504.
3. Raya J G, Melkus G, Adam-Neumair S, Dietrich O, Mützel E, Reiser M F, Putz R, Kirsch T, Jakob P M, Glaser C. Diffusion-tensor imaging of human articular cartilage specimens with early signs of cartilage damage Radiology 2013;266 (3):831-841
4. Wang N, Badar F, Xia Y. Compressed sensing in quantitative determination of GAG concentration in cartilage by microscopic MRI. Magn Reson Med, 2018; 79(6):3163-3171.
5. Yeh FC, Wedeen VJ, Tseng WY. Generalized q-sampling imaging. IEEE Trans Med Imaging 2010;29(9):1626-1635.
6. Wang N, Mirando A J, Cofer G, Qi Y, Hilton M J, Johnson G A. Characterization complex collagen fiber architecture in knee joint using high‐resolution diffusion imaging. Magn. Reson. Med, 2020; 84(2):908-919
Figures